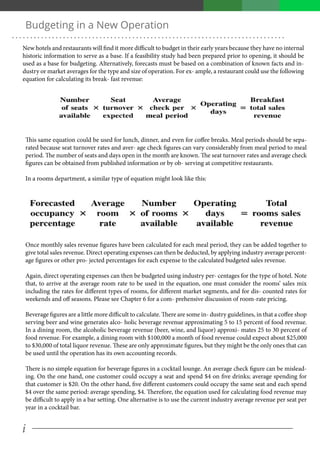
Financial Management
TOPIC
Jl IKPN Bintaro No 1, Pesanggrahan,
Tanah Kusir, Jakarta, Special Capital
Region of Jakarta 12330, Indonesia
BUDGETING IN A NEW
OPERATION
i
. . . . . . . . . . . . . . . . . . . . . . . . . . . . . . . . . . . . . . . . . . . . . . . . . . . . . . . . . . . . . . . . . . . . . . . . . . .
Budgeting in a New Operation
New hotels and restaurants will find it more difficult to budget in their early years because they have no internal
historic information to serve as a base. If a feasibility study had been prepared prior to opening, it should be
used as a base for budgeting. Alternatively, forecasts must be based on a combination of known facts and in-
dustry or market averages for the type and size of operation. For ex- ample, a restaurant could use the following
equation for calculating its break- fast revenue:
This same equation could be used for lunch, dinner, and even for coffee breaks. Meal periods should be sepa-
rated because seat turnover rates and aver- age check figures can vary considerably from meal period to meal
period. The number of seats and days open in the month are known. The seat turnover rates and average check
figures can be obtained from published information or by ob- serving at competitive restaurants.
In a rooms department, a similar type of equation might look like this:
Once monthly sales revenue figures have been calculated for each meal period, they can be added together to
give total sales revenue. Direct operating expenses can then be deducted, by applying industry average percent-
age figures or other pro- jected percentages for each expense to the calculated budgeted sales revenue.
Again, direct operating expenses can then be budgeted using industry per- centages for the type of hotel. Note
that, to arrive at the average room rate to be used in the equation, one must consider the rooms’ sales mix
including the rates for different types of rooms, for different market segments, and for dis- counted rates for
weekends and off seasons. Please see Chapter 6 for a com- prehensive discussion of room-rate pricing.
Beverage figures are a little more difficult to calculate. There are some in- dustry guidelines, in that a coffee shop
serving beer and wine generates alco- holic beverage revenue approximating 5 to 15 percent of food revenue.
In a dining room, the alcoholic beverage revenue (beer, wine, and liquor) approxi- mates 25 to 30 percent of
food revenue. For example, a dining room with $100,000 a month of food revenue could expect about $25,000
to $30,000 of total liquor revenue. These are only approximate figures, but they might be the only ones that can
be used until the operation has its own accounting records.
There is no simple equation for beverage figures in a cocktail lounge. An average check figure can be mislead-
ing. On the one hand, one customer could occupy a seat and spend $4 on five drinks; average spending for
that customer is $20. On the other hand, five different customers could occupy the same seat and each spend
$4 over the same period: average spending, $4. Therefore, the equation used for calculating food revenue may
be difficult to apply in a bar setting. One alternative is to use the current industry average revenue per seat per
year in a cocktail bar.
ii
To convert to a monthly figure for budget purposes, this figure can then be divided by 12 and added to the al-
ready-calculated monthly beverage revenue generated from the food departments. Direct operating expenses
can then be al- located by using industry average percentage guidelines.
Although these equations do not cover all possible approaches, they should give the reader some idea of the
methods that can be used when budgeting for a new operation.
However, the equations illustrated are not limited to a new operation. They could also be used in an ongoing
organization. For example, instead of apply- ing an estimated percentage of sales revenue increase to last year’s
figure for the current year’s budget, it might be better to break down last year’s sales rev- enue figure into its
various elements and adjust each of them individually to de- velop the new budget amount. For example, last
year room’s revenue was $100,200 for June. This year we want a 5 percent increase; therefore budgeting sales
revenue will be
$100,200 x 105% = $105,210
ii

Budgeting in a new operation

  • 1.
    Financial Management TOPIC Jl IKPNBintaro No 1, Pesanggrahan, Tanah Kusir, Jakarta, Special Capital Region of Jakarta 12330, Indonesia BUDGETING IN A NEW OPERATION
  • 2.
    i . . .. . . . . . . . . . . . . . . . . . . . . . . . . . . . . . . . . . . . . . . . . . . . . . . . . . . . . . . . . . . . . . . . . . . . . . . . Budgeting in a New Operation New hotels and restaurants will find it more difficult to budget in their early years because they have no internal historic information to serve as a base. If a feasibility study had been prepared prior to opening, it should be used as a base for budgeting. Alternatively, forecasts must be based on a combination of known facts and in- dustry or market averages for the type and size of operation. For ex- ample, a restaurant could use the following equation for calculating its break- fast revenue: This same equation could be used for lunch, dinner, and even for coffee breaks. Meal periods should be sepa- rated because seat turnover rates and aver- age check figures can vary considerably from meal period to meal period. The number of seats and days open in the month are known. The seat turnover rates and average check figures can be obtained from published information or by ob- serving at competitive restaurants. In a rooms department, a similar type of equation might look like this: Once monthly sales revenue figures have been calculated for each meal period, they can be added together to give total sales revenue. Direct operating expenses can then be deducted, by applying industry average percent- age figures or other pro- jected percentages for each expense to the calculated budgeted sales revenue. Again, direct operating expenses can then be budgeted using industry per- centages for the type of hotel. Note that, to arrive at the average room rate to be used in the equation, one must consider the rooms’ sales mix including the rates for different types of rooms, for different market segments, and for dis- counted rates for weekends and off seasons. Please see Chapter 6 for a com- prehensive discussion of room-rate pricing. Beverage figures are a little more difficult to calculate. There are some in- dustry guidelines, in that a coffee shop serving beer and wine generates alco- holic beverage revenue approximating 5 to 15 percent of food revenue. In a dining room, the alcoholic beverage revenue (beer, wine, and liquor) approxi- mates 25 to 30 percent of food revenue. For example, a dining room with $100,000 a month of food revenue could expect about $25,000 to $30,000 of total liquor revenue. These are only approximate figures, but they might be the only ones that can be used until the operation has its own accounting records. There is no simple equation for beverage figures in a cocktail lounge. An average check figure can be mislead- ing. On the one hand, one customer could occupy a seat and spend $4 on five drinks; average spending for that customer is $20. On the other hand, five different customers could occupy the same seat and each spend $4 over the same period: average spending, $4. Therefore, the equation used for calculating food revenue may be difficult to apply in a bar setting. One alternative is to use the current industry average revenue per seat per year in a cocktail bar.
  • 3.
    ii To convert toa monthly figure for budget purposes, this figure can then be divided by 12 and added to the al- ready-calculated monthly beverage revenue generated from the food departments. Direct operating expenses can then be al- located by using industry average percentage guidelines. Although these equations do not cover all possible approaches, they should give the reader some idea of the methods that can be used when budgeting for a new operation. However, the equations illustrated are not limited to a new operation. They could also be used in an ongoing organization. For example, instead of apply- ing an estimated percentage of sales revenue increase to last year’s figure for the current year’s budget, it might be better to break down last year’s sales rev- enue figure into its various elements and adjust each of them individually to de- velop the new budget amount. For example, last year room’s revenue was $100,200 for June. This year we want a 5 percent increase; therefore budgeting sales revenue will be $100,200 x 105% = $105,210
  • 4.