The document shows the statement of income for Stowe Room Café for the month ending October 31. Total sales were $426,023, with food sales accounting for 76.44% ($325,658) and beverage sales 23.56% ($100,365). Total cost of goods sold was 34% of sales ($144,826). Operating expenses accounted for 47.21% of sales ($201,137) and fixed expenses were 12.68% of sales ($54,000). This resulted in a net income of 4.47% of total sales ($19,023).
1.
Prepare and analize the common statement for Anandam Manufacturing Company. Show all
calculations.
2.
Prepare and analize the cash flow statement for Anandam Manufacturing Company. Show all
calculations.
3.
Calculate the ratios based on case Exhibit 3. Show all calculations. Based on financial analysis
of financial statements, would a loan officer grant a loan to Anandam financial company?
EXHIBIT 3: INDUSTRY AVERAGE OF KEY RATIos Sector Average Ratio 2:301 Current
ratio Acid test ratio (quick ratio) 120 Receivable tunover ratioimes turnover 52 days Receivable
days Inventory turmover ratio Inventory days Long-term detttototal debt Debt-to-equity ratio
Gross profit rato Net profit ratio Retun on equity Retum on total assets 4.85 times 75 days 24%
35% 40% 18% 22% 10% Total asset turnover ratio Ti Fixed asset turnover ratio Current asset
tunover ratio3 interest coverage ratio (tmes 10 nterest earned Warking captal smover ratio Retu
on ed sset
Solution
1….Common -size Income statement 2012-13 % to Total sales 2013-14 % to Total sales
2014-15 % to Total sales Analysis of % to Total sales proportion Sales Cash 200 10.00%
480 10.00% 800 10.00% Credit 1800 90.00% 4320 90.00% 7200 90.00% Total Sales 2000
100.00% 4800 100.00% 8000 100.00% COGS 1240 62.00% 2832 59.00% 4800 60.00%
COGS has reduced in the last 2 yrs. Gross profit 760 38.00% 1968 41.00% 3200 40.00% so,
G/P has increased Operating Expenses: Gen.adm.& sell.exp. 80 4.00% 450 9.38% 1000
12.50% % to sales has doubled in 2013-14 & increased by more than 25% in 2014-15
Depreciation 100 5.00% 400 8.33% 660 8.25% Has increased by 3% in the last 2 yrs.
Int.exp.(on borrowings) 60 3.00% 158 3.29% 340 4.25% Has slightly increased in 2014-15
Profit before tax(PBT) 520 26.00% 960 20.00% 1200 15.00% PBT% has reduced gradually in
both the yrs.due to increase in all operating expenses esp.gen admn.& sell exp. Tax at 30% 156
7.80% 288 6.00% 360 4.50% Decrease % due to decrease in profit % Profit after tax(PAT) 364
18.20% 672 14.00% 840 10.50% PAT% has reduced gradually in both the yrs.due to increase in
all operating expenses esp.gen admn.& sell exp. Common-size Balance
Sheet Assets % to Total % to Total % to Total Fixed assets(net of dep) 1900 74.22%
2500 44.64% 4700 51.33% Assets have decreased to the total Current assets Cash & Cash
equivalents 40 1.56% 100 1.79% 106 1.16% Slight variation in ratio to total Accounts
Receivables 300 11.72% 1500 26.79% 2100 22.94% Has increased in 2013-14 & again
decreased in 2014-15 Inventories 320 12.50% 1500 26.79% 2250 24.57% Has increased in
2013-14 & again decreased in 2014-15 Total 2560 100.00% 5600 100.00% 9156 100.00%
Equity & Liabilities Equity share capital($ 10) 1200 46.88% 1600 28.57% 2000 21.84%
Decreased steadily in all the 2 yrs. Reserves & surplus 364 14.22% 1036 18.50% 1876 20.49%
Increased steadily in both 2 yrs.due to increase in $ net income in those yrs. Long-term
borrowings 736 28.75% 1236 22.07% 2500 27.30% Decreased in 2013-14 & again increased i.
Income statement Functional Format,Linear cost Function,Method of Analyzing cost,Comparison of variable costing , unit cost computation, Illustration of variable costing , evaluation of results. Managerial Accounting
Financial statement analysis (or financial analysis) is the process of reviewing and analyzing a company's financial statements. These statements include the Income Statement, Balance Sheet, and Statement of Cash Flows. Financial statement analysis is a method or process involving specific techniques for evaluating risks, financial health, and future prospects of an organization. It is used by investors, stakeholders, the public, and decisionmakers within the organization. Popular methods of financial statement analysis include horizontal and vertical analysis and the use of financial ratios.
This deck consists of total of twenty slides. It has PPT slides highlighting important topics of Budget Variance Analysis Powerpoint Presentation Slides. This deck comprises of amazing visuals with thoroughly researched content. Each template is well crafted and designed by our PowerPoint experts. Our designers have included all the necessary PowerPoint layouts in this deck. From icons to graphs, this PPT deck has it all. The best part is that these templates are easily customizable. Just click the DOWNLOAD button shown below. Edit the colour, text, font size, add or delete the content as per the requirement. Download this deck now and engage your audience with this ready made presentation.
an analysis Project for Edta Financial Statements From (2016:2019) and Comparing to Peers (Domty & Obourland) This analysis was a part of Accounting for Managers Subject in My Study For MBA
In 2018, I sold a two-unit restaurant concept called Big Buns to the largest minority-owned contract food service company in the United States. The first location was delivered to me as a cold dark shell in a poorly located nine-story office building with a parking garage below. If you are ever considering putting a restaurant in a retail location that matches this description, please walk away now. The tenant improvement package was sizable, but ended up being insignificant after retrofitting a poorly planned retail space in a brand-new building with a restaurant. This project ended up costing roughly $425 a square foot to build-out – an $868k investment spread out over 2,042 square feet.
Cracking the Workplace Discipline Code Main.pptxWorkforce Group
Cultivating and maintaining discipline within teams is a critical differentiator for successful organisations.
Forward-thinking leaders and business managers understand the impact that discipline has on organisational success. A disciplined workforce operates with clarity, focus, and a shared understanding of expectations, ultimately driving better results, optimising productivity, and facilitating seamless collaboration.
Although discipline is not a one-size-fits-all approach, it can help create a work environment that encourages personal growth and accountability rather than solely relying on punitive measures.
In this deck, you will learn the significance of workplace discipline for organisational success. You’ll also learn
• Four (4) workplace discipline methods you should consider
• The best and most practical approach to implementing workplace discipline.
• Three (3) key tips to maintain a disciplined workplace.
Improving profitability for small businessBen Wann
In this comprehensive presentation, we will explore strategies and practical tips for enhancing profitability in small businesses. Tailored to meet the unique challenges faced by small enterprises, this session covers various aspects that directly impact the bottom line. Attendees will learn how to optimize operational efficiency, manage expenses, and increase revenue through innovative marketing and customer engagement techniques.
Premium MEAN Stack Development Solutions for Modern BusinessesSynapseIndia
Stay ahead of the curve with our premium MEAN Stack Development Solutions. Our expert developers utilize MongoDB, Express.js, AngularJS, and Node.js to create modern and responsive web applications. Trust us for cutting-edge solutions that drive your business growth and success.
Know more: https://www.synapseindia.com/technology/mean-stack-development-company.html
3.0 Project 2_ Developing My Brand Identity Kit.pptxtanyjahb
A personal brand exploration presentation summarizes an individual's unique qualities and goals, covering strengths, values, passions, and target audience. It helps individuals understand what makes them stand out, their desired image, and how they aim to achieve it.
Buy Verified PayPal Account | Buy Google 5 Star Reviewsusawebmarket
Buy Verified PayPal Account
Looking to buy verified PayPal accounts? Discover 7 expert tips for safely purchasing a verified PayPal account in 2024. Ensure security and reliability for your transactions.
PayPal Services Features-
🟢 Email Access
🟢 Bank Added
🟢 Card Verified
🟢 Full SSN Provided
🟢 Phone Number Access
🟢 Driving License Copy
🟢 Fasted Delivery
Client Satisfaction is Our First priority. Our services is very appropriate to buy. We assume that the first-rate way to purchase our offerings is to order on the website. If you have any worry in our cooperation usually You can order us on Skype or Telegram.
24/7 Hours Reply/Please Contact
usawebmarketEmail: support@usawebmarket.com
Skype: usawebmarket
Telegram: @usawebmarket
WhatsApp: +1(218) 203-5951
USA WEB MARKET is the Best Verified PayPal, Payoneer, Cash App, Skrill, Neteller, Stripe Account and SEO, SMM Service provider.100%Satisfection granted.100% replacement Granted.
VAT Registration Outlined In UAE: Benefits and Requirementsuae taxgpt
Vat Registration is a legal obligation for businesses meeting the threshold requirement, helping companies avoid fines and ramifications. Contact now!
https://viralsocialtrends.com/vat-registration-outlined-in-uae/
Putting the SPARK into Virtual Training.pptxCynthia Clay
This 60-minute webinar, sponsored by Adobe, was delivered for the Training Mag Network. It explored the five elements of SPARK: Storytelling, Purpose, Action, Relationships, and Kudos. Knowing how to tell a well-structured story is key to building long-term memory. Stating a clear purpose that doesn't take away from the discovery learning process is critical. Ensuring that people move from theory to practical application is imperative. Creating strong social learning is the key to commitment and engagement. Validating and affirming participants' comments is the way to create a positive learning environment.
Business Valuation Principles for EntrepreneursBen Wann
This insightful presentation is designed to equip entrepreneurs with the essential knowledge and tools needed to accurately value their businesses. Understanding business valuation is crucial for making informed decisions, whether you're seeking investment, planning to sell, or simply want to gauge your company's worth.
Skye Residences | Extended Stay Residences Near Toronto Airportmarketingjdass
Experience unparalleled EXTENDED STAY and comfort at Skye Residences located just minutes from Toronto Airport. Discover sophisticated accommodations tailored for discerning travelers.
Website Link :
https://skyeresidences.com/
https://skyeresidences.com/about-us/
https://skyeresidences.com/gallery/
https://skyeresidences.com/rooms/
https://skyeresidences.com/near-by-attractions/
https://skyeresidences.com/commute/
https://skyeresidences.com/contact/
https://skyeresidences.com/queen-suite-with-sofa-bed/
https://skyeresidences.com/queen-suite-with-sofa-bed-and-balcony/
https://skyeresidences.com/queen-suite-with-sofa-bed-accessible/
https://skyeresidences.com/2-bedroom-deluxe-queen-suite-with-sofa-bed/
https://skyeresidences.com/2-bedroom-deluxe-king-queen-suite-with-sofa-bed/
https://skyeresidences.com/2-bedroom-deluxe-queen-suite-with-sofa-bed-accessible/
#Skye Residences Etobicoke, #Skye Residences Near Toronto Airport, #Skye Residences Toronto, #Skye Hotel Toronto, #Skye Hotel Near Toronto Airport, #Hotel Near Toronto Airport, #Near Toronto Airport Accommodation, #Suites Near Toronto Airport, #Etobicoke Suites Near Airport, #Hotel Near Toronto Pearson International Airport, #Toronto Airport Suite Rentals, #Pearson Airport Hotel Suites
Implicitly or explicitly all competing businesses employ a strategy to select a mix
of marketing resources. Formulating such competitive strategies fundamentally
involves recognizing relationships between elements of the marketing mix (e.g.,
price and product quality), as well as assessing competitive and market conditions
(i.e., industry structure in the language of economics).
Unveiling the Secrets How Does Generative AI Work.pdfSam H
At its core, generative artificial intelligence relies on the concept of generative models, which serve as engines that churn out entirely new data resembling their training data. It is like a sculptor who has studied so many forms found in nature and then uses this knowledge to create sculptures from his imagination that have never been seen before anywhere else. If taken to cyberspace, gans work almost the same way.
ENTREPRENEURSHIP TRAINING.ppt for graduating class (1).ppt
Income Statement
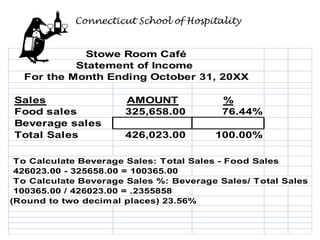
1. Connecticut School of Hospitality
Stowe Room Café
Statement of Income
For the Month Ending October 31, 20XX
Sales AMOUNT %
Food sales 325,658.00 76.44%
Beverage sales
Total Sales 426,023.00 100.00%
To Calculate Beverage Sales: Total Sales - Food Sales
426023.00 - 325658.00 = 100365.00
To Calculate Beverage Sales %: Beverage Sales/ Total Sales
100365.00 / 426023.00 = .2355858
(Round to two decimal places) 23.56%
2. Stowe Room Café
Statement of Income
For the Month Ending October 31, 20XX
Sales AMOUNT %
Food sales 325,658.00 76.44%
Beverage sales 100,365.00 23.56%
Total Sales 426,023.00 100.00%
To Calculate Beverage Sales: Total Sales - Food Sales
426023.00 - 325658.00 = 100365.00
To Calculate Beverage Sales %: Beverage Sales/ Total Sales
100365.00 / 426023.00 = .2355858
(Round to two decimal places) 23.56%
3. Cost of Goods Sold
Cost of food sold 38.00%
Cost of beverage sold 21,076.65
Total Cost of Goods Sold
Cost of Food Sold is 38% of Food Sales
325658.00 x .38 = 123750.04
Cost of Beverage Sold / Beverage Sales gives %
21076.65 / 100365.00 = .21 or 21%
Total Cost of Goods Sold =
Cost of Food Sold + Cost of Beverage Sold
123750.04 + 21076.65 = 144826.69
4. Cost of Goods Sold
Cost of food sold 123,750.04 38.00%
Cost of beverage sold 21,076.65 21.00%
Total Cost of Goods Sold 144,826.69 34.00%
Cost of Food Sold is 38% of Food Sales
325658.00 x .38 = 123750.04
Cost of Beverage Sold / Beverage Sales gives %
21076.65 / 100365.00 = .21 or 21%
Total Cost of Goods Sold =
Cost of Food Sold + Cost of Beverage Sold
123750.04 + 21076.65 = 144826.69
Total Cost of Goods Sold / Total Sales = %
144826.69 / 426023.00 = .3399504 or 34%
5. AMOUNT %
Sales
Food sales 325,658.00 76.44%
Beverage sales 100,365.00 23.56%
Total Sales 426,023.00 100.00%
Cost of Goods Sold
Cost of food sold 123,750.04 38.00%
Cost of beverage sold 21,076.65 21.00%
Total Cost of Goods Sold 144,826.69 34.00%
Gross Profit 281,196.31 66.00%
Gross Profit = Total Sales - Total Cost of Goods Sold
Gross Profit : 426023.00 - 144826.69 = 281196.31
Gross Profit % : Gross Profit / Total Sales
281196.31 / 426023 = .6600495 or 66%
6. OPERATING EXPENSES
Salary & wages 125,500.00
Employee benefits 31,375.00
Direct operating expenses 6,800.00
Marketing 15,000.00
Administrative & general expenses 7,412.00
Repairs & maintenance 2,850.00
Utilities 12,200.00
Total Operating Expenses
To Calculate the % of each Operating Expense
Divide the Operating Expense by the Total Sales
Example: Salary & Wages 125500.00 / 426023.00 = .294585 or 29.46%
Add all Operating Expenses to get Total Operating Expenses
7. OPERATING EXPENSES
Salary & wages 125,500.00 29.46%
Employee benefits 31,375.00 7.36%
Direct operating expenses 6,800.00 1.60%
Marketing 15,000.00 3.52%
Administrative & general expenses 7,412.00 1.74%
Repairs & maintenance 2,850.00 0.67%
Utilities 12,200.00 2.86%
Total Operating Expenses 201,137.00 47.21%
To Calculate the % of each Operating Expense
Divide the Operating Expense by the Total Sales
Example: Salary & Wages 125500.00 / 426023.00 = .294585 or 29.46%
Add all Operating Expenses to get Total Operating Expenses
8. Fixed Expenses
Rent 32,500.00
Interest
Depreciation 10,500.00
Total Fixed Expenses 54,000.00
To Calculate Interest: Total Fixed Expenses - Rent - Depreciation
54000.00 - 32500.00 - 10500.00 = 11000.00
To Calculate % : The Fixed Expense / Total Sales
Example: 32500.00 / 426023.00 = .0762869 or 7.63%
9. Fixed Expenses
Rent 32,500.00 7.63%
Interest 11,000.00 2.58%
Depreciation 10,500.00 2.46%
Total Fixed Expenses 54,000.00 12.68%
To Calculate Interest: Total Fixed Expenses - Rent - Depreciation
54000.00 - 32500.00 - 10500.00 = 11000.00
To Calculate % : The Fixed Expense / Total Sales
Example: 32500.00 / 426023.00 = .0762869 or 7.63%
10. Operating Income Before Taxes 26,059.31 6.12%
Income Taxes (27%)
To Calculate Income Tax: 27% of Income Before Taxes
26059.31 x .27 = 7036.01
To Calculate Income Tax %: Income Tax / Total Sales
7036.01 / 426023.00 = .0165155 or 1.65%
Net Income/Loss
To Calculate Net Income or Loss:
Total Sales - Total Cost of Goods Sold - Total Operating Expenses - Income T
426023.00 - 144826.69 - 201137.00 - 7036.01 = 19023.30
To Calculate Net Income or Loss %
19023.30 / 426023.00 = .0446532 or 4.47%
11. Operating Income Before Taxes 26,059.31 6.12%
Income Taxes (27%) 7,036.01 1.65%
To Calculate Income Tax: 27% of Income Before Taxes
26059.31 x .27 = 7036.01
To Calculate Income Tax %: Income Tax / Total Sales
7036.01 / 426023.00 = .0165155 or 1.65%
Net Income/Loss 19,023.30 4.47%
To Calculate Net Income or Loss:
Total Sales - Total Cost of Goods Sold - Total Operating Expenses - Income T
426023.00 - 144826.69 - 201137.00 - 7036.01 = 19023.30
To Calculate Net Income or Loss %
19023.30 / 426023.00 = .0446532 or 4.47%