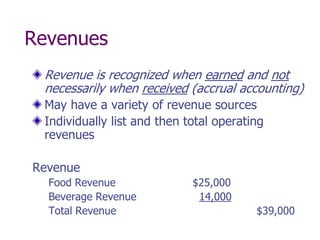
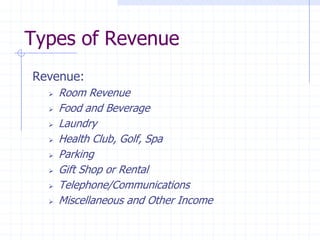
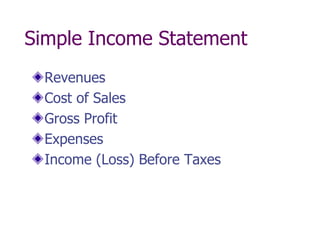
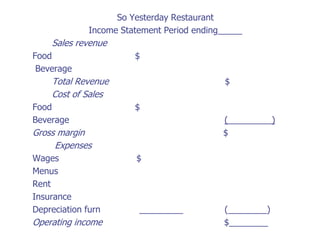
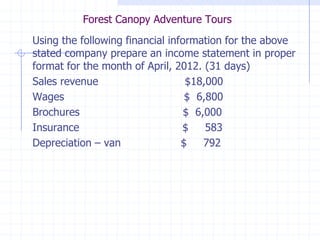
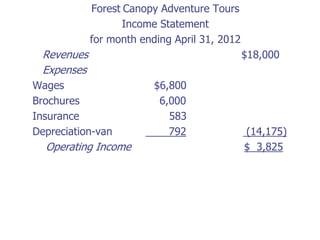
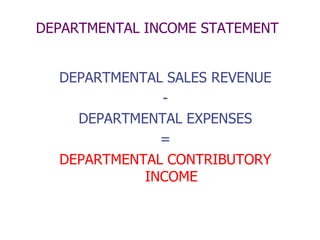
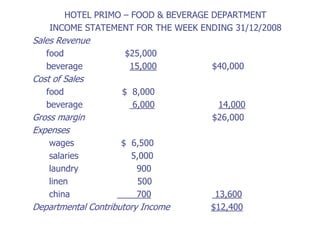
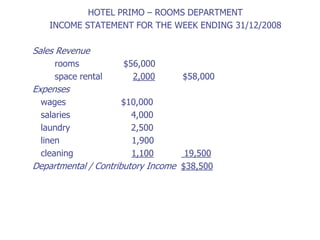
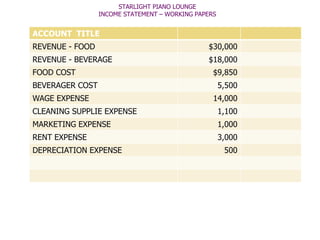
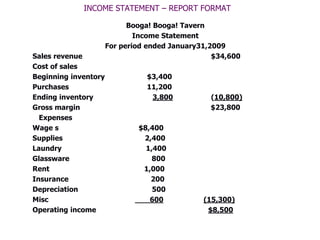
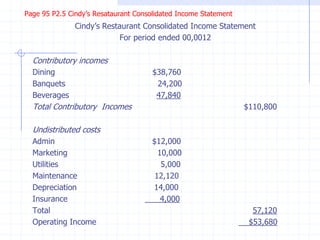
Booga! Booga! Tavern
Income Statement
For the Period Ended Jan 31, 0012
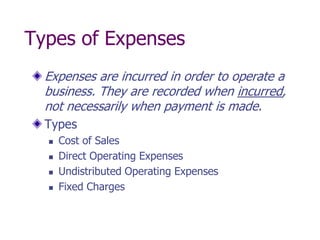
The income statement shows total sales revenue of $34,600 with a cost of sales of $10,800 resulting in a gross profit of $23,800. Operating expenses included wages of $8,000, resulting in operating income of $15,800.