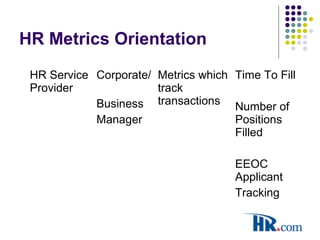
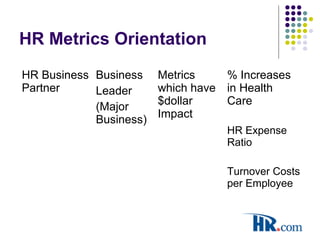
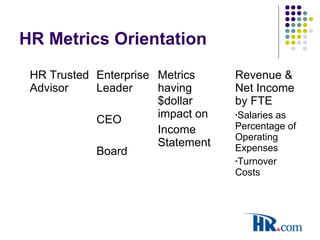
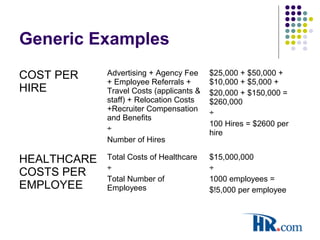
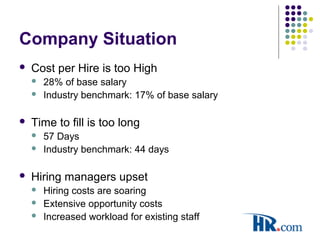
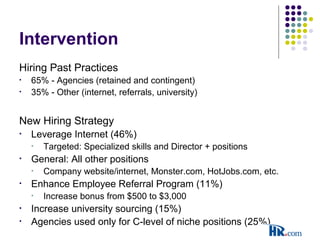
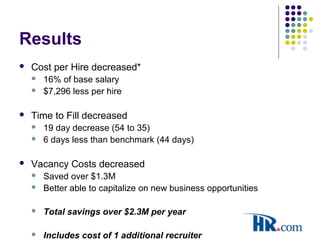
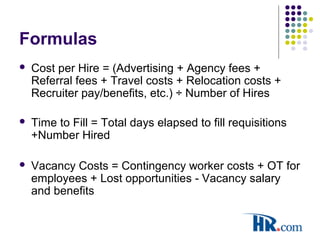
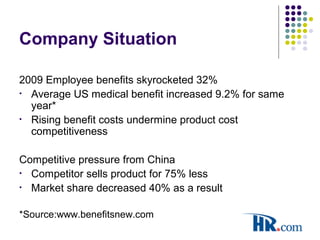
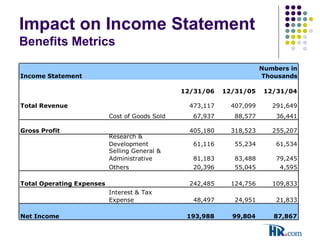
HR Metrics:
Speaking the Language of Your CFO
HR.com Presentation
December 12, 2011
Presented by:
Robert J. Buckley, MBA
RO Buckley Consulting
Agenda
 Why Are We Here?
 Characteristics of High Credibility HR Metrics
 Generic Examples
 Case Studies
 Recruiting Metrics
 Benefits Metrics
 The Future of HR Metrics
 Q&A
Compensation Tie-In
Why Are We Here Today?
 We are here to learn ways to communicate
better with our CFO’s
 Communication courses for HR Professionals
 Finance is the language of business
 HR needs to step up and be a business
partner
 HR Metrics: The HR “dialect” to
communicate in Finance
Finance HRGAAP ?
Characteristics of Quality
HR Metrics
 Accurate
 Consistently engineered
 There are no GAAP or FASB Rules for HR Metrics
 Fully integrated into the business
 Driven by business strategy
 Impact measured in $dollars (Finance)
 Enabled by technology
 The level of HR metric used is driven by the
needs of both client and provider
HR Metrics Orientation
HR Service
Provider
Corporate/
Business
Manager
Metrics which
track
transactions
Time To Fill
Number of
Positions
Filled
EEOC
Applicant
Tracking
HR Metrics Orientation
HR Business
Partner
Business
Leader
(Major
Business)
Metrics
which have
$dollar
Impact
% Increases
in Health
Care
HR Expense
Ratio
Turnover Costs
per Employee
HR Metrics Orientation
HR Trusted
Advisor
Enterprise
Leader
CEO
Board
Metrics
having
$dollar
impact on
Income
Statement
Revenue &
Net Income
by FTE
•Salaries as
Percentage of
Operating
Expenses
•Turnover
Costs
Generic Examples
COST PER
HIRE
Advertising + Agency Fee
+ Employee Referrals +
Travel Costs (applicants &
staff) + Relocation Costs
+Recruiter Compensation
and Benefits
÷
Number of Hires
$25,000 + $50,000 +
$10,000 + $5,000 +
$20,000 + $150,000 =
$260,000
÷
100 Hires = $2600 per
hire
HEALTHCARE
COSTS PER
EMPLOYEE
Total Costs of Healthcare
÷
Total Number of
Employees
$15,000,000
÷
1000 employees =
$!5,000 per employee
Generic Examples
REVENUE
PER
EMPLOYEE (or
FTE’s)
Revenue
÷
Total Number of
Employees (or FTE’s)
$120,000,000
÷
1000 (1037) = $120,000
TIME TO FILL Total Days Elapsed to Fill
Requisition
÷
Number of Employees
Hired
3347
÷
100 = 33.47 (Average
number of days to fill a
requisition)
Generic Examples
TRAINING
INVESTMENT
PER
EMPLOYEE
Total Training Costs +
(Opportunity Costs)
÷
Headcount
$6,000,000 +
($50,000,000/220 working
days = $227,273 daily
payroll costs X 5 days of
training) $1,136,365 =
$7,136,365
÷
1000 employees = $7,136
Training Investment per
Employee
TURNOVER
RATE
Number of separations
during month
÷
Number of employees on
payroll during the month
X100
167
÷
1000 employees = 16.7%
Turnover Rate
Generic Examples
TURNOVER
COSTS PER
EMPLOYEE
Total cost of separation +
replacement costs + training
costs + vacancy costs
(contingency worker costs -
wages and benefits not paid
because of vacancy)
÷
Number of employees
$8,800,000
÷
1000 = $88,000
Turnover costs per
employee
Recruiting Metrics
Case Study
Company Situation
 Cost per Hire is too High
 28% of base salary
 Industry benchmark: 17% of base salary
 Time to fill is too long
 57 Days
 Industry benchmark: 44 days
 Hiring managers upset
 Hiring costs are soaring
 Extensive opportunity costs
 Increased workload for existing staff
Intervention
Hiring Past Practices
• 65% - Agencies (retained and contingent)
• 35% - Other (internet, referrals, university)
New Hiring Strategy
• Leverage Internet (46%)
• Targeted: Specialized skills and Director + positions
• General: All other positions
• Company website/internet, Monster.com, HotJobs.com, etc.
• Enhance Employee Referral Program (11%)
• Increase bonus from $500 to $3,000
• Increase university sourcing (15%)
• Agencies used only for C-level of niche positions (25%)
Results
 Cost per Hire decreased*
 16% of base salary
 $7,296 less per hire
 Time to Fill decreased
 19 day decrease (54 to 35)
 6 days less than benchmark (44 days)
 Vacancy Costs decreased
 Saved over $1.3M
 Better able to capitalize on new business opportunities
 Total savings over $2.3M per year
 Includes cost of 1 additional recruiter
Formulas
 Cost per Hire = (Advertising + Agency fees +
Referral fees + Travel costs + Relocation costs +
Recruiter pay/benefits, etc.) ÷ Number of Hires
 Time to Fill = Total days elapsed to fill requisitions
+Number Hired
 Vacancy Costs = Contingency worker costs + OT for
employees + Lost opportunities - Vacancy salary
and benefits
Financial Impact
Expense Type 2009 2010 HR Metric Applied 2009 2010
Hire 135 135 Cost per Hire 17,234 9,938
Agency Fees % Base Salary 28% 16%
Retainer 400,000 73,000 Time to Fill 57 38
Contingent 1,350,078 496,831 Days Vacant 7,685 5,139
Vacancy/Opportunity
University 128,000 162,000 Cost per Day 559 582
Internet 157,998 162,000 Vacancy/Opportunity
Cost per year 4,305,143 2,984,914
Employee Referrals 3,000 45,000 Savings 1,320,229
Other (Relocation,
travel, recruiter
salaries, etc.) 287,514 353,280
TOTAL 2,326,590 353,280
Savings 984,935 Overall Savings 2,305,163
42%
Impact on Income Statement
Recruiting Metrics
Income Statement
Numbers in
Thousands
12/30/2010 12/30/2009 12/30/2008
Total Revenue 52,516,000 45,188,000 32,373,000
Cost of Goods Sold 7,541,000 9,832,000 4,045,000
Gross Profit 44,875,000 35,356,000 28,328,000
Research &
Development 6,783,857 6,131,000 6,830,294
Selling General &
Administrative 8,993,296 9,267,136 6,301,653
Others 2,264,009 6,110,000 510,000
Total Operating Expenses 26,933,838 13,847,864 14,686,054
Interest & Tax
Expense 5,386,768 2,769,573 2,937,211
Net Income 21,547,071 11,078,291 11,748,843
Benefits Metrics
Case Study
Company Situation
2009 Employee benefits skyrocketed 32%
• Average US medical benefit increased 9.2% for same
year*
• Rising benefit costs undermine product cost
competitiveness
Competitive pressure from China
• Competitor sells product for 75% less
• Market share decreased 40% as a result
*Source:www.benefitsnew.com
Intervention
Decrease Costs
 Join a consortium to increase buying power and reduce
fees
 Transition from fully-insured to self-insured
Redeploy Headcount
 Move manufacturing team offshore to increase product
cost competitiveness by lowering benefits costs
Decrease Administrative Costs
 Implement an employee self-service system
 Decrease benefit administrator headcount
Results
 Decrease key benefits costs
 US: Monthly benefit cost per head
 Before: $255/head; After: $214/head
 Redeploy headcount
 US: (decrease headcount) Benefit savings = $36M-$10M=$26M
decrease
 Asia: (increase headcount) benefit costs = $42M inc. $46M=$4M
increase.
 US benefit savings ($26M)-Asian Benefit Cost ($4M) = ($22)
Total Benefit savings (increased cash in balance sheet)
 Decrease administrative costs
 Previous salaries 400K-New Salaries 50K = $350K savings
 New self service cost 200K - Previous IT cost 52K = 148K IT cost
 350K-148K = 202K Total Savings
Formulas
Savings Cost Increase
Benefit Savings:
US benefit cost per head X
Benefit Savings per head =
Reduced benefit cost per head
Headcount Reduction:
US: The average cost per head
X Decrease in headcount* =
Total Savings (Comp &
Benefits)
* Includes the 7 Ben Admin
RIFs
Headcount Increase:
Asia: The average benefit cost
per Asian local national X
Increase in headcount = Benefit
costs
Employee Self Service:
Cost of self service
administrative service (IT costs)
Financial Impact
Before After Before After Delta
US Comp &
Benefits 10,041 4,800 639,401,178 298,971,794 340,429,384
Asian Comp &
Benefits 57,000 62,241 726,408,000 793,199,304 -66,791,304
Administrative
Headcount
Reduction 8 1 400,000 50,000 350,000
Employee Self
Service (IT) Minimal Full Range 52,378 200,000 -147,622
Total 67,049 67,042 1,366,261,556 1,092,421,098 273,840,458
Headcount Change Total Benefit Costs
Impact on Income Statement
Benefits Metrics
Income Statement
Numbers in
Thousands
12/31/06 12/31/05 12/31/04
Total Revenue 473,117 407,099 291,649
Cost of Goods Sold 67,937 88,577 36,441
Gross Profit 405,180 318,523 255,207
Research &
Development 61,116 55,234 61,534
Selling General &
Administrative 81,183 83,488 79,245
Others 20,396 55,045 4,595
Total Operating Expenses 242,485 124,756 109,833
Interest & Tax
Expense 48,497 24,951 21,833
Net Income 193,988 99,804 87,867
Compensation Tie-in
Compensation is the alignment mechanism that is most
effective in an organization…
Return on Training Expense
TRAINING INVESTMENT PER
EMPLOYEE
Total Training Costs +
(Opportunity Costs)
÷
Headcount
$6,000,000 +
($50,000,000/220 working days
= $227,273 daily payroll costs
X 5 ΔΔΔdays of training)
$1,136,365 = $7,136,365
÷
1000 employees = $7,136
Training Investment per
Employee
ROTE= Avg. Training
Investment per EE ÷ Δ in Group
Revenue (at a time interval) X Δ
in Group Revenue (at a time
interval) ÷ Avg Dept Wage
7136 ÷ 20,000,000 X 20,000,000
÷ 75,000 = 9.5%
ROI = 9.5%
If the WACC is 7% < 9.5
Training is making the company
money. Your CFO will approve
this EVERY TIME.
The Future of HR Metrics
Business Intelligence
• PREDICTING THE PRESENT
• Harrah’s Entertainment, Citibank, CVS and Dunkin’
Donuts are almost there with an approximately 6 week
lag in their business intelligence systems
• Real-time Opportunity reporting + real-time risk detection
reporting = real-time enterprise reporting THE ABILITY
TO REACT.
• Business intelligence technology firms are currently
embedding HR Metrics into their Business Intelligence
Dashboards for CEO’s and “C” level execitives
(SAP/Business Objects, IBM/Cognos, Oracle/Hyperion)
The Future of HR Metrics
Business Intelligence
• Do you really want to have technology and finance
experts construct the metrics that HR will be judged by?-
The time to become involved in HR Metrics is NOW!
• Success stories for HR Metrics
• William Clay Ford (Ford) includes the success rate of HR in
recruiting and retaining high performing salespeople as an HR
metric in his BI Dashboard
• Jeff Immelt (GE) includes the ratings of the developmental
experiences of his high potentials as an HR metric in his BI
Dashboard
One of the Most Important HR Metrics
Adding Value to Your Personal Bottom Line
What is the value of today’s discussion of HR Metrics for
you?
• Formula (Very Conservative)
• Annual Compensation X Percentage Productivity Increase -
($Dollar Cost + Opportunity Costs*) = Net Value
• Financial Impact Impact
• $75,000 X .005 (.5%) - ($0 + $42.61*) = $332.39
Net Value to You As a Participant
*opportunity cost ($75,000/220 working days/8 per day = $42.61)
Summary
• Some Final Thoughts
• HR Metrics are formula-driven and easy to use
• HR Metrics and BI are fast becoming “the way we do
things around here” - so catch the wave now! Early
adoption is over…
• If you become an HR Metrics user-both you and your HR
organization will gain increased respect from CEOs,
CFOs and senior managers
• If you don’t use HR Metrics someone who isn’t HR
(Finance or IT) will use them and may even imbed them
in a BI Dashboard for the CEO or Board - “and the fault
will lie not in our stars but in ourselves” (Shakespeare)
Contact Information
Robert J. Buckley
President
RO Buckley Consulting
Phone: 908.502.5251
Mobile: 646.595.6128
Email: robert@robuckley.com

Buckley hr metrics 2011_dec_12

  • 1.
    HR Metrics: Speaking theLanguage of Your CFO HR.com Presentation December 12, 2011 Presented by: Robert J. Buckley, MBA RO Buckley Consulting
  • 2.
    Agenda  Why AreWe Here?  Characteristics of High Credibility HR Metrics  Generic Examples  Case Studies  Recruiting Metrics  Benefits Metrics  The Future of HR Metrics  Q&A Compensation Tie-In
  • 3.
    Why Are WeHere Today?  We are here to learn ways to communicate better with our CFO’s  Communication courses for HR Professionals  Finance is the language of business  HR needs to step up and be a business partner  HR Metrics: The HR “dialect” to communicate in Finance Finance HRGAAP ?
  • 4.
    Characteristics of Quality HRMetrics  Accurate  Consistently engineered  There are no GAAP or FASB Rules for HR Metrics  Fully integrated into the business  Driven by business strategy  Impact measured in $dollars (Finance)  Enabled by technology  The level of HR metric used is driven by the needs of both client and provider
  • 5.
    HR Metrics Orientation HRService Provider Corporate/ Business Manager Metrics which track transactions Time To Fill Number of Positions Filled EEOC Applicant Tracking
  • 6.
    HR Metrics Orientation HRBusiness Partner Business Leader (Major Business) Metrics which have $dollar Impact % Increases in Health Care HR Expense Ratio Turnover Costs per Employee
  • 7.
    HR Metrics Orientation HRTrusted Advisor Enterprise Leader CEO Board Metrics having $dollar impact on Income Statement Revenue & Net Income by FTE •Salaries as Percentage of Operating Expenses •Turnover Costs
  • 8.
    Generic Examples COST PER HIRE Advertising+ Agency Fee + Employee Referrals + Travel Costs (applicants & staff) + Relocation Costs +Recruiter Compensation and Benefits ÷ Number of Hires $25,000 + $50,000 + $10,000 + $5,000 + $20,000 + $150,000 = $260,000 ÷ 100 Hires = $2600 per hire HEALTHCARE COSTS PER EMPLOYEE Total Costs of Healthcare ÷ Total Number of Employees $15,000,000 ÷ 1000 employees = $!5,000 per employee
  • 9.
    Generic Examples REVENUE PER EMPLOYEE (or FTE’s) Revenue ÷ TotalNumber of Employees (or FTE’s) $120,000,000 ÷ 1000 (1037) = $120,000 TIME TO FILL Total Days Elapsed to Fill Requisition ÷ Number of Employees Hired 3347 ÷ 100 = 33.47 (Average number of days to fill a requisition)
  • 10.
    Generic Examples TRAINING INVESTMENT PER EMPLOYEE Total TrainingCosts + (Opportunity Costs) ÷ Headcount $6,000,000 + ($50,000,000/220 working days = $227,273 daily payroll costs X 5 days of training) $1,136,365 = $7,136,365 ÷ 1000 employees = $7,136 Training Investment per Employee TURNOVER RATE Number of separations during month ÷ Number of employees on payroll during the month X100 167 ÷ 1000 employees = 16.7% Turnover Rate
  • 11.
    Generic Examples TURNOVER COSTS PER EMPLOYEE Totalcost of separation + replacement costs + training costs + vacancy costs (contingency worker costs - wages and benefits not paid because of vacancy) ÷ Number of employees $8,800,000 ÷ 1000 = $88,000 Turnover costs per employee
  • 12.
  • 13.
    Company Situation  Costper Hire is too High  28% of base salary  Industry benchmark: 17% of base salary  Time to fill is too long  57 Days  Industry benchmark: 44 days  Hiring managers upset  Hiring costs are soaring  Extensive opportunity costs  Increased workload for existing staff
  • 14.
    Intervention Hiring Past Practices •65% - Agencies (retained and contingent) • 35% - Other (internet, referrals, university) New Hiring Strategy • Leverage Internet (46%) • Targeted: Specialized skills and Director + positions • General: All other positions • Company website/internet, Monster.com, HotJobs.com, etc. • Enhance Employee Referral Program (11%) • Increase bonus from $500 to $3,000 • Increase university sourcing (15%) • Agencies used only for C-level of niche positions (25%)
  • 15.
    Results  Cost perHire decreased*  16% of base salary  $7,296 less per hire  Time to Fill decreased  19 day decrease (54 to 35)  6 days less than benchmark (44 days)  Vacancy Costs decreased  Saved over $1.3M  Better able to capitalize on new business opportunities  Total savings over $2.3M per year  Includes cost of 1 additional recruiter
  • 16.
    Formulas  Cost perHire = (Advertising + Agency fees + Referral fees + Travel costs + Relocation costs + Recruiter pay/benefits, etc.) ÷ Number of Hires  Time to Fill = Total days elapsed to fill requisitions +Number Hired  Vacancy Costs = Contingency worker costs + OT for employees + Lost opportunities - Vacancy salary and benefits
  • 17.
    Financial Impact Expense Type2009 2010 HR Metric Applied 2009 2010 Hire 135 135 Cost per Hire 17,234 9,938 Agency Fees % Base Salary 28% 16% Retainer 400,000 73,000 Time to Fill 57 38 Contingent 1,350,078 496,831 Days Vacant 7,685 5,139 Vacancy/Opportunity University 128,000 162,000 Cost per Day 559 582 Internet 157,998 162,000 Vacancy/Opportunity Cost per year 4,305,143 2,984,914 Employee Referrals 3,000 45,000 Savings 1,320,229 Other (Relocation, travel, recruiter salaries, etc.) 287,514 353,280 TOTAL 2,326,590 353,280 Savings 984,935 Overall Savings 2,305,163 42%
  • 18.
    Impact on IncomeStatement Recruiting Metrics Income Statement Numbers in Thousands 12/30/2010 12/30/2009 12/30/2008 Total Revenue 52,516,000 45,188,000 32,373,000 Cost of Goods Sold 7,541,000 9,832,000 4,045,000 Gross Profit 44,875,000 35,356,000 28,328,000 Research & Development 6,783,857 6,131,000 6,830,294 Selling General & Administrative 8,993,296 9,267,136 6,301,653 Others 2,264,009 6,110,000 510,000 Total Operating Expenses 26,933,838 13,847,864 14,686,054 Interest & Tax Expense 5,386,768 2,769,573 2,937,211 Net Income 21,547,071 11,078,291 11,748,843
  • 19.
  • 20.
    Company Situation 2009 Employeebenefits skyrocketed 32% • Average US medical benefit increased 9.2% for same year* • Rising benefit costs undermine product cost competitiveness Competitive pressure from China • Competitor sells product for 75% less • Market share decreased 40% as a result *Source:www.benefitsnew.com
  • 21.
    Intervention Decrease Costs  Joina consortium to increase buying power and reduce fees  Transition from fully-insured to self-insured Redeploy Headcount  Move manufacturing team offshore to increase product cost competitiveness by lowering benefits costs Decrease Administrative Costs  Implement an employee self-service system  Decrease benefit administrator headcount
  • 22.
    Results  Decrease keybenefits costs  US: Monthly benefit cost per head  Before: $255/head; After: $214/head  Redeploy headcount  US: (decrease headcount) Benefit savings = $36M-$10M=$26M decrease  Asia: (increase headcount) benefit costs = $42M inc. $46M=$4M increase.  US benefit savings ($26M)-Asian Benefit Cost ($4M) = ($22) Total Benefit savings (increased cash in balance sheet)  Decrease administrative costs  Previous salaries 400K-New Salaries 50K = $350K savings  New self service cost 200K - Previous IT cost 52K = 148K IT cost  350K-148K = 202K Total Savings
  • 23.
    Formulas Savings Cost Increase BenefitSavings: US benefit cost per head X Benefit Savings per head = Reduced benefit cost per head Headcount Reduction: US: The average cost per head X Decrease in headcount* = Total Savings (Comp & Benefits) * Includes the 7 Ben Admin RIFs Headcount Increase: Asia: The average benefit cost per Asian local national X Increase in headcount = Benefit costs Employee Self Service: Cost of self service administrative service (IT costs)
  • 24.
    Financial Impact Before AfterBefore After Delta US Comp & Benefits 10,041 4,800 639,401,178 298,971,794 340,429,384 Asian Comp & Benefits 57,000 62,241 726,408,000 793,199,304 -66,791,304 Administrative Headcount Reduction 8 1 400,000 50,000 350,000 Employee Self Service (IT) Minimal Full Range 52,378 200,000 -147,622 Total 67,049 67,042 1,366,261,556 1,092,421,098 273,840,458 Headcount Change Total Benefit Costs
  • 25.
    Impact on IncomeStatement Benefits Metrics Income Statement Numbers in Thousands 12/31/06 12/31/05 12/31/04 Total Revenue 473,117 407,099 291,649 Cost of Goods Sold 67,937 88,577 36,441 Gross Profit 405,180 318,523 255,207 Research & Development 61,116 55,234 61,534 Selling General & Administrative 81,183 83,488 79,245 Others 20,396 55,045 4,595 Total Operating Expenses 242,485 124,756 109,833 Interest & Tax Expense 48,497 24,951 21,833 Net Income 193,988 99,804 87,867
  • 26.
    Compensation Tie-in Compensation isthe alignment mechanism that is most effective in an organization…
  • 27.
    Return on TrainingExpense TRAINING INVESTMENT PER EMPLOYEE Total Training Costs + (Opportunity Costs) ÷ Headcount $6,000,000 + ($50,000,000/220 working days = $227,273 daily payroll costs X 5 ΔΔΔdays of training) $1,136,365 = $7,136,365 ÷ 1000 employees = $7,136 Training Investment per Employee ROTE= Avg. Training Investment per EE ÷ Δ in Group Revenue (at a time interval) X Δ in Group Revenue (at a time interval) ÷ Avg Dept Wage 7136 ÷ 20,000,000 X 20,000,000 ÷ 75,000 = 9.5% ROI = 9.5% If the WACC is 7% < 9.5 Training is making the company money. Your CFO will approve this EVERY TIME.
  • 28.
    The Future ofHR Metrics Business Intelligence • PREDICTING THE PRESENT • Harrah’s Entertainment, Citibank, CVS and Dunkin’ Donuts are almost there with an approximately 6 week lag in their business intelligence systems • Real-time Opportunity reporting + real-time risk detection reporting = real-time enterprise reporting THE ABILITY TO REACT. • Business intelligence technology firms are currently embedding HR Metrics into their Business Intelligence Dashboards for CEO’s and “C” level execitives (SAP/Business Objects, IBM/Cognos, Oracle/Hyperion)
  • 29.
    The Future ofHR Metrics Business Intelligence • Do you really want to have technology and finance experts construct the metrics that HR will be judged by?- The time to become involved in HR Metrics is NOW! • Success stories for HR Metrics • William Clay Ford (Ford) includes the success rate of HR in recruiting and retaining high performing salespeople as an HR metric in his BI Dashboard • Jeff Immelt (GE) includes the ratings of the developmental experiences of his high potentials as an HR metric in his BI Dashboard
  • 30.
    One of theMost Important HR Metrics Adding Value to Your Personal Bottom Line What is the value of today’s discussion of HR Metrics for you? • Formula (Very Conservative) • Annual Compensation X Percentage Productivity Increase - ($Dollar Cost + Opportunity Costs*) = Net Value • Financial Impact Impact • $75,000 X .005 (.5%) - ($0 + $42.61*) = $332.39 Net Value to You As a Participant *opportunity cost ($75,000/220 working days/8 per day = $42.61)
  • 31.
    Summary • Some FinalThoughts • HR Metrics are formula-driven and easy to use • HR Metrics and BI are fast becoming “the way we do things around here” - so catch the wave now! Early adoption is over… • If you become an HR Metrics user-both you and your HR organization will gain increased respect from CEOs, CFOs and senior managers • If you don’t use HR Metrics someone who isn’t HR (Finance or IT) will use them and may even imbed them in a BI Dashboard for the CEO or Board - “and the fault will lie not in our stars but in ourselves” (Shakespeare)
  • 32.
    Contact Information Robert J.Buckley President RO Buckley Consulting Phone: 908.502.5251 Mobile: 646.595.6128 Email: robert@robuckley.com

Editor's Notes

  • #28 Change in Revenue/Target EE (@ 90, 180, 360 days) _________________________________________ Avg Revenue per Target EE + Training Cost per EE