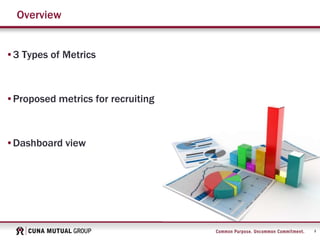
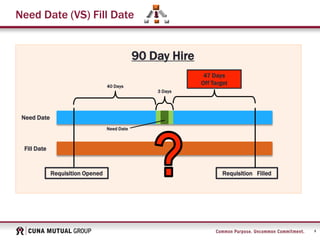
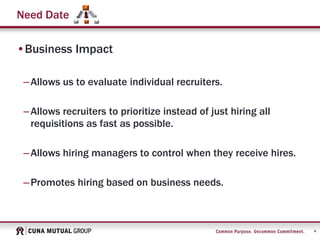
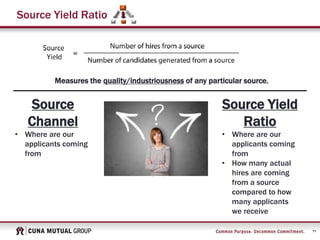
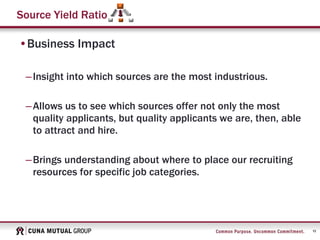
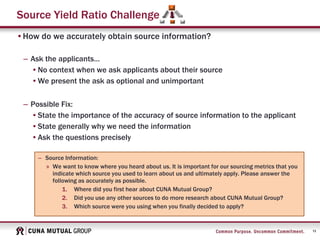
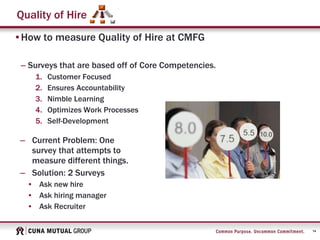
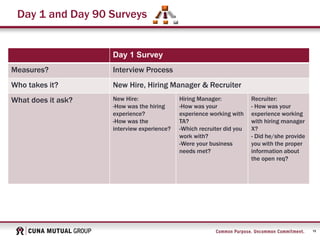
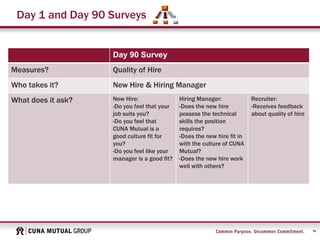
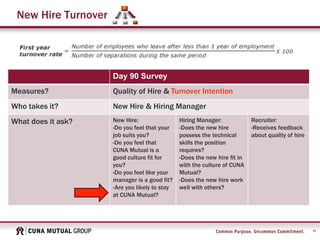
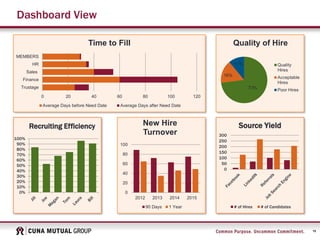
3. 3
3 Types of Metrics
Historical
(Past data; cumulative
yearly data) Real-Time
(Constantly update;
current business state )
Predictive
(Predicts future metrics;
future-focused)
Metrics
4. 4
Need Date (Real-time)
•Need Date= % of hires completed by need specified need
date (within 2 days)
Measures how often a recruiter produces a hire on time.
Need Date
• How long the
requisition was
open for
• If the position filled
on time
• If the position was
not filled on time,
how far past the
time was the hire
Fill Date
• How long the
requisition was
open for
5. 5
Need Date (VS) Fill Date
Requisition FilledRequisition Opened
40 Days
Need Date
3 Days
47 Days
Off Target
90 Day Hire
Need Date
Fill Date
6. 6
Need Date
•Business Impact
–Allows us to evaluate individual recruiters.
–Allows recruiters to prioritize instead of just hiring all
requisitions as fast as possible.
–Allows hiring managers to control when they receive hires.
–Promotes hiring based on business needs.
7. 7
Need Date Challenge
•Hiring Managers will…
– Need to be proactive in planning...
•Know when they will need new hires
•Know When they will be ready for new hires
–Have to be reasonable for need dates
•Encouraging Reasonable Need dates
– Percentage or max. of short time frame hires
– Limit early need dates to hiring managers in high priority business areas
8. 8
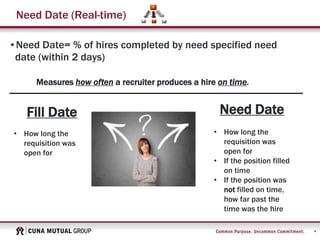
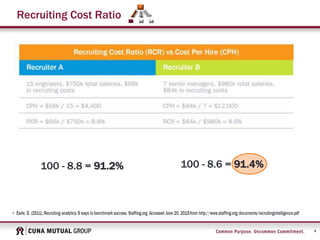
Recruiting Cost Ratio (Historical)
Measures hiring efficiency.
Cost per
Hire (CPH)
• How much did the
hire cost
• Hiring
performance
based on ease of
hire
Recruiting
Cost Ratio
• How much did the
hire cost relative to
the position level
• Hiring
performance
based on a fair
scale
RCR= 100 - [ ]
10. 10
Recruiting Cost Ratio
•Business Impact
–Allows Talent Acquisition a clearer view into recruiter
performance.
–Allows recruiters to take on challenging hires and still
show improvement.
–Allows the company to compare total cost of hire against
how many high-level requisitions were filled in the past
year.
11. 11
Source Yield Ratio
Measures the quality/industriousness of any particular source.
Source
Channel
• Where are our
applicants coming
from
Source Yield
Ratio
• Where are our
applicants coming
from
• How many actual
hires are coming
from a source
compared to how
many applicants
we receive
12. 12
Source Yield Ratio
•Business Impact
–Insight into which sources are the most industrious.
–Allows us to see which sources offer not only the most
quality applicants, but quality applicants we are, then, able
to attract and hire.
–Brings understanding about where to place our recruiting
resources for specific job categories.
13. 13
Source Yield Ratio Challenge
•How do we accurately obtain source information?
– Ask the applicants…
•No context when we ask applicants about their source
•We present the ask as optional and unimportant
– Possible Fix:
•State the importance of the accuracy of source information to the applicant
•State generally why we need the information
•Ask the questions precisely
– Source Information:
» We want to know where you heard about us. It is important for our sourcing metrics that you
indicate which source you used to learn about us and ultimately apply. Please answer the
following as accurately as possible.
1. Where did you first hear about CUNA Mutual Group?
2. Did you use any other sources to do more research about CUNA Mutual Group?
3. Which source were you using when you finally decided to apply?
14. 14
Quality of Hire
•How to measure Quality of Hire at CMFG
– Surveys that are based off of Core Competencies.
1. Customer Focused
2. Ensures Accountability
3. Nimble Learning
4. Optimizes Work Processes
5. Self-Development
– Current Problem: One
survey that attempts to
measure different things.
– Solution: 2 Surveys
• Ask new hire
• Ask hiring manager
• Ask Recruiter
15. 15
Day 1 and Day 90 Surveys
Day 1 Survey
Measures? Interview Process
Who takes it? New Hire, Hiring Manager & Recruiter
What does it ask? New Hire:
-How was the hiring
experience?
-How was the
interview experience?
Hiring Manager:
-How was your
experience working with
TA?
-Which recruiter did you
work with?
-Were your business
needs met?
Recruiter:
- How was your
experience working
with hiring manager
X?
- Did he/she provide
you with the proper
information about
the open req?
16. 16
Day 1 and Day 90 Surveys
Day 90 Survey
Measures? Quality of Hire
Who takes it? New Hire & Hiring Manager
What does it ask? New Hire:
-Do you feel that your
job suits you?
-Do you feel that
CUNA Mutual is a
good culture fit for
you?
-Do you feel like your
manager is a good fit?
Hiring Manager:
-Does the new hire
possess the technical
skills the position
requires?
-Does the new hire fit in
with the culture of CUNA
Mutual?
-Does the new hire work
well with others?
Recruiter:
-Receives feedback
about quality of hire
17. 17
New Hire Turnover
Day 90 Survey
Measures? Quality of Hire & Turnover Intention
Who takes it? New Hire & Hiring Manager
What does it ask? New Hire:
-Do you feel that your
job suits you?
-Do you feel that
CUNA Mutual is a
good culture fit for
you?
-Do you feel like your
manager is a good fit?
-Are you likely to stay
at CUNA Mutual?
Hiring Manager:
-Does the new hire
possess the technical
skills the position
requires?
-Does the new hire fit in
with the culture of CUNA
Mutual?
-Does the new hire work
well with others?
Recruiter:
-Receives feedback
about quality of hire
18. 18
Dashboard View
73%
16%
11%
Quality of Hire
Quality
Hires
Acceptable
Hires
Poor Hires
0%
10%
20%
30%
40%
50%
60%
70%
80%
90%
100%
Recruiting Efficiency
0 20 40 60 80 100 120
Trustage
Finance
Sales
HR
MEMBERS
Time to Fill
Average Days before Need Date Average Days after Need Date
0
50
100
150
200
250
300
Source Yield
# of Hires # of Candidates
0
20
40
60
80
100
2012 2013 2014 2015
New Hire
Turnover
90 Days 1 Year
19. 19
Appendix
•Gain further insight into Talent Acquisition through combining metrics.
• Quality of Hire & Source Yield
– Predict where quality hires are coming from.
•Quality of Hire & New Hire Turnover
– Predict if CUNA Mutual is retaining top talent.
•Need Date & Source Yield
– Which sources do ‘on time’ recruiters recruit from? Is there a trend here?
21. 21
Sources
• Earle, D. (2011). Recruiting analytics: 5 ways to benchmark success. Staffing.org. Accessed June 20, 2015 from
http://www.staffing.org/documents/recruitingintelligence.pdf
• Sullivan, J. (2003). Change your recruiting metric from time to fill to need date. ERE Media. Accessed June 24, 2015
from http://www.eremedia.com/ere/change-your-recruiting-metric-from-time-to-fill-to-need-date/
• Corporate Leadership Council and CLC Solutions. (2005). Strategic turnover tracking and analysis. Catalog No:
CLC12O4FDY. Accessed July 1, 2015 from
file:///C:/Users/rwr2682/Documents/Strategic%20Turnover%20Tracking%20&%20Analysis.pdf
• Martin, J. (2014). Top 10 talent trends that HR pros really need to know. ERE Media. Accessed June 24, 2015 from
http://www.eremedia.com/tlnt/top-10-talent-trends-that-hr-pros-really-need-to-know/
• Sullivan, J. (2013). High-impact strategic recruiting metrics for WOWing executives. ERE Media. Accessed July 15, 2015
from http://www.eremedia.com/ere/high-impact-strategic-recruiting-metrics-for-wowing-executives/
• Jacobson, D. (2013). 16 HR metrics smart HR departments track. GloboforceBlog. Accessed May 15, 2015 from
http://www.globoforce.com/gfblog/2013/16-hr-metrics-to-track/
• Lowisz, S. (2010). Quality of hire: The top recruiting metric. ERE Media. Accessed May 15, 2015 from
http://www.ere.net/2010/06/30/quality-of-hire-the-top-recruiting-metric/
Editor's Notes
-5 New or Improved Metrics for Recruiting
Need Date
Recruiting Cost Ratio (RCR)
Sourcing Yield Ratio
Quality of Hire
-Methods on how to acquire each metric—How do we measure these metrics
-Business Impact—what does recruiting stand to gain by using these metrics? Translate what these metrics help us accomplish through a talent perspective.
-Dashboard view—what a metric like this would look like
Historical—Typically overused, cannot be used for day-to-day decisions
Real-Time– Can be used for the day-to-day decisions, can see a weakening metric immediately, Enables action
Predictive—Rarely used, high-impact, requires robust predictive framework to show return: requires a lot of data input
Best to have a mix of ALL 3!!
Can infer a lot from fill date, but it’s a guessing game.
IE: The hire took a long time—so it must’ve been a difficult hire because it’s (high level position, no talent, etc.)
If cost per hire was greater this past year—RCR allows us to dive into that number and see if where the inefficiency is coming from, or if there was any inefficiency at all. It could be the case that one year was simply higher in open executive or high-level positions, than in the past.
NOTE: Quality of source should already be in place