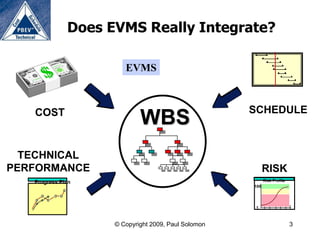
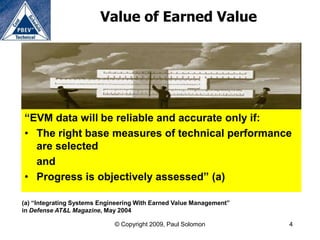
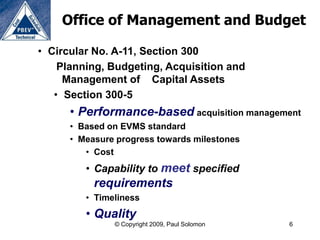
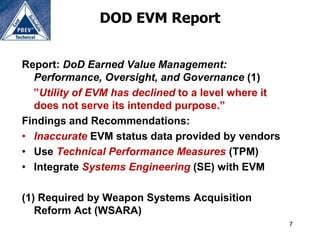
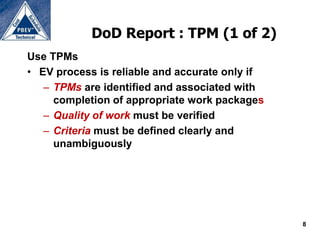
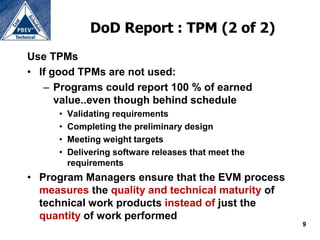
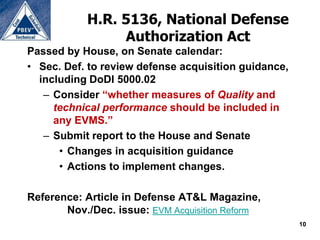
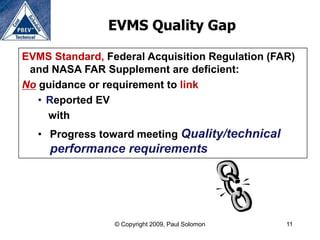
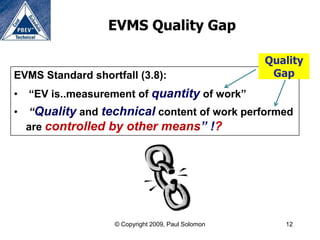
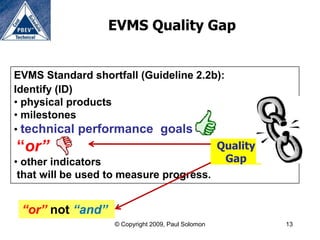
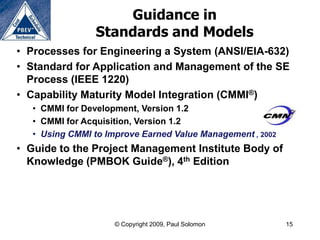
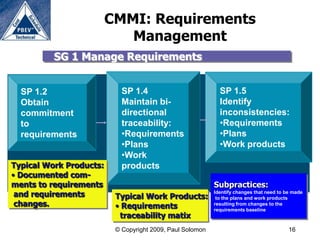
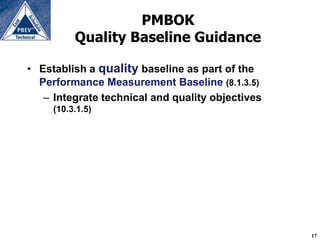
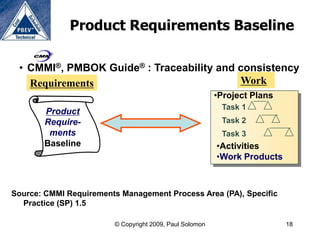
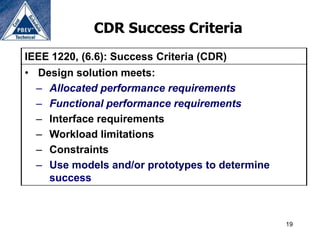
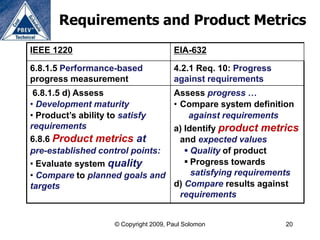
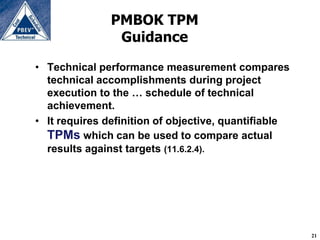
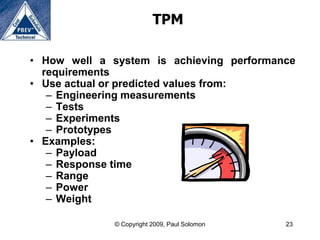
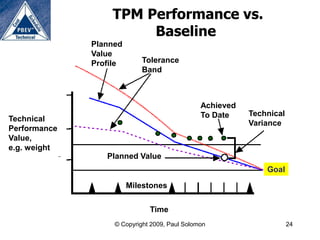
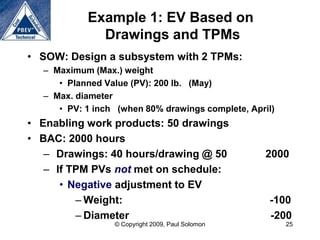
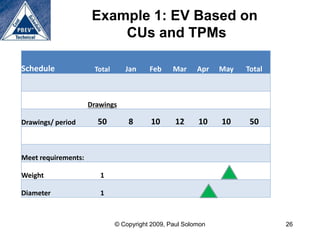
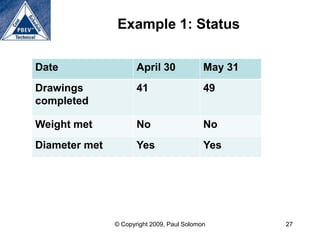
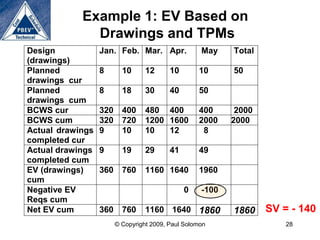
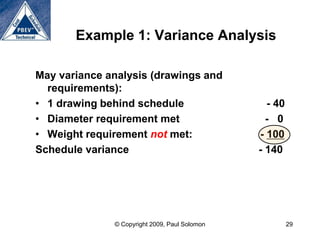
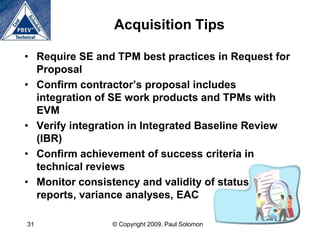
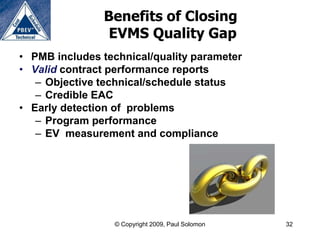
Integrating
                 Technical Performance
                          with
               Earned Value Management
                               Paul Solomon, PMP
                        Performance-Based Earned Value®
                                  www.PB-EV.com
                               paul.solomon@pb-ev.com


                          NASA PM Challenge 2011
                  Long Beach                                    Feb. 9, 2011
                               © Copyright 2010, Paul Solomon                  1
Used with permission
Agenda
•   Link EV to Technical Performance/Quality
•   Government Needs and Acquisition Reform
•   Guidance in Standards and Models
•   Practical Application
•   EVM Acquisition Reform


                 © Copyright 2010, Paul Solomon   2
Does EVMS Really Integrate?

                       EVMS


   COST                                              SCHEDULE
                            WBS
  TECHNICAL
PERFORMANCE                                                RISK
   Progress Plan                                           Risk Profile
                                                     100


                                                     1


                    © Copyright 2009, Paul Solomon                        3
Value of Earned Value


“EVM data will be reliable and accurate only if:
• The right base measures of technical performance
  are selected
  and
• Progress is objectively assessed” (a)

(a) “Integrating Systems Engineering With Earned Value Management”
in Defense AT&L Magazine, May 2004

                             © Copyright 2009, Paul Solomon          4
Government Needs
       and
Acquisition Reform


   © Copyright 2009, Paul Solomon   5
Office of Management and Budget

• Circular No. A-11, Section 300
    Planning, Budgeting, Acquisition and
     Management of Capital Assets
   • Section 300-5
      • Performance-based acquisition management
      • Based on EVMS standard
      • Measure progress towards milestones
         • Cost
         • Capability to meet specified
           requirements
         • Timeliness
         • Quality
               © Copyright 2009, Paul Solomon   6
DOD EVM Report


Report: DoD Earned Value Management:
  Performance, Oversight, and Governance (1)
  ”Utility of EVM has declined to a level where it
  does not serve its intended purpose.”
Findings and Recommendations:
• Inaccurate EVM status data provided by vendors
• Use Technical Performance Measures (TPM)
• Integrate Systems Engineering (SE) with EVM

(1) Required by Weapon Systems Acquisition
   Reform Act (WSARA)
                                                     7
DoD Report : TPM (1 of 2)
Use TPMs
• EV process is reliable and accurate only if
   – TPMs are identified and associated with
     completion of appropriate work packages
   – Quality of work must be verified
   – Criteria must be defined clearly and
     unambiguously


                                                8
DoD Report : TPM (2 of 2)
Use TPMs
• If good TPMs are not used:
   – Programs could report 100 % of earned
      value..even though behind schedule
     •   Validating requirements
     •   Completing the preliminary design
     •   Meeting weight targets
     •   Delivering software releases that meet the
         requirements
• Program Managers ensure that the EVM process
  measures the quality and technical maturity of
  technical work products instead of just the
  quantity of work performed
                                                      9
H.R. 5136, National Defense
                Authorization Act
Passed by House, on Senate calendar:
• Sec. Def. to review defense acquisition guidance,
  including DoDI 5000.02
   – Consider “whether measures of Quality and
     technical performance should be included in
     any EVMS.”
   – Submit report to the House and Senate
      • Changes in acquisition guidance
      • Actions to implement changes.

Reference: Article in Defense AT&L Magazine,
       Nov./Dec. issue: EVM Acquisition Reform
                                                      10
EVMS Quality Gap

EVMS Standard, Federal Acquisition Regulation (FAR)
 and NASA FAR Supplement are deficient:
No guidance or requirement to link
   • Reported EV
     with
  • Progress toward meeting Quality/technical
     performance requirements


                 © Copyright 2009, Paul Solomon   11
EVMS Quality Gap

                                                    Quality
EVMS Standard shortfall (3.8):                       Gap
•   “EV is..measurement of quantity of work”
•   “Quality and technical content of work performed
    are controlled by other means” !?


                   © Copyright 2009, Paul Solomon      12
EVMS Quality Gap


EVMS Standard shortfall (Guideline 2.2b):
Identify (ID)
• physical products
• milestones
• technical performance goals
“or”                                                Quality
• other indicators                                   Gap
 that will be used to measure progress.


 “or” not “and”
                   © Copyright 2009, Paul Solomon             13
Guidance in
Standards and Models


    © Copyright 2009, Paul Solomon   14
Guidance in
                 Standards and Models
• Processes for Engineering a System (ANSI/EIA-632)
• Standard for Application and Management of the SE
  Process (IEEE 1220)
• Capability Maturity Model Integration (CMMI®)
   • CMMI for Development, Version 1.2
   • CMMI for Acquisition, Version 1.2
   • Using CMMI to Improve Earned Value Management , 2002
• Guide to the Project Management Institute Body of
  Knowledge (PMBOK Guide®), 4th Edition


                     © Copyright 2009, Paul Solomon         15
CMMI: Requirements
                            Management
          SG 1 Manage Requirements


  SP 1.2                    SP 1.4                           SP 1.5
  Obtain                    Maintain bi-                     Identify
  commitment                directional                      inconsistencies:
  to                        traceability:                    •Requirements
  requirements              •Requirements                    •Plans
                            •Plans                           •Work products
                            •Work
Typical Work Products:      products
• Documented com-
ments to requirements                                      Subpractices:
 and requirements         Typical Work Products:
                                                           Identify changes that need to be made
                                                            to the plans and work products
 changes.                 • Requirements                   resulting from changes to the
                                                           requirements baseline
                           traceability matix
                          © Copyright 2009, Paul Solomon                                  16
PMBOK
          Quality Baseline Guidance

• Establish a quality baseline as part of the
  Performance Measurement Baseline (8.1.3.5)
   – Integrate technical and quality objectives
     (10.3.1.5)


                                                  17
Product Requirements Baseline

 • CMMI®, PMBOK Guide® : Traceability and consistency
   Requirements                           Work
                                                         •Project Plans
                                                          Task 1
       Product
       Require-                                           Task 2
        ments                                             Task 3
       Baseline                                          •Activities
                                                         •Work Products


Source: CMMI Requirements Management Process Area (PA), Specific
  Practice (SP) 1.5

                        © Copyright 2009, Paul Solomon                    18
CDR Success Criteria
IEEE 1220, (6.6): Success Criteria (CDR)
• Design solution meets:
  – Allocated performance requirements
  – Functional performance requirements
  – Interface requirements
  – Workload limitations
  – Constraints
  – Use models and/or prototypes to determine
    success


                                                19
Requirements and Product Metrics
IEEE 1220                             EIA-632

6.8.1.5 Performance-based             4.2.1 Req. 10: Progress
progress measurement                  against requirements
 6.8.1.5 d) Assess                    Assess progress …
• Development maturity                • Compare system definition
• Product’s ability to satisfy            against requirements
requirements                          a) Identify product metrics
6.8.6 Product metrics at                and expected values
pre-established control points:           Quality of product
• Evaluate system quality                 Progress towards
• Compare to planned goals and             satisfying requirements
targets                               d) Compare results against
                                        requirements


                   © Copyright 2009, Paul Solomon               20
PMBOK TPM
                Guidance

• Technical performance measurement compares
  technical accomplishments during project
  execution to the … schedule of technical
  achievement.
• It requires definition of objective, quantifiable
  TPMs which can be used to compare actual
  results against targets (11.6.2.4).


                                                      21
Practical Application


     © Copyright 2009, Paul Solomon   22
TPM

• How well a system is achieving performance
  requirements
• Use actual or predicted values from:
   – Engineering measurements
   – Tests
   – Experiments
   – Prototypes
• Examples:
   – Payload
   – Response time
   – Range
   – Power
   – Weight

              © Copyright 2009, Paul Solomon   23
TPM Performance vs.
                       Baseline
              Planned
              Value
              Profile       Tolerance
                            Band


                                               Achieved
                                               To Date    Technical
Technical
                                                          Variance
Performance
Value,
e.g. weight
                 Planned Value
                                                              Goal

                        Milestones


                              Time
                   © Copyright 2009, Paul Solomon                     24
Example 1: EV Based on
             Drawings and TPMs
• SOW: Design a subsystem with 2 TPMs:
  – Maximum (Max.) weight
     • Planned Value (PV): 200 lb. (May)
  – Max. diameter
     • PV: 1 inch (when 80% drawings complete, April)
• Enabling work products: 50 drawings
• BAC: 2000 hours
   – Drawings: 40 hours/drawing @ 50               2000
   – If TPM PVs not met on schedule:
      • Negative adjustment to EV
         – Weight:                                 -100
         – Diameter                                -200
                 © Copyright 2009, Paul Solomon         25
Example 1: EV Based on
                          CUs and TPMs

Schedule              Total      Jan     Feb     Mar     Apr   May   Total


                     Drawings

Drawings/ period       50         8       10      12     10    10     50


Meet requirements:

Weight                  1

Diameter                1


                              © Copyright 2009, Paul Solomon                 26
Example 1: Status

Date                  April 30              May 31
Drawings              41                    49
completed

Weight met            No                    No
Diameter met          Yes                   Yes


               © Copyright 2009, Paul Solomon        27
Example 1: EV Based on
              Drawings and TPMs
Design            Jan. Feb. Mar. Apr.               May    Total
(drawings)
Planned           8       10      12      10       10      50
drawings cur
Planned           8       18      30      40       50
drawings cum
BCWS cur          320     400     480 400          400      2000
BCWS cum          320     720     1200 1600        2000    2000
Actual drawings   9       10      10   12           8
completed cur
Actual drawings   9       19      29      41       49
completed cum
EV (drawings)     360     760     1160 1640        1960
cum
Negative EV                                    0    -100
Reqs cum
Net EV cum        360     760     1160 1640 1860           1860    SV = - 140
                        © Copyright 2009, Paul Solomon                 28
Example 1: Variance Analysis

May variance analysis (drawings and
  requirements):
• 1 drawing behind schedule                      - 40
• Diameter requirement met                       - 0
• Weight requirement not met:                  - 100
Schedule variance                              - 140


              © Copyright 2009, Paul Solomon            29
EVM Acquisition Reform


          30
Acquisition Tips

• Require SE and TPM best practices in Request for
  Proposal
• Confirm contractor’s proposal includes
  integration of SE work products and TPMs with
  EVM
• Verify integration in Integrated Baseline Review
  (IBR)
• Confirm achievement of success criteria in
  technical reviews
• Monitor consistency and validity of status
  reports, variance analyses, EAC

31              © Copyright 2009, Paul Solomon
Benefits of Closing
                EVMS Quality Gap
• PMB includes technical/quality parameter
• Valid contract performance reports
   – Objective technical/schedule status
   – Credible EAC
• Early detection of problems
   – Program performance
   – EV measurement and compliance


                  © Copyright 2009, Paul Solomon   32
Resources Online


      DOD                   SEI                 NAVAIR     DOD


               PMI College of
               Performance Mgt.,
ICFAI U.       “Measurable News”
Press, India
                          © Copyright 2009, Paul Solomon     33
Questions?
Comments?
 © Copyright 2009, Paul Solomon   34
References
® CMMI Is Registered by Carnegie Mellon University in the U.S. Patent and
   Trademark Office.
® Performance-Based Earned Value is registered by Paul Solomon in the U.S. Patent
   and Trademark Office. PBEV is a service mark of Paul Solomon.
® PMBOK is registered by the Project Management Institute in the U.S. Patent and
   Trademark Office
• American National Standards Institute (ANSI)/Electronics Industries Alliance (EIA).
   ANSI/EIA 632, Processes for Engineering a System, EIA, Arlington, VA, 1998.
• CMMI®, Capability Maturity Model Integration for Development, Version 1.2, 2006.
• CMMI, CMMI for Acquisition, Version 1.2, 2007.
• CMMI, Using CMMI to Improve Earned Value Management, 2002
• Institute of Electrical and Electronics Engineers (IEEE). IEEE Std 1220TM-2005,
   IEEE Standard for Application and Management of the Systems Engineering
   Process. New York, 2005.


                            © Copyright 2009, Paul Solomon                     35

Solomon.paul

  • 1.
    Integrating Technical Performance with Earned Value Management Paul Solomon, PMP Performance-Based Earned Value® www.PB-EV.com paul.solomon@pb-ev.com NASA PM Challenge 2011 Long Beach Feb. 9, 2011 © Copyright 2010, Paul Solomon 1 Used with permission
  • 2.
    Agenda • Link EV to Technical Performance/Quality • Government Needs and Acquisition Reform • Guidance in Standards and Models • Practical Application • EVM Acquisition Reform © Copyright 2010, Paul Solomon 2
  • 3.
    Does EVMS ReallyIntegrate? EVMS COST SCHEDULE WBS TECHNICAL PERFORMANCE RISK Progress Plan Risk Profile 100 1 © Copyright 2009, Paul Solomon 3
  • 4.
    Value of EarnedValue “EVM data will be reliable and accurate only if: • The right base measures of technical performance are selected and • Progress is objectively assessed” (a) (a) “Integrating Systems Engineering With Earned Value Management” in Defense AT&L Magazine, May 2004 © Copyright 2009, Paul Solomon 4
  • 5.
    Government Needs and Acquisition Reform © Copyright 2009, Paul Solomon 5
  • 6.
    Office of Managementand Budget • Circular No. A-11, Section 300 Planning, Budgeting, Acquisition and Management of Capital Assets • Section 300-5 • Performance-based acquisition management • Based on EVMS standard • Measure progress towards milestones • Cost • Capability to meet specified requirements • Timeliness • Quality © Copyright 2009, Paul Solomon 6
  • 7.
    DOD EVM Report Report:DoD Earned Value Management: Performance, Oversight, and Governance (1) ”Utility of EVM has declined to a level where it does not serve its intended purpose.” Findings and Recommendations: • Inaccurate EVM status data provided by vendors • Use Technical Performance Measures (TPM) • Integrate Systems Engineering (SE) with EVM (1) Required by Weapon Systems Acquisition Reform Act (WSARA) 7
  • 8.
    DoD Report :TPM (1 of 2) Use TPMs • EV process is reliable and accurate only if – TPMs are identified and associated with completion of appropriate work packages – Quality of work must be verified – Criteria must be defined clearly and unambiguously 8
  • 9.
    DoD Report :TPM (2 of 2) Use TPMs • If good TPMs are not used: – Programs could report 100 % of earned value..even though behind schedule • Validating requirements • Completing the preliminary design • Meeting weight targets • Delivering software releases that meet the requirements • Program Managers ensure that the EVM process measures the quality and technical maturity of technical work products instead of just the quantity of work performed 9
  • 10.
    H.R. 5136, NationalDefense Authorization Act Passed by House, on Senate calendar: • Sec. Def. to review defense acquisition guidance, including DoDI 5000.02 – Consider “whether measures of Quality and technical performance should be included in any EVMS.” – Submit report to the House and Senate • Changes in acquisition guidance • Actions to implement changes. Reference: Article in Defense AT&L Magazine, Nov./Dec. issue: EVM Acquisition Reform 10
  • 11.
    EVMS Quality Gap EVMSStandard, Federal Acquisition Regulation (FAR) and NASA FAR Supplement are deficient: No guidance or requirement to link • Reported EV with • Progress toward meeting Quality/technical performance requirements © Copyright 2009, Paul Solomon 11
  • 12.
    EVMS Quality Gap Quality EVMS Standard shortfall (3.8): Gap • “EV is..measurement of quantity of work” • “Quality and technical content of work performed are controlled by other means” !? © Copyright 2009, Paul Solomon 12
  • 13.
    EVMS Quality Gap EVMSStandard shortfall (Guideline 2.2b): Identify (ID) • physical products • milestones • technical performance goals “or” Quality • other indicators Gap that will be used to measure progress. “or” not “and” © Copyright 2009, Paul Solomon 13
  • 14.
    Guidance in Standards andModels © Copyright 2009, Paul Solomon 14
  • 15.
    Guidance in Standards and Models • Processes for Engineering a System (ANSI/EIA-632) • Standard for Application and Management of the SE Process (IEEE 1220) • Capability Maturity Model Integration (CMMI®) • CMMI for Development, Version 1.2 • CMMI for Acquisition, Version 1.2 • Using CMMI to Improve Earned Value Management , 2002 • Guide to the Project Management Institute Body of Knowledge (PMBOK Guide®), 4th Edition © Copyright 2009, Paul Solomon 15
  • 16.
    CMMI: Requirements Management SG 1 Manage Requirements SP 1.2 SP 1.4 SP 1.5 Obtain Maintain bi- Identify commitment directional inconsistencies: to traceability: •Requirements requirements •Requirements •Plans •Plans •Work products •Work Typical Work Products: products • Documented com- ments to requirements Subpractices: and requirements Typical Work Products: Identify changes that need to be made to the plans and work products changes. • Requirements resulting from changes to the requirements baseline traceability matix © Copyright 2009, Paul Solomon 16
  • 17.
    PMBOK Quality Baseline Guidance • Establish a quality baseline as part of the Performance Measurement Baseline (8.1.3.5) – Integrate technical and quality objectives (10.3.1.5) 17
  • 18.
    Product Requirements Baseline • CMMI®, PMBOK Guide® : Traceability and consistency Requirements Work •Project Plans Task 1 Product Require- Task 2 ments Task 3 Baseline •Activities •Work Products Source: CMMI Requirements Management Process Area (PA), Specific Practice (SP) 1.5 © Copyright 2009, Paul Solomon 18
  • 19.
    CDR Success Criteria IEEE1220, (6.6): Success Criteria (CDR) • Design solution meets: – Allocated performance requirements – Functional performance requirements – Interface requirements – Workload limitations – Constraints – Use models and/or prototypes to determine success 19
  • 20.
    Requirements and ProductMetrics IEEE 1220 EIA-632 6.8.1.5 Performance-based 4.2.1 Req. 10: Progress progress measurement against requirements 6.8.1.5 d) Assess Assess progress … • Development maturity • Compare system definition • Product’s ability to satisfy against requirements requirements a) Identify product metrics 6.8.6 Product metrics at and expected values pre-established control points:  Quality of product • Evaluate system quality  Progress towards • Compare to planned goals and satisfying requirements targets d) Compare results against requirements © Copyright 2009, Paul Solomon 20
  • 21.
    PMBOK TPM Guidance • Technical performance measurement compares technical accomplishments during project execution to the … schedule of technical achievement. • It requires definition of objective, quantifiable TPMs which can be used to compare actual results against targets (11.6.2.4). 21
  • 22.
    Practical Application © Copyright 2009, Paul Solomon 22
  • 23.
    TPM • How wella system is achieving performance requirements • Use actual or predicted values from: – Engineering measurements – Tests – Experiments – Prototypes • Examples: – Payload – Response time – Range – Power – Weight © Copyright 2009, Paul Solomon 23
  • 24.
    TPM Performance vs. Baseline Planned Value Profile Tolerance Band Achieved To Date Technical Technical Variance Performance Value, e.g. weight Planned Value Goal Milestones Time © Copyright 2009, Paul Solomon 24
  • 25.
    Example 1: EVBased on Drawings and TPMs • SOW: Design a subsystem with 2 TPMs: – Maximum (Max.) weight • Planned Value (PV): 200 lb. (May) – Max. diameter • PV: 1 inch (when 80% drawings complete, April) • Enabling work products: 50 drawings • BAC: 2000 hours – Drawings: 40 hours/drawing @ 50 2000 – If TPM PVs not met on schedule: • Negative adjustment to EV – Weight: -100 – Diameter -200 © Copyright 2009, Paul Solomon 25
  • 26.
    Example 1: EVBased on CUs and TPMs Schedule Total Jan Feb Mar Apr May Total Drawings Drawings/ period 50 8 10 12 10 10 50 Meet requirements: Weight 1 Diameter 1 © Copyright 2009, Paul Solomon 26
  • 27.
    Example 1: Status Date April 30 May 31 Drawings 41 49 completed Weight met No No Diameter met Yes Yes © Copyright 2009, Paul Solomon 27
  • 28.
    Example 1: EVBased on Drawings and TPMs Design Jan. Feb. Mar. Apr. May Total (drawings) Planned 8 10 12 10 10 50 drawings cur Planned 8 18 30 40 50 drawings cum BCWS cur 320 400 480 400 400 2000 BCWS cum 320 720 1200 1600 2000 2000 Actual drawings 9 10 10 12 8 completed cur Actual drawings 9 19 29 41 49 completed cum EV (drawings) 360 760 1160 1640 1960 cum Negative EV 0 -100 Reqs cum Net EV cum 360 760 1160 1640 1860 1860 SV = - 140 © Copyright 2009, Paul Solomon 28
  • 29.
    Example 1: VarianceAnalysis May variance analysis (drawings and requirements): • 1 drawing behind schedule - 40 • Diameter requirement met - 0 • Weight requirement not met: - 100 Schedule variance - 140 © Copyright 2009, Paul Solomon 29
  • 30.
  • 31.
    Acquisition Tips • RequireSE and TPM best practices in Request for Proposal • Confirm contractor’s proposal includes integration of SE work products and TPMs with EVM • Verify integration in Integrated Baseline Review (IBR) • Confirm achievement of success criteria in technical reviews • Monitor consistency and validity of status reports, variance analyses, EAC 31 © Copyright 2009, Paul Solomon
  • 32.
    Benefits of Closing EVMS Quality Gap • PMB includes technical/quality parameter • Valid contract performance reports – Objective technical/schedule status – Credible EAC • Early detection of problems – Program performance – EV measurement and compliance © Copyright 2009, Paul Solomon 32
  • 33.
    Resources Online DOD SEI NAVAIR DOD PMI College of Performance Mgt., ICFAI U. “Measurable News” Press, India © Copyright 2009, Paul Solomon 33
  • 34.
    Questions? Comments? © Copyright2009, Paul Solomon 34
  • 35.
    References ® CMMI IsRegistered by Carnegie Mellon University in the U.S. Patent and Trademark Office. ® Performance-Based Earned Value is registered by Paul Solomon in the U.S. Patent and Trademark Office. PBEV is a service mark of Paul Solomon. ® PMBOK is registered by the Project Management Institute in the U.S. Patent and Trademark Office • American National Standards Institute (ANSI)/Electronics Industries Alliance (EIA). ANSI/EIA 632, Processes for Engineering a System, EIA, Arlington, VA, 1998. • CMMI®, Capability Maturity Model Integration for Development, Version 1.2, 2006. • CMMI, CMMI for Acquisition, Version 1.2, 2007. • CMMI, Using CMMI to Improve Earned Value Management, 2002 • Institute of Electrical and Electronics Engineers (IEEE). IEEE Std 1220TM-2005, IEEE Standard for Application and Management of the Systems Engineering Process. New York, 2005. © Copyright 2009, Paul Solomon 35