Downloaded 110 times


![Data Analysis Expressions (DAX)
Calculated Columns
• Concatenate values
• Create new values
• Perform lookups
• Examples
• Month =CONCATENATE(FORMAT(MONTH([Datekey]),"00 "),LEFT([CalendarMonthLabel],3))
• Profit =[SalesAmount]-[TotalCost]-[ReturnAmount]
• ProductCategory =RELATED(DimProductCategory[ProductCategoryName])
• LifetimeSales =SUMX(RELATEDTABLE(FactSales), FactSales[SalesAmount])](https://image.slidesharecdn.com/scsmsmnbi20110322leveragingpowerpivot-1300844495916-phpapp01/85/Leveraging-PowerPivot-14-320.jpg)
![Data Analysis Expressions (DAX)
Measures
SalesAmount =
SUM('FactSales'[SalesAmount])
YTDSales =
TOTALYTD(SUM(FactSales[SalesAmount]),DimDate[Datekey])
PY YTD Sales =
TOTALYTD(SUM(FactSales[SalesAmount]), DATEADD(DimDate[Datekey],-12,MONTH))
CumulativeSales =
CALCULATE(SUM(FactSales[SalesAmount]),
DATESBETWEEN(DimDate[Datekey],
FIRSTDATE(ALL(DimDate[Datekey])),
LASTDATE(DimDate[Datekey])))
http://denglishbi.wordpress.com/2011/01/24/calculating-cumulative-values-in-microsoft-bi-tools/
Profit % = Sum([Profit])/Sum([SalesAmount])](https://image.slidesharecdn.com/scsmsmnbi20110322leveragingpowerpivot-1300844495916-phpapp01/85/Leveraging-PowerPivot-15-320.jpg)
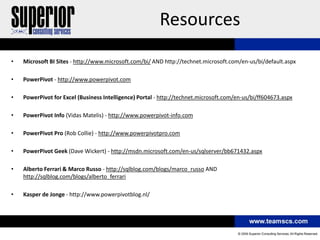
![Data Analysis Expressions (DAX)
Retail 454 Calendar Calculation
PY_SalesAmount =
IF(COUNTROWS(VALUES(DimRetailDate[Reporting_Year])) = 1,
CALCULATE([Sum of SalesAmount], DATESBETWEEN(DimRetailDate[PK_Date],
IF(COUNTROWS(VALUES(DimRetailDate[Reporting_Quarter_Of_Year])) = 1,
IF(COUNTROWS(VALUES(DimRetailDate[Reporting_Month_Of_Year])) = 1,
IF(COUNTROWS(VALUES(DimRetailDate[Reporting_Week_Of_Year]))=1,
IF(COUNTROWS(VALUES(DimRetailDate[Reporting_Day_Of_Year]))=1,
FIRSTDATE(DimRetailDate[PY_Date]),
FIRSTDATE(DimRetailDate[PY_Reporting_Week_Start_Date])),
FIRSTDATE(DimRetailDate[PY_Reporting_Month_Start_Date])),
FIRSTDATE(DimRetailDate[PY_Reporting_Quarter_Start_Date])),
FIRSTDATE(DimRetailDate[PY_Reporting_Year_Start_Date])),
IF(COUNTROWS(VALUES(DimRetailDate[Reporting_Quarter_Of_Year])) = 1,
IF(COUNTROWS(VALUES(DimRetailDate[Reporting_Month_Of_Year])) = 1,
IF(COUNTROWS(VALUES(DimRetailDate[Reporting_Week_Of_Year]))=1,
IF(COUNTROWS(VALUES(DimRetailDate[Reporting_Day_Of_Year]))=1,
FIRSTDATE(DimRetailDate[PY_Date]),
FIRSTDATE(DimRetailDate[PY_Reporting_Week_End_Date])),
FIRSTDATE(DimRetailDate[PY_Reporting_Month_End_Date])),
FIRSTDATE(DimRetailDate[PY_Reporting_Quarter_End_Date])),
FIRSTDATE(DimRetailDate[PY_Reporting_Year_End_Date]))))
,BLANK())
http://denglishbi.wordpress.com/2010/10/09/round-2-calculating-previous-year-marketing-calendar-values-with-dax/](https://image.slidesharecdn.com/scsmsmnbi20110322leveragingpowerpivot-1300844495916-phpapp01/85/Leveraging-PowerPivot-16-320.jpg)


This document provides an overview and summary of a presentation on leveraging PowerPivot. It begins with background on the speaker and their company Superior Consulting Services. It then outlines the session which will cover Microsoft Business Intelligence, what PowerPivot is, a comparison of SSAS and PowerPivot, a demonstration of DAX functions, and what future developments are planned. Audience polling questions are also included to gauge experience levels.


![Microsoft Power Stack 2019 [Power BI, Excel, Azure & Friends]](https://cdn.slidesharecdn.com/ss_thumbnails/cl5khvpdqxat1towwmgy-signature-ad54afc6bb6f90c90525c52bba803ad4bbc4540a1573646d15de668783fb664a-poli-170212213019-thumbnail.jpg?width=640&height=640&fit=bounds)