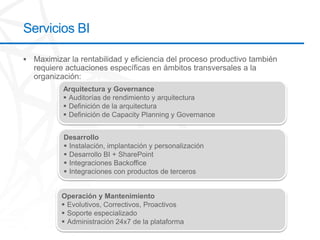
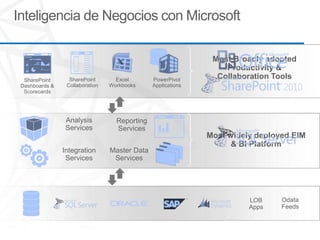
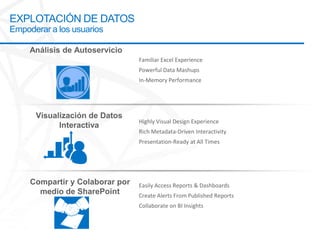
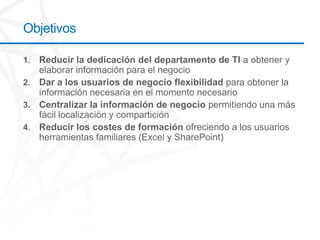
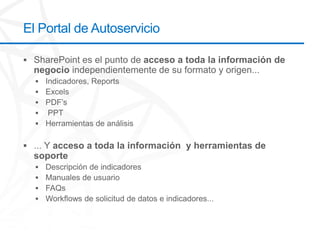
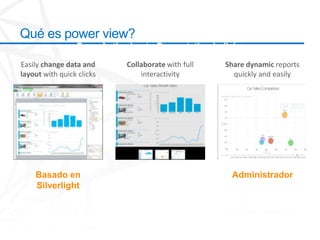
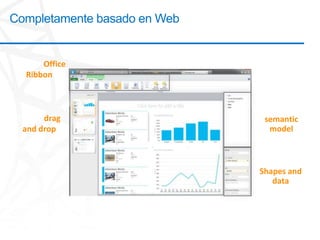
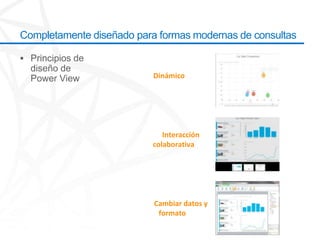
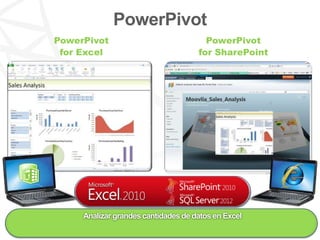
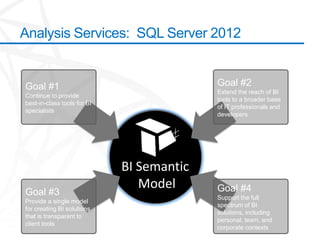
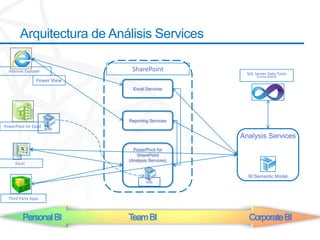
Ing. Eduardo Castro, PhD
Comunidad Windows Costa Rica
ecastro@simsasys.com
SQL Server MVP
Fuentes consultas para crear esta presentación
 http://www.slideshare.net/nextret/autoservicio-bi

 http://technet.microsoft.com/en-us/library/hh231522.aspx
Servicios BI


       Arquitectura y Governance
        Auditorías de rendimiento y arquitectura
        Definición de la arquitectura
        Definición de Capacity Planning y Governance


       Desarrollo
        Instalación, implantación y personalización
        Desarrollo BI + SharePoint
        Integraciones Backoffice
        Integraciones con productos de terceros


      Operación y Mantenimiento
       Evolutivos, Correctivos, Proactivos
       Soporte especializado
       Administración 24x7 de la plataforma
Inteligencia de Negocios con Microsoft

                                                               Most Broadly adopted
                                                                  Productivity &
  SharePoint      SharePoint       Excel       PowerPivot       Collaboration Tools
 Dashboards &    Collaboration   Workbooks     Applications
  Scorecards


                 Analysis          Reporting
                 Services          Services
                                                              Most widely deployed EIM
                                                                    & BI Platform
                Integration      Master Data
                 Services         Services


                                                                        LOB     Odata
                                                                        Apps    Feeds
EXPLOTACIÓN DE DATOS
Empoderar a los usuarios


                           Familiar Excel Experience
                           Powerful Data Mashups
                           In-Memory Performance


                           Highly Visual Design Experience
                           Rich Metadata-Driven Interactivity
                           Presentation-Ready at All Times


                           Easily Access Reports & Dashboards
                           Create Alerts From Published Reports
                           Collaborate on BI Insights
Objetivos
El Portal de Autoservicio
Ejemplo - Ficha de indicadores
Colaboración
Herramientas disponibles para el Autoservicio
Reporting services
Reporting services
Power pivot
Excel services
Excel services
SQL Server 2012
Power Pivot


Objetivos
Qué es power view?
                 From Authoring to Presentation in licks
Easily change data and      Collaborate with full   Share dynamic reports
layout with quick clicks        interactivity         quickly and easily


    Basado en                                        Administrador
    Silverlight
Completamente basado en Web


Familiar Office
   Ribbon


                               Access to
 Simply drag                   semantic
  and drop                      model
objects to see
data come to
     life                      Customize
                              Shapes and
                                 data
Completamente diseñado para formas modernas de consultas


                          Dinámicoreports
                          quickly and easily


                             Interacción
                          colaborativawith
                           full interactivity


                           Cambiar datos y
                            formatoclicks
PowerPivot
PowerPivot                             PowerPivot
 for Excel                           for SharePoint


     Analizar grandes cantidades de datos en Excel
Qué hay en SQL Server 2012
                                          Automatic Grouping improvements
Model Explorer and Field list
 for model navigation and                                                   Multiple views in a
                                             Presentation mode                single report
   data region structure                      with interactivity
 Canvas, ribbon, application                                                     Graceful recovery
       infrastructure                   Filter pane supports lists,            from model changes
                                        measure slider, calendar,
            Data region conversions        and advanced mode                  Common chart types,
  SharePoint integration                                                       chart titles, legend,
   (launch from doc lib,
                                Interactivity: highlight, cross               axes, configure chart,
 manage, preview, Power            filter, play axis, popup,                       chart series
       Pivot gallery)          transition animations, bubble                      Table & Matrix
Embedded image support                       trails…                            including subtotals,
                  Non Measures          Tab Strip and Cover Flow                  totals, blocking
Sorting            as Measures          Tiles for data navigation
  Textboxes with rich                               Show All     Small multiples layout
    text formatting            Motion charts
                          Measures as                              View and data region
 Export to               Non Measures   Drag and Drop                level filtering with
PowerPoint                                to Canvas                slicers and filter pane
Analysis Services: SQL Server 2012


Goal #1                                    Goal #2
                                           Extend the reach of BI
Continue to provide
                                           tools to a broader base
best-in-class tools for BI
                                           of IT professionals and
specialists
                                           developers


                              SQL Server
                                Analysis
                                Services
                             BI Semantic
                                 Future
                               Roadmap
                                Model
Goal #3                                    Goal #4
                                           Support the full
Provide a single model
                                           spectrum of BI
for creating BI solutions
                                           solutions, including
that is transparent to
                                           personal, team, and
client tools
                                           corporate contexts
Arquitectura de Análisis Services

  Internet Explorer            SharePoint
                                                      SQL Server Data Tools
                                                           (Formertly BIDS)
                 Power View
                                Excel Services


                              Reporting Services
PowerPivot for Excel
                       xlsx
                                                    Analysis Services
                                PowerPivot for
                                 SharePoint
                              (Analysis Services)
      Excel

                                                      BI Semantic Model
                                      xlsx


  Third Party Apps


          Personal BI         Team BI                  Corporate BI
Cómo probar Power View


http://www.microsoft.com/en-us/bi/getmicrosoftbi/tryit.aspx

http://tinyurl.com/74mrkce

Autoservicio de inteligencia de negocios

  • 1.
    Ing. Eduardo Castro,PhD Comunidad Windows Costa Rica ecastro@simsasys.com
  • 2.
  • 3.
    Fuentes consultas paracrear esta presentación http://www.slideshare.net/nextret/autoservicio-bi http://technet.microsoft.com/en-us/library/hh231522.aspx
  • 4.
    Servicios BI Arquitectura y Governance  Auditorías de rendimiento y arquitectura  Definición de la arquitectura  Definición de Capacity Planning y Governance Desarrollo  Instalación, implantación y personalización  Desarrollo BI + SharePoint  Integraciones Backoffice  Integraciones con productos de terceros Operación y Mantenimiento  Evolutivos, Correctivos, Proactivos  Soporte especializado  Administración 24x7 de la plataforma
  • 6.
    Inteligencia de Negocioscon Microsoft Most Broadly adopted Productivity & SharePoint SharePoint Excel PowerPivot Collaboration Tools Dashboards & Collaboration Workbooks Applications Scorecards Analysis Reporting Services Services Most widely deployed EIM & BI Platform Integration Master Data Services Services LOB Odata Apps Feeds
  • 7.
    EXPLOTACIÓN DE DATOS Empoderara los usuarios Familiar Excel Experience Powerful Data Mashups In-Memory Performance Highly Visual Design Experience Rich Metadata-Driven Interactivity Presentation-Ready at All Times Easily Access Reports & Dashboards Create Alerts From Published Reports Collaborate on BI Insights
  • 8.
  • 9.
    El Portal deAutoservicio
  • 10.
    Ejemplo - Fichade indicadores
  • 11.
  • 12.
  • 13.
  • 14.
  • 15.
  • 16.
  • 17.
  • 18.
  • 19.
  • 20.
    Qué es powerview? From Authoring to Presentation in licks Easily change data and Collaborate with full Share dynamic reports layout with quick clicks interactivity quickly and easily Basado en Administrador Silverlight
  • 21.
    Completamente basado enWeb Familiar Office Ribbon Access to Simply drag semantic and drop model objects to see data come to life Customize Shapes and data
  • 22.
    Completamente diseñado paraformas modernas de consultas Dinámicoreports quickly and easily Interacción colaborativawith full interactivity Cambiar datos y formatoclicks
  • 23.
    PowerPivot PowerPivot PowerPivot for Excel for SharePoint Analizar grandes cantidades de datos en Excel
  • 24.
    Qué hay enSQL Server 2012 Automatic Grouping improvements Model Explorer and Field list for model navigation and Multiple views in a Presentation mode single report data region structure with interactivity Canvas, ribbon, application Graceful recovery infrastructure Filter pane supports lists, from model changes measure slider, calendar, Data region conversions and advanced mode Common chart types, SharePoint integration chart titles, legend, (launch from doc lib, Interactivity: highlight, cross axes, configure chart, manage, preview, Power filter, play axis, popup, chart series Pivot gallery) transition animations, bubble Table & Matrix Embedded image support trails… including subtotals, Non Measures Tab Strip and Cover Flow totals, blocking Sorting as Measures Tiles for data navigation Textboxes with rich Show All Small multiples layout text formatting Motion charts Measures as View and data region Export to Non Measures Drag and Drop level filtering with PowerPoint to Canvas slicers and filter pane
  • 25.
    Analysis Services: SQLServer 2012 Goal #1 Goal #2 Extend the reach of BI Continue to provide tools to a broader base best-in-class tools for BI of IT professionals and specialists developers SQL Server Analysis Services BI Semantic Future Roadmap Model Goal #3 Goal #4 Support the full Provide a single model spectrum of BI for creating BI solutions solutions, including that is transparent to personal, team, and client tools corporate contexts
  • 26.
    Arquitectura de AnálisisServices Internet Explorer SharePoint SQL Server Data Tools (Formertly BIDS) Power View Excel Services Reporting Services PowerPivot for Excel xlsx Analysis Services PowerPivot for SharePoint (Analysis Services) Excel BI Semantic Model xlsx Third Party Apps Personal BI Team BI Corporate BI
  • 27.
    Cómo probar PowerView http://www.microsoft.com/en-us/bi/getmicrosoftbi/tryit.aspx http://tinyurl.com/74mrkce

Editor's Notes

  • #7 Key Point: Help answer the question “What is Microsoft BI” in terms of products and capabilities and tie it back to customer valueSlide Storyboard:Ultimately Microsoft BI consists of a set of products that provide a complete and end to end set of BI capabilities. This can be simplified into three key areas:The first is about connectivity. It is important to recognize that Microsoft BI sits and works on a heterogeneous stack, it is not just about SQL Server or Oracle data sources, but about working with a wide array of data sources both structured, unstructured, internal and external.The second is a set of Enterprise Information Management (EIM) and BI Platform services like Analysis Services, Reporting Services, Integration Services, Master Data Services etc.… and SQL Server is considered the most widely deployed platform (40% unit share) for these platform services. The third is about tools that the end users use whether it is Excel Workbooks or PowerPivot Solutions or SharePoint Dashboards or Scorecards. These capabilities are delivered through the productivity and collaboration tools that customers are most familiar with and in most cases already have an use which is Office and SharePoint.So the simplified view of what is Microsoft BI boils down to the capabilities that you see on the left hand side and the products that deliver these capabilities on the right hand side.
  • #8 Specifically today I am here to teach you a little about the area of investments for SQL Server 2012 around Self Service Analysis, Data Visualization, and the consumption of those services through SharePoint.
  • #24 Ability to work with massive data volumes in tens of millionsMash ups (pivot tables) from multiple tables and a wide variety of data source types80+ contextual DAX measures, time intelligence, distinct count, and many other complex logical functionsPowerPivot Relationships in-memory, highly-scalable VertiPaq technology is so much faster than classic VLOOKUPsWorld-class 5x, 10x and even 15x Data CompressionSharePoint PowerPivot Gallery and automated, scheduled data refresh features SharePoint PowerPivot self-service reporting data sourceSharePoint PowerPivot usage and query source trackingUser friendly, configurable Slicers join multiple pivot charts and pivot tables for interactive dashboards Minimal learning curve for experienced Excel users to easily develop creative and impactful analytic solutions
  • #26 We wanted to take a look at a multi-year / multi-release vision for Analysis Services Here we show the future “roadmap” of Analysis Services, from SQL Server 2012 and beyond.We want to build on the strengths and success of Analysis Services including the current ecosystem of developers & partners, BI tools & solutions. The current base of BI-focused developers and IT pros are proficient with multidimensional BI solutions; we’ll continue to provide best-in-class tools for BI specialists.We’ll expand the reach of BI to include the broader base of developers and IT pros in the Microsoft ecosystem. To do that, we need to embrace the relational data model for BI, which is well understood by developers and IT pros.At the same time, we want to carry forward existing capabilities in OLAP, so we want to bring together relational and multidimensional modeling under one BI platform. Analysis Services will provide a single model for creating BI solutions that is transparent to client tools; the goal is to extend analysis services to include a broader base of users. We want to provide flexibility in the platform to suit the diverse needs of BI applications. Our vision for this is the BI Semantic Model.
  • #27 This is a high-level view of how the BI semantic model flows through to PowerPivot to SharePoint, to Analysis Services. This shows that this is the same model, one model, in a workbook and it flows through to SharePoint and you can also have the same model in Analysis Services published from Visual Studio.You have end user tools that live on the user’s desktop or you have services such as Excel services and reporting services that can access the model.