Downloaded 193 times
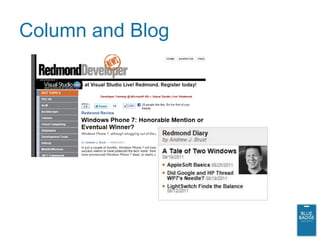
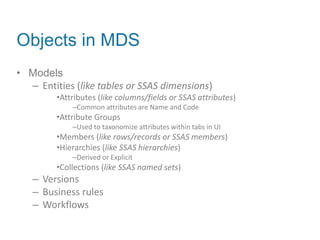
![Calculated Columns and DAX
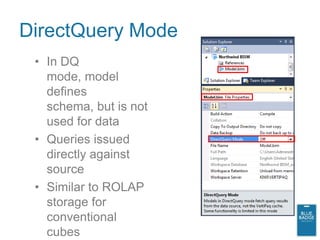
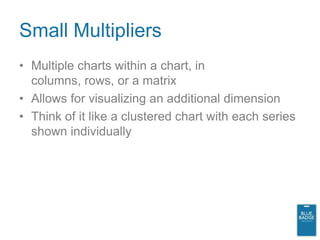
• Formula-based columns may be created
• Formula syntax is called DAX (Data Analysis
eXpressions).
– Not to be confused with MDX or DMX. Or DACs.
• DAX expressions are similar to Excel formulas
– Work with tables and columns; similar to, but distinct
from, worksheets and their columns (and rows)
• =FUNC('table name'[column name])
• =FUNCX('table name', <filter expression>)
• FILTER(Resellers,[ProductLine] = "Mountain")
• RELATED(Products[EnglishProductName])
• DAX expressions can be heavily nested](https://image.slidesharecdn.com/fwsqldenalibi-111129235104-phpapp02/85/Evolved-BI-with-SQL-Server-2012-14-320.jpg)


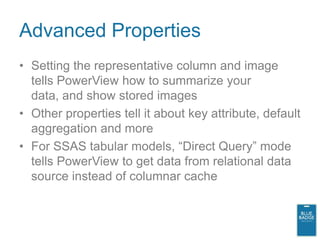


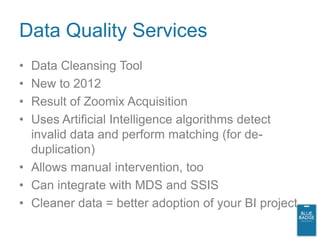
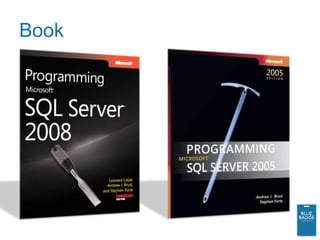
![DQS Concepts
• Knowledge Bases
– Domains
• “semantic representation[s] of a type of data in a data
field…[contain] a list of trusted values, invalid values, and
erroneous data.”
– Mapping
• Data Quality Projects
– Cleansing (i.e. correcting)
• Validate Using Reference Data Services and Use Azure DataMarket
(or 3rd party providers)
– Matching (i.e. de-duping)
– Confidence
– Profiling, Monitoring](https://image.slidesharecdn.com/fwsqldenalibi-111129235104-phpapp02/85/Evolved-BI-with-SQL-Server-2012-49-320.jpg)

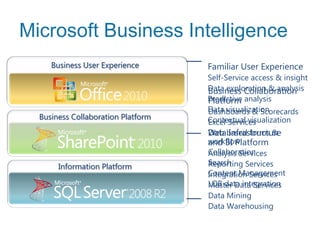
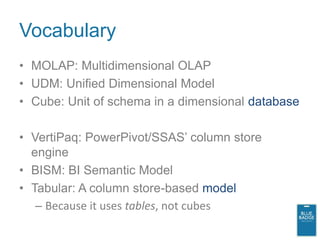
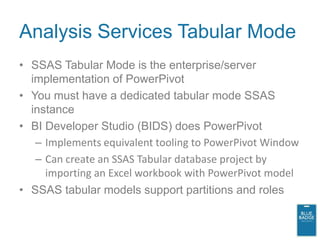
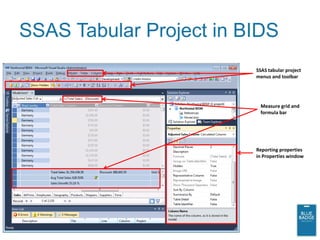
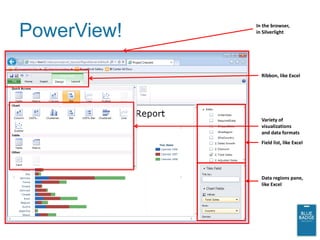
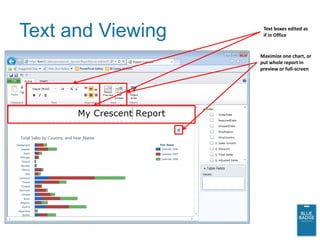
This document provides an overview of new business intelligence capabilities in SQL Server 2012, including PowerPivot, Analysis Services Tabular mode, and PowerView. PowerPivot allows users to build data models in Excel and publish them to SharePoint for collaborative analysis. Analysis Services Tabular mode is the server version of PowerPivot. PowerView is a new ad-hoc reporting tool that works with PowerPivot and Analysis Services Tabular models to provide interactive data visualization and exploration capabilities in the browser.