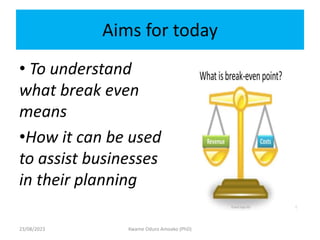
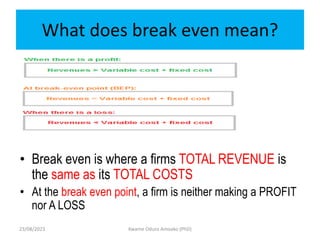
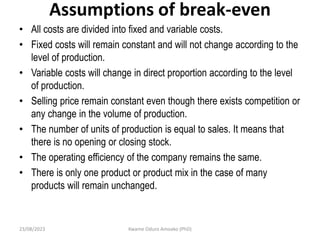
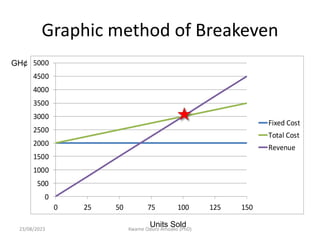
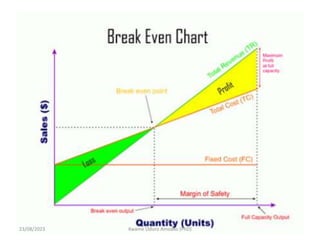
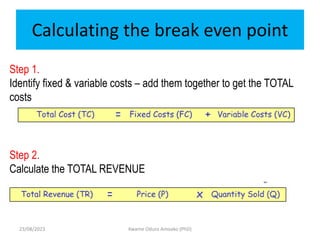
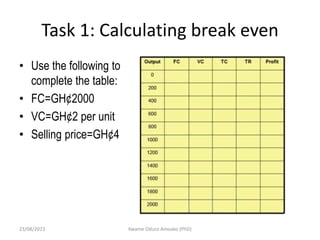
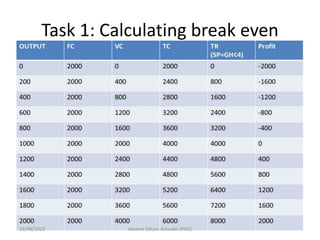
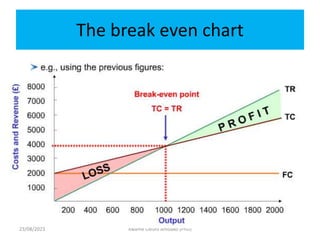
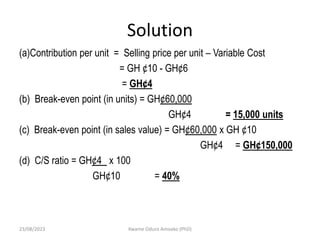
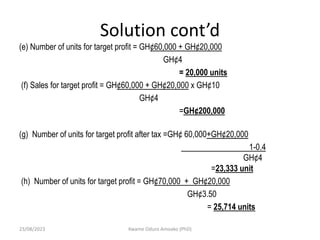
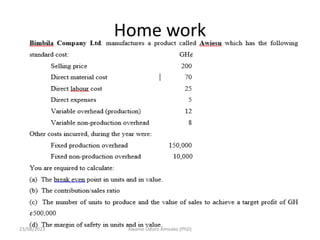
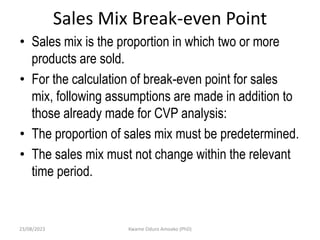
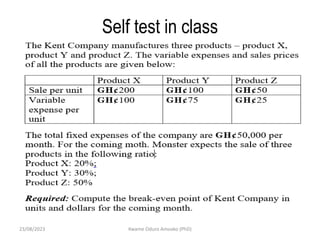
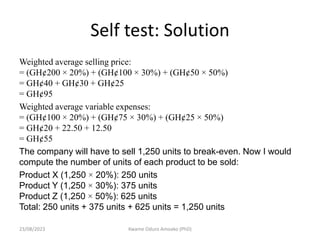
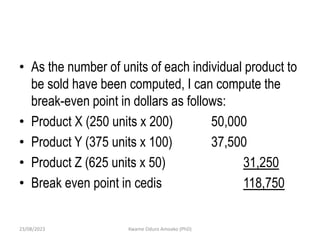
SlideShare a Scribd company logo
ACC 557: MANAGEMENT
ACCOUNTING
Cost-Volume-profit analysis
(Break-even analysis)
Compiled by
Kwame Oduro Amoako (Ph.D.)
23/08/2023
Kwame Oduro Amoako (PhD)
Aims for today
• To understand
what break even
means
•How it can be used
to assist businesses
in their planning
23/08/2023 Kwame Oduro Amoako (PhD)
What does break even mean?
• Break even is where a firms TOTAL REVENUE is
the same as its TOTAL COSTS
• At the break even point, a firm is neither making a PROFIT
nor A LOSS
Kwame Oduro Amoako (PhD)
23/08/2023
Break-even analysis?
• A break-even analysis is a useful tool for determining at
what point your company, or a new product or
service, will be profitable.
• Put another way, it's a financial calculation used to
determine the number of products or services you need to
sell to at least cover your costs.
• The break even analysis is important to business owners
and managers in determining how many units (or revenues)
are needed to cover fixed and variable expenses of the
business.
23/08/2023 Kwame Oduro Amoako (PhD)
Uses of break-even analysis
Break-even analysis enables a business organization to:
• Measure profit and losses at different levels of production
and sales.
• Predict the effect of changes in sales prices on quantities to
be sold.
• Analyze the relationship between fixed and variable costs.
• Predict the effect of cost and efficiency changes on
profitability.
23/08/2023 Kwame Oduro Amoako (PhD)
Assumptions of break-even
• All costs are divided into fixed and variable costs.
• Fixed costs will remain constant and will not change according to the
level of production.
• Variable costs will change in direct proportion according to the level
of production.
• Selling price remain constant even though there exists competition or
any change in the volume of production.
• The number of units of production is equal to sales. It means that
there is no opening or closing stock.
• The operating efficiency of the company remains the same.
• There is only one product or product mix in the case of many
products will remain unchanged.
23/08/2023 Kwame Oduro Amoako (PhD)
Limitation of break even analysis
• Break-even analysis is based on the assumption that all costs and
expenses can be clearly separated into fixed and variable
components.
• It assumes that fixed costs remain constant at all levels of activity. It
should be noted that fixed costs tend to vary beyond a certain level
of activity.
• It assumes that variable costs vary proportionately with the volume of
output is not true.
• The assumption that selling price remains unchanged gives a straight
revenue line which may not be true.
• The assumption that only one product is produced or that product
mix will remain unchanged is difficult to find in practice.
• It assumes that the business conditions may not change which is not
true.
23/08/2023 Kwame Oduro Amoako (PhD)
Methods of conducting break even
analysis
• Graphical method
• Use of contribution margin method
• Use of equation method
23/08/2023 Kwame Oduro Amoako (PhD)
Task 2: Draw the break even chart using
your data
1. Label the vertical axis “sales and costs in pounds”.
2. Label the horizontal axis “sales/production (units)”.
3. Draw on the BE point
4. Draw a horizontal line for total fixed costs.
5. Starting at the Total costs point, draw the total cost line going through
the break even point.
6. Starting at zero, draw the total revenue line through the break even.
7. Where the sales revenue crosses the total costs line is the break
even point.
8. Read off the units of sales to give the break even level of sales.
9. The gap between the total costs line and sales revenue line after the
break even point represents the level of profit.
Kwame Oduro Amoako (PhD)
23/08/2023
Graphical method of Breakeven
GH¢
Units Sold
23/08/2023 Kwame Oduro Amoako (PhD)
Graphic method of Breakeven
0
500
1000
1500
2000
2500
3000
3500
4000
4500
5000
0 25 50 75 100 125 150
Fixed Cost
Revenue
Units Sold
GH¢
23/08/2023 Kwame Oduro Amoako (PhD)
Graphic method of Breakeven
0
500
1000
1500
2000
2500
3000
3500
4000
4500
5000
0 25 50 75 100 125 150
Fixed Cost
Total Cost
Revenue
Units Sold
GH¢
23/08/2023 Kwame Oduro Amoako (PhD)
Graphic method of Breakeven
0
500
1000
1500
2000
2500
3000
3500
4000
4500
5000
0 25 50 75 100 125 150
Fixed Cost
Total Cost
Revenue
GH¢
Units Sold
23/08/2023 Kwame Oduro Amoako (PhD)
Calculating the break even point
Kwame Oduro Amoako (PhD)
Step 1.
Identify fixed & variable costs – add them together to get the TOTAL
costs
Step 2.
Calculate the TOTAL REVENUE
23/08/2023
Task 1: Calculating break even
Kwame Oduro Amoako (PhD)
• Use the following to
complete the table:
• FC=GH¢2000
• VC=GH¢2 per unit
• Selling price=GH¢4
23/08/2023
Task 1: Calculating break even
23/08/2023 Kwame Oduro Amoako (PhD)
The break even chart
Kwame Oduro Amoako (PhD)
23/08/2023
Margin of safety formula
• The difference between the planned number of
units or actual sales and the number of units of
sales at break even point.
• From the table and chart
They can make:
• 2,000 units potentially – 1,000 actual units at break even
• = 1,000 units Margin of safety
23/08/2023 Kwame Oduro Amoako (PhD)
Task 3: Draw the margin of safety
Kwame Oduro Amoako (PhD)
23/08/2023
Self test
• KFC operate a hot dog stand
in their branch at Bekwai
Roundabout.
• The wages at the stand costs
GH¢200 per week. Each hot
dog needs one bread roll at
20p, one sausage at 25p and
sauces at 5p.
• The selling price of each hot
dog is GH¢1
23/08/2023 Kwame Oduro Amoako (PhD)
Complete the table
At what quantity do total costs = total revenue? (Break even)
What profit is made when they sell 600 hot dogs?
QUANTITY FIXED
COSTS
VARIABLE
COSTS
TOTAL
COSTS
TOTAL
REVENUE
PROFIT OR
LOSS?
100
150
200
250
300
350
400
450
500
550
600
650
23/08/2023 Kwame Oduro Amoako (PhD)
Complete the table
At what quantity do total costs = total revenue? (Break even)
What profit is made when they sell 600 hot dogs?
QUANTITY FIXED
COSTS
VARIABLE
COSTS
TOTAL
COSTS
TOTAL
REVENUE
PROFIT OR
LOSS?
100 200 50 250 100 -150
150 200 75 275 150 -125
200 200 100 300 200 -100
250 200 125 325 250 -75
300 200 150 350 300 -50
350 200 175 375 350 -25
400 200 200 400 400 0
450 200 225 425 450 25
500 200 250 450 500 50
550 200 275 475 550 75
600 200 300 500 600 100
650 200 325 525 650 125
23/08/2023 Kwame Oduro Amoako (PhD)
Next task
1. Draw a Break Even chart for the Hot Dog business -
Ensure your chart is FULLY and CLEARLY labelled
2. Draw on the margin of safety
3. Explain how the Break even analysis will help Grace
and Joe
4. Discuss what strategies Grace and Joe could use to
enable them to reach their break even point quicker
5. Evaluate which of these strategies would be best for
the business
23/08/2023 Kwame Oduro Amoako (PhD)
Break even formulae approach
23/08/2023 Kwame Oduro Amoako (PhD)
Contribution Margin
• One of the key relationships in CVP analysis is contribution margin
(CM).
• Contribution margin is the remaining of a product price after
deducting variable cost per unit.
• Contribution margin is a product's price minus all associated
variable costs, resulting in the incremental profit earned for each unit
sold.
• The total contribution margin generated by an entity represents the
total earnings available to pay for fixed expenses and to generate a
profit
• The CM is then available to cover fixed costs and to contribute
income for the company.
23/08/2023 Kwame Oduro Amoako (PhD)
Unit Contribution Margin
Views differ as to the best way to express contribution margin
(CM). Some favor a per unit basis.
• At Kuma Wood Videos, the contribution margin is GH¢2.
Unit Selling Price
Unit Variable
Cost
Contribution
Margin
- =
GH¢5 GH¢3 GH¢2
- =
 CM per unit indicates that for every CD sold, Kuma Wood
Video will have GH¢200 to cover fixed costs and
contribute to income.
23/08/2023 Kwame Oduro Amoako (PhD)
Contribution Margin
• For example, assume that Kumawood Video sells 100,000 CDs in
one month,
• sales are GH¢500,000 (100,000 x GH¢5) and
• variable costs are GH¢300,000 (100,000 x GH¢3).
• Thus, total contribution is GH¢200,000, computed as follows:
Sales Variable Costs Contribution
- =
GH¢500,000 GH¢300,000 GH¢200,000
- =
23/08/2023 Kwame Oduro Amoako (PhD)
Contribution Margin Ratio
Others prefer to use a contribution margin ratio.
• At Kuma Wood Video, the contribution margin
ratio is 40%.
Contribution
Margin per Unit
Unit Selling Price
Contribution
Margin Ratio
 =
GH¢2 GH¢5 40%
 =
 The CM ratio means that 40 cents of each sales dollar
(GH¢1 x 40%) is available to apply to fixed costs and
to contribute to income.
23/08/2023 Kwame Oduro Amoako (PhD)
Break even formulae approach
• Break-even point (in units) = Fixed Costs
Contribution/unit
• Break-even point (in sales value) = Fixed Costs x S.P
Contribution/unit
OR Break-even point (in units) x Selling price
OR = Fixed Costs x 1
C/S ratio
• C/S ratio = Contribution/unit x 100
Sales price per unit
23/08/2023 Kwame Oduro Amoako (PhD)
Break even formulae approach
cont’d
• Level of sales to result in target profit (in units)
= Fixed Costs + Target Profit
Contribution/unit
• Level of sales to result in target profit (in sales value)
= Fixed Costs + Target Profit x Sales Price/unit
Contribution per unit
• Level of sales to result in target profit after tax (units)
23/08/2023 Kwame Oduro Amoako (PhD)
Break even formulae approach
cont’d
• Margin of Safety in units = Total Profit
Contribution/unit
• Margin of Safety in sales value
= Total Sales – Break-even point in sales.
OR
Total Profit
C/S ratio
23/08/2023 Kwame Oduro Amoako (PhD)
Illustration 1
A company makes a single product with a sales price of GH¢10 and a marginal
cost of GH¢6. Fixed costs are GH¢60,000 p.a. Calculate:
a) Contribution per unit
b) Number of units to break even.
c) Sales at break-even point.
d) C/S ratio
e) What number of units will need to be sold to achieve a profit of GH¢20,000
p.a.
f) What level of sales will achieve a profit of GH¢20,000 p.a.
g) If the taxation rate is 40% how many units will need to be sold to make a
profit after tax of GH¢20,000 p.a.?
h) Because of increasing costs the marginal cost is expected to rise to
GH¢6.50 per unit and fixed costs to GH¢70,000 p.a. If the selling price
cannot be increased what will be the number of units required to maintain
a profit of GH¢20,000 p.a.? (Ignore tax).
23/08/2023 Kwame Oduro Amoako (PhD)
Solution
(a)Contribution per unit = Selling price per unit – Variable Cost
= GH ¢10 - GH¢6
= GH¢4
(b) Break-even point (in units) = GH¢60,000
GH¢4 = 15,000 units
(c) Break-even point (in sales value) = GH¢60,000 x GH ¢10
GH¢4 = GH¢150,000
(d) C/S ratio = GH¢4 x 100
GH¢10 = 40%
23/08/2023 Kwame Oduro Amoako (PhD)
Solution cont’d
(e) Number of units for target profit = GH¢60,000 + GH¢20,000
GH¢4
= 20,000 units
(f) Sales for target profit = GH¢60,000 + GH¢20,000 x GH¢10
GH¢4
=GH¢200,000
(g) Number of units for target profit after tax =GH¢ 60,000+GH¢20,000
1-0.4
GH¢4
=23,333 unit
(h) Number of units for target profit = GH¢70,000 + GH¢20,000
GH¢3.50
= 25,714 units
23/08/2023 Kwame Oduro Amoako (PhD)
Home work
23/08/2023 Kwame Oduro Amoako (PhD)
Sales Mix Break-even Point
• Sales mix is the proportion in which two or more
products are sold.
• For the calculation of break-even point for sales
mix, following assumptions are made in addition to
those already made for CVP analysis:
• The proportion of sales mix must be predetermined.
• The sales mix must not change within the relevant
time period.
23/08/2023 Kwame Oduro Amoako (PhD)
Sales Mix Break-even Point
• The calculation method for the break-even point of sales mix is
based on the contribution approach method.
• Since we have multiple products in sales mix therefore it is most
likely that we will be dealing with products with different
contribution margin per unit and contribution margin ratios.
• This problem is overcome by calculating weighted average
contribution margin per unit and contribution margin ratio.
• These are then used to calculate the break-even point for sales
mix.
23/08/2023 Kwame Oduro Amoako (PhD)
Illustration:
Following information is related to sales mix of product A, B
and C. Calculate the break-even point in units and in dollars.
Product A B C
Sales Price per
Unit
GH¢15 GH¢21 GH¢36
Variable Cost
per Unit
GH¢9 GH¢14 GH¢19
Sales Mix
Percentage
20% 20% 60%
Total Fixed Cost GH¢40,000
23/08/2023 Kwame Oduro Amoako (PhD)
Solution
Step 1: Calculate the contribution margin
Product A B C
Sales Price per
Unit
GH¢15 GH¢21 GH¢36
− Variable Cost
per Unit
GH¢9 GH¢14 GH¢19
Contribution
Margin per Unit
GH¢6 GH¢7 GH¢17
23/08/2023 Kwame Oduro Amoako (PhD)
Solution cont’d
Step 2
Calculate the weighted-average contribution margin per unit for
the sales mix using the following formula:
• Product A CM per Unit × Product A Sales Mix Percentage
+ Product B CM per Unit × Product B Sales Mix Percentage
+ Product C CM per Unit × Product C Sales Mix Percentage
= Weighted Average Unit Contribution Margin
23/08/2023 Kwame Oduro Amoako (PhD)
Solution cont’d: Step 2
Product A B C
Sales Price per Unit GH¢15 GH¢21 GH¢36
− Variable Cost per Unit GH¢9 GH¢14 GH¢19
Contribution Margin per Unit GH¢6 GH¢7 GH¢17
× Sales Mix Percentage 20% 20% 60%
Weighted contribution per
unit
GH¢1.2 GH¢1.4 GH¢10.2
Sum: Weighted Average CM
per Unit
GH¢12.80
23/08/2023 Kwame Oduro Amoako (PhD)
step 3: Calculate total units of sales mix required to break-even using
the formula:
Break-even Point in Units of Sales Mix = Total Fixed Cost ÷ Weighted
Average CM per Unit
Total Fixed Cost GH¢40,000
÷ Weighted Average CM
per Unit
GH¢12.80
Break-even Point in Units
of Sales Mix
3,125
23/08/2023 Kwame Oduro Amoako (PhD)
Step 4: Calculate the number units of product A, B
and C at break-even point:
Product A B C
Sales Mix Ratio 20% 20% 60%
× Total Break-even Units 3,125 3,125 3,125
Product Units at Break-
even Point
625 625 1,875
23/08/2023 Kwame Oduro Amoako (PhD)
Step 5: Calculate Break-even Point in dollars as follows:
Product A B C
Product Units at
Break-even Point
625 625 1,875
× Price per Unit GH¢15 GH¢21 GH¢36
Product Sales in
Dollars
GH¢9,375 GH¢13,125 GH¢67,500
Sum: Break-even
Point in Dollars
GH¢90,000
23/08/2023 Kwame Oduro Amoako (PhD)
Self test in class
23/08/2023 Kwame Oduro Amoako (PhD)
Self test: Solution
Weighted average selling price:
= (GH¢200 × 20%) + (GH¢100 × 30%) + (GH¢50 × 50%)
= GH¢40 + GH¢30 + GH¢25
= GH¢95
Weighted average variable expenses:
= (GH¢100 × 20%) + (GH¢75 × 30%) + (GH¢25 × 50%)
= GH¢20 + 22.50 + 12.50
= GH¢55
The company will have to sell 1,250 units to break-even. Now I would
compute the number of units of each product to be sold:
Product X (1,250 × 20%): 250 units
Product Y (1,250 × 30%): 375 units
Product Z (1,250 × 50%): 625 units
Total: 250 units + 375 units + 625 units = 1,250 units
23/08/2023 Kwame Oduro Amoako (PhD)
Alternatively: Fast track
• You can also use the break even formula:
23/08/2023 Kwame Oduro Amoako (PhD)
Self test: Solution cont’d
23/08/2023 Kwame Oduro Amoako (PhD)
• As the number of units of each individual product to
be sold have been computed, I can compute the
break-even point in dollars as follows:
• Product X (250 units x 200) 50,000
• Product Y (375 units x 100) 37,500
• Product Z (625 units x 50) 31,250
• Break even point in cedis 118,750
23/08/2023 Kwame Oduro Amoako (PhD)

More Related Content

Similar to Man Acc KNUST lecture 2 break even analysis.ppt

Notes on Cost volume profit analysis
Notes on Cost volume profit analysisNotes on Cost volume profit analysis
Notes on Cost volume profit analysis
Yamini Kahaliya
 
Ppt12
Ppt12Ppt12
Ppt12
Ppt12Ppt12
Short term decision making.pptx
Short term decision making.pptxShort term decision making.pptx
Short term decision making.pptx
HARSHITGARG688173
 
COST-VOLUME-PROFIT (CVP) analysis
COST-VOLUME-PROFIT (CVP) analysis COST-VOLUME-PROFIT (CVP) analysis
COST-VOLUME-PROFIT (CVP) analysis
AJ Raina
 
Break even analysis
Break even analysisBreak even analysis
Break even analysis
Maheshwari Gummapu
 
Marginal Costing.pptx
Marginal Costing.pptxMarginal Costing.pptx
Marginal Costing.pptx
Suku Thomas Samuel
 
Cost based pricing ppt gp
Cost based pricing ppt gpCost based pricing ppt gp
Cost based pricing ppt gp
PUTTU GURU PRASAD
 
Presentation on CVP Analysis, Break Even Point & Applications of Marginal Cos...
Presentation on CVP Analysis, Break Even Point & Applications of Marginal Cos...Presentation on CVP Analysis, Break Even Point & Applications of Marginal Cos...
Presentation on CVP Analysis, Break Even Point & Applications of Marginal Cos...
Leena Kakkar
 
Cost volume-profit (cvp)
Cost volume-profit (cvp)Cost volume-profit (cvp)
Cost volume-profit (cvp)
Jessy Chong
 
Break Even Analysis
Break Even AnalysisBreak Even Analysis
Break Even Analysis
Seema Kavatkar
 
AFM PPT M5.pdf
AFM PPT M5.pdfAFM PPT M5.pdf
AFM PPT M5.pdf
Sagarchaturvedi21
 
cost accounting -profit analysis chapter 1
cost accounting -profit analysis chapter 1cost accounting -profit analysis chapter 1
cost accounting -profit analysis chapter 1
salahnaser9999
 
Cost-Volume-Profit Analysis and Business Decisions
Cost-Volume-Profit Analysis and Business DecisionsCost-Volume-Profit Analysis and Business Decisions
Cost-Volume-Profit Analysis and Business Decisions
Julius Noble Ssekazinga
 
Break even analysis Final.pptx
Break even analysis Final.pptxBreak even analysis Final.pptx
Break even analysis Final.pptx
PuneetGarg111103
 
COST BASED PRICING
COST BASED PRICINGCOST BASED PRICING
COST BASED PRICING
Anu Sree
 
A case study of cost analysis and pricing decision of sme
A case study of cost analysis and pricing decision of smeA case study of cost analysis and pricing decision of sme
A case study of cost analysis and pricing decision of sme
Enamul Islam
 
Cost market & competitive analysis
Cost market & competitive analysisCost market & competitive analysis
Cost market & competitive analysis
Anupam Ghosh
 
2. Cost Volume Profit Analysis - a tool for decision making
2. Cost Volume Profit Analysis - a tool for decision making2. Cost Volume Profit Analysis - a tool for decision making
2. Cost Volume Profit Analysis - a tool for decision making
SimmiAgrawal8
 
Break even analysis
Break even analysisBreak even analysis
Break even analysis
Indukoori S S N Raju - MVGR DMS
 

Similar to Man Acc KNUST lecture 2 break even analysis.ppt (20)

Notes on Cost volume profit analysis
Notes on Cost volume profit analysisNotes on Cost volume profit analysis
Notes on Cost volume profit analysis
 
Ppt12
Ppt12Ppt12
Ppt12
 
Ppt12
Ppt12Ppt12
Ppt12
 
Short term decision making.pptx
Short term decision making.pptxShort term decision making.pptx
Short term decision making.pptx
 
COST-VOLUME-PROFIT (CVP) analysis
COST-VOLUME-PROFIT (CVP) analysis COST-VOLUME-PROFIT (CVP) analysis
COST-VOLUME-PROFIT (CVP) analysis
 
Break even analysis
Break even analysisBreak even analysis
Break even analysis
 
Marginal Costing.pptx
Marginal Costing.pptxMarginal Costing.pptx
Marginal Costing.pptx
 
Cost based pricing ppt gp
Cost based pricing ppt gpCost based pricing ppt gp
Cost based pricing ppt gp
 
Presentation on CVP Analysis, Break Even Point & Applications of Marginal Cos...
Presentation on CVP Analysis, Break Even Point & Applications of Marginal Cos...Presentation on CVP Analysis, Break Even Point & Applications of Marginal Cos...
Presentation on CVP Analysis, Break Even Point & Applications of Marginal Cos...
 
Cost volume-profit (cvp)
Cost volume-profit (cvp)Cost volume-profit (cvp)
Cost volume-profit (cvp)
 
Break Even Analysis
Break Even AnalysisBreak Even Analysis
Break Even Analysis
 
AFM PPT M5.pdf
AFM PPT M5.pdfAFM PPT M5.pdf
AFM PPT M5.pdf
 
cost accounting -profit analysis chapter 1
cost accounting -profit analysis chapter 1cost accounting -profit analysis chapter 1
cost accounting -profit analysis chapter 1
 
Cost-Volume-Profit Analysis and Business Decisions
Cost-Volume-Profit Analysis and Business DecisionsCost-Volume-Profit Analysis and Business Decisions
Cost-Volume-Profit Analysis and Business Decisions
 
Break even analysis Final.pptx
Break even analysis Final.pptxBreak even analysis Final.pptx
Break even analysis Final.pptx
 
COST BASED PRICING
COST BASED PRICINGCOST BASED PRICING
COST BASED PRICING
 
A case study of cost analysis and pricing decision of sme
A case study of cost analysis and pricing decision of smeA case study of cost analysis and pricing decision of sme
A case study of cost analysis and pricing decision of sme
 
Cost market & competitive analysis
Cost market & competitive analysisCost market & competitive analysis
Cost market & competitive analysis
 
2. Cost Volume Profit Analysis - a tool for decision making
2. Cost Volume Profit Analysis - a tool for decision making2. Cost Volume Profit Analysis - a tool for decision making
2. Cost Volume Profit Analysis - a tool for decision making
 
Break even analysis
Break even analysisBreak even analysis
Break even analysis
 

More from kwame Oduro Amoako (PhD)

QUALITY ASSURANCE practices at Higher Educational Institutions
QUALITY ASSURANCE practices at Higher Educational InstitutionsQUALITY ASSURANCE practices at Higher Educational Institutions
QUALITY ASSURANCE practices at Higher Educational Institutions
kwame Oduro Amoako (PhD)
 
Building trust at work and in personal life
Building trust at work and in personal lifeBuilding trust at work and in personal life
Building trust at work and in personal life
kwame Oduro Amoako (PhD)
 
MBA fin mgt lecture 1.ppt
MBA fin mgt lecture 1.pptMBA fin mgt lecture 1.ppt
MBA fin mgt lecture 1.ppt
kwame Oduro Amoako (PhD)
 
lecture 2 intro to fin stmts.ppt
lecture 2 intro to fin stmts.pptlecture 2 intro to fin stmts.ppt
lecture 2 intro to fin stmts.ppt
kwame Oduro Amoako (PhD)
 
MBA fin mgt Lecture 5 inv appraisal.pptx
MBA fin mgt Lecture 5 inv appraisal.pptxMBA fin mgt Lecture 5 inv appraisal.pptx
MBA fin mgt Lecture 5 inv appraisal.pptx
kwame Oduro Amoako (PhD)
 
Man Acct KNUST lecture 1 cost behaviours.ppt
Man Acct KNUST lecture 1 cost behaviours.pptMan Acct KNUST lecture 1 cost behaviours.ppt
Man Acct KNUST lecture 1 cost behaviours.ppt
kwame Oduro Amoako (PhD)
 
Man Acc lecture 3 relevance costs.ppt.pptx
Man Acc lecture 3 relevance costs.ppt.pptxMan Acc lecture 3 relevance costs.ppt.pptx
Man Acc lecture 3 relevance costs.ppt.pptx
kwame Oduro Amoako (PhD)
 
Week 6 Slides (3) (1).pptx
Week 6 Slides (3) (1).pptxWeek 6 Slides (3) (1).pptx
Week 6 Slides (3) (1).pptx
kwame Oduro Amoako (PhD)
 
PPT on literature review.pdf
PPT on literature review.pdfPPT on literature review.pdf
PPT on literature review.pdf
kwame Oduro Amoako (PhD)
 
Advanced auditing lecture lecture 2.pptx
Advanced auditing lecture lecture 2.pptxAdvanced auditing lecture lecture 2.pptx
Advanced auditing lecture lecture 2.pptx
kwame Oduro Amoako (PhD)
 
Advanced auditing lecture lecture 3 Audit planning.pptx
Advanced auditing lecture lecture 3 Audit planning.pptxAdvanced auditing lecture lecture 3 Audit planning.pptx
Advanced auditing lecture lecture 3 Audit planning.pptx
kwame Oduro Amoako (PhD)
 
Lecture 7 Stakeholder engagement.pptx
Lecture 7 Stakeholder engagement.pptxLecture 7 Stakeholder engagement.pptx
Lecture 7 Stakeholder engagement.pptx
kwame Oduro Amoako (PhD)
 
Advanced auditing lecture lecture 1.pptx
Advanced auditing lecture lecture 1.pptxAdvanced auditing lecture lecture 1.pptx
Advanced auditing lecture lecture 1.pptx
kwame Oduro Amoako (PhD)
 
Business ethics Whistle blowing.pptx
Business ethics Whistle blowing.pptxBusiness ethics Whistle blowing.pptx
Business ethics Whistle blowing.pptx
kwame Oduro Amoako (PhD)
 
Common size analysis
Common size analysisCommon size analysis
Common size analysis
kwame Oduro Amoako (PhD)
 
Dr Amoako profile.docx
Dr Amoako profile.docxDr Amoako profile.docx
Dr Amoako profile.docx
kwame Oduro Amoako (PhD)
 
Sample of MSC research proposal
Sample of MSC research proposalSample of MSC research proposal
Sample of MSC research proposal
kwame Oduro Amoako (PhD)
 
Mba fin mgt lecture 3 time value of money
Mba fin mgt lecture 3 time value of moneyMba fin mgt lecture 3 time value of money
Mba fin mgt lecture 3 time value of money
kwame Oduro Amoako (PhD)
 

More from kwame Oduro Amoako (PhD) (18)

QUALITY ASSURANCE practices at Higher Educational Institutions
QUALITY ASSURANCE practices at Higher Educational InstitutionsQUALITY ASSURANCE practices at Higher Educational Institutions
QUALITY ASSURANCE practices at Higher Educational Institutions
 
Building trust at work and in personal life
Building trust at work and in personal lifeBuilding trust at work and in personal life
Building trust at work and in personal life
 
MBA fin mgt lecture 1.ppt
MBA fin mgt lecture 1.pptMBA fin mgt lecture 1.ppt
MBA fin mgt lecture 1.ppt
 
lecture 2 intro to fin stmts.ppt
lecture 2 intro to fin stmts.pptlecture 2 intro to fin stmts.ppt
lecture 2 intro to fin stmts.ppt
 
MBA fin mgt Lecture 5 inv appraisal.pptx
MBA fin mgt Lecture 5 inv appraisal.pptxMBA fin mgt Lecture 5 inv appraisal.pptx
MBA fin mgt Lecture 5 inv appraisal.pptx
 
Man Acct KNUST lecture 1 cost behaviours.ppt
Man Acct KNUST lecture 1 cost behaviours.pptMan Acct KNUST lecture 1 cost behaviours.ppt
Man Acct KNUST lecture 1 cost behaviours.ppt
 
Man Acc lecture 3 relevance costs.ppt.pptx
Man Acc lecture 3 relevance costs.ppt.pptxMan Acc lecture 3 relevance costs.ppt.pptx
Man Acc lecture 3 relevance costs.ppt.pptx
 
Week 6 Slides (3) (1).pptx
Week 6 Slides (3) (1).pptxWeek 6 Slides (3) (1).pptx
Week 6 Slides (3) (1).pptx
 
PPT on literature review.pdf
PPT on literature review.pdfPPT on literature review.pdf
PPT on literature review.pdf
 
Advanced auditing lecture lecture 2.pptx
Advanced auditing lecture lecture 2.pptxAdvanced auditing lecture lecture 2.pptx
Advanced auditing lecture lecture 2.pptx
 
Advanced auditing lecture lecture 3 Audit planning.pptx
Advanced auditing lecture lecture 3 Audit planning.pptxAdvanced auditing lecture lecture 3 Audit planning.pptx
Advanced auditing lecture lecture 3 Audit planning.pptx
 
Lecture 7 Stakeholder engagement.pptx
Lecture 7 Stakeholder engagement.pptxLecture 7 Stakeholder engagement.pptx
Lecture 7 Stakeholder engagement.pptx
 
Advanced auditing lecture lecture 1.pptx
Advanced auditing lecture lecture 1.pptxAdvanced auditing lecture lecture 1.pptx
Advanced auditing lecture lecture 1.pptx
 
Business ethics Whistle blowing.pptx
Business ethics Whistle blowing.pptxBusiness ethics Whistle blowing.pptx
Business ethics Whistle blowing.pptx
 
Common size analysis
Common size analysisCommon size analysis
Common size analysis
 
Dr Amoako profile.docx
Dr Amoako profile.docxDr Amoako profile.docx
Dr Amoako profile.docx
 
Sample of MSC research proposal
Sample of MSC research proposalSample of MSC research proposal
Sample of MSC research proposal
 
Mba fin mgt lecture 3 time value of money
Mba fin mgt lecture 3 time value of moneyMba fin mgt lecture 3 time value of money
Mba fin mgt lecture 3 time value of money
 

Recently uploaded

Business storytelling: key ingredients to a story
Business storytelling: key ingredients to a storyBusiness storytelling: key ingredients to a story
Business storytelling: key ingredients to a story
Alexandra Fulford
 
Satta Matka Dpboss Kalyan Matka Results Kalyan Chart
Satta Matka Dpboss Kalyan Matka Results Kalyan ChartSatta Matka Dpboss Kalyan Matka Results Kalyan Chart
Satta Matka Dpboss Kalyan Matka Results Kalyan Chart
Satta Matka Dpboss Kalyan Matka Results
 
Profiles of Iconic Fashion Personalities.pdf
Profiles of Iconic Fashion Personalities.pdfProfiles of Iconic Fashion Personalities.pdf
Profiles of Iconic Fashion Personalities.pdf
TTop Threads
 
Best Competitive Marble Pricing in Dubai - ☎ 9928909666
Best Competitive Marble Pricing in Dubai - ☎ 9928909666Best Competitive Marble Pricing in Dubai - ☎ 9928909666
Best Competitive Marble Pricing in Dubai - ☎ 9928909666
Stone Art Hub
 
Digital Transformation Frameworks: Driving Digital Excellence
Digital Transformation Frameworks: Driving Digital ExcellenceDigital Transformation Frameworks: Driving Digital Excellence
Digital Transformation Frameworks: Driving Digital Excellence
Operational Excellence Consulting
 
Part 2 Deep Dive: Navigating the 2024 Slowdown
Part 2 Deep Dive: Navigating the 2024 SlowdownPart 2 Deep Dive: Navigating the 2024 Slowdown
Part 2 Deep Dive: Navigating the 2024 Slowdown
jeffkluth1
 
Kirill Klip GEM Royalty TNR Gold Copper Presentation
Kirill Klip GEM Royalty TNR Gold Copper PresentationKirill Klip GEM Royalty TNR Gold Copper Presentation
Kirill Klip GEM Royalty TNR Gold Copper Presentation
Kirill Klip
 
DearbornMusic-KatherineJasperFullSailUni
DearbornMusic-KatherineJasperFullSailUniDearbornMusic-KatherineJasperFullSailUni
DearbornMusic-KatherineJasperFullSailUni
katiejasper96
 
How are Lilac French Bulldogs Beauty Charming the World and Capturing Hearts....
How are Lilac French Bulldogs Beauty Charming the World and Capturing Hearts....How are Lilac French Bulldogs Beauty Charming the World and Capturing Hearts....
How are Lilac French Bulldogs Beauty Charming the World and Capturing Hearts....
Lacey Max
 
Call8328958814 satta matka Kalyan result satta guessing
Call8328958814 satta matka Kalyan result satta guessingCall8328958814 satta matka Kalyan result satta guessing
Call8328958814 satta matka Kalyan result satta guessing
➑➌➋➑➒➎➑➑➊➍
 
Satta Matka Dpboss Kalyan Matka Results Kalyan Chart
Satta Matka Dpboss Kalyan Matka Results Kalyan ChartSatta Matka Dpboss Kalyan Matka Results Kalyan Chart
Satta Matka Dpboss Kalyan Matka Results Kalyan Chart
Satta Matka Dpboss Kalyan Matka Results
 
Kirill Klip GEM Royalty TNR Gold Lithium Presentation
Kirill Klip GEM Royalty TNR Gold Lithium PresentationKirill Klip GEM Royalty TNR Gold Lithium Presentation
Kirill Klip GEM Royalty TNR Gold Lithium Presentation
Kirill Klip
 
list of states and organizations .pdf
list of  states  and  organizations .pdflist of  states  and  organizations .pdf
list of states and organizations .pdf
Rbc Rbcua
 
Lundin Gold Corporate Presentation - June 2024
Lundin Gold Corporate Presentation - June 2024Lundin Gold Corporate Presentation - June 2024
Lundin Gold Corporate Presentation - June 2024
Adnet Communications
 
Cover Story - China's Investment Leader - Dr. Alyce SU
Cover Story - China's Investment Leader - Dr. Alyce SUCover Story - China's Investment Leader - Dr. Alyce SU
Cover Story - China's Investment Leader - Dr. Alyce SU
msthrill
 
Dpboss Matka Guessing Satta Matta Matka Kalyan Chart Indian Matka
Dpboss Matka Guessing Satta Matta Matka Kalyan Chart Indian MatkaDpboss Matka Guessing Satta Matta Matka Kalyan Chart Indian Matka
Dpboss Matka Guessing Satta Matta Matka Kalyan Chart Indian Matka
➒➌➎➏➑➐➋➑➐➐Dpboss Matka Guessing Satta Matka Kalyan Chart Indian Matka
 
NIMA2024 | De toegevoegde waarde van DEI en ESG in campagnes | Nathalie Lam |...
NIMA2024 | De toegevoegde waarde van DEI en ESG in campagnes | Nathalie Lam |...NIMA2024 | De toegevoegde waarde van DEI en ESG in campagnes | Nathalie Lam |...
NIMA2024 | De toegevoegde waarde van DEI en ESG in campagnes | Nathalie Lam |...
BBPMedia1
 
The Genesis of BriansClub.cm Famous Dark WEb Platform
The Genesis of BriansClub.cm Famous Dark WEb PlatformThe Genesis of BriansClub.cm Famous Dark WEb Platform
The Genesis of BriansClub.cm Famous Dark WEb Platform
SabaaSudozai
 
Satta Matka Dpboss Matka Guessing Kalyan Chart Indian Matka Kalyan panel Chart
Satta Matka Dpboss Matka Guessing Kalyan Chart Indian Matka Kalyan panel ChartSatta Matka Dpboss Matka Guessing Kalyan Chart Indian Matka Kalyan panel Chart
Satta Matka Dpboss Matka Guessing Kalyan Chart Indian Matka Kalyan panel Chart
➒➌➎➏➑➐➋➑➐➐Dpboss Matka Guessing Satta Matka Kalyan Chart Indian Matka
 
TIMES BPO: Business Plan For Startup Industry
TIMES BPO: Business Plan For Startup IndustryTIMES BPO: Business Plan For Startup Industry
TIMES BPO: Business Plan For Startup Industry
timesbpobusiness
 

Recently uploaded (20)

Business storytelling: key ingredients to a story
Business storytelling: key ingredients to a storyBusiness storytelling: key ingredients to a story
Business storytelling: key ingredients to a story
 
Satta Matka Dpboss Kalyan Matka Results Kalyan Chart
Satta Matka Dpboss Kalyan Matka Results Kalyan ChartSatta Matka Dpboss Kalyan Matka Results Kalyan Chart
Satta Matka Dpboss Kalyan Matka Results Kalyan Chart
 
Profiles of Iconic Fashion Personalities.pdf
Profiles of Iconic Fashion Personalities.pdfProfiles of Iconic Fashion Personalities.pdf
Profiles of Iconic Fashion Personalities.pdf
 
Best Competitive Marble Pricing in Dubai - ☎ 9928909666
Best Competitive Marble Pricing in Dubai - ☎ 9928909666Best Competitive Marble Pricing in Dubai - ☎ 9928909666
Best Competitive Marble Pricing in Dubai - ☎ 9928909666
 
Digital Transformation Frameworks: Driving Digital Excellence
Digital Transformation Frameworks: Driving Digital ExcellenceDigital Transformation Frameworks: Driving Digital Excellence
Digital Transformation Frameworks: Driving Digital Excellence
 
Part 2 Deep Dive: Navigating the 2024 Slowdown
Part 2 Deep Dive: Navigating the 2024 SlowdownPart 2 Deep Dive: Navigating the 2024 Slowdown
Part 2 Deep Dive: Navigating the 2024 Slowdown
 
Kirill Klip GEM Royalty TNR Gold Copper Presentation
Kirill Klip GEM Royalty TNR Gold Copper PresentationKirill Klip GEM Royalty TNR Gold Copper Presentation
Kirill Klip GEM Royalty TNR Gold Copper Presentation
 
DearbornMusic-KatherineJasperFullSailUni
DearbornMusic-KatherineJasperFullSailUniDearbornMusic-KatherineJasperFullSailUni
DearbornMusic-KatherineJasperFullSailUni
 
How are Lilac French Bulldogs Beauty Charming the World and Capturing Hearts....
How are Lilac French Bulldogs Beauty Charming the World and Capturing Hearts....How are Lilac French Bulldogs Beauty Charming the World and Capturing Hearts....
How are Lilac French Bulldogs Beauty Charming the World and Capturing Hearts....
 
Call8328958814 satta matka Kalyan result satta guessing
Call8328958814 satta matka Kalyan result satta guessingCall8328958814 satta matka Kalyan result satta guessing
Call8328958814 satta matka Kalyan result satta guessing
 
Satta Matka Dpboss Kalyan Matka Results Kalyan Chart
Satta Matka Dpboss Kalyan Matka Results Kalyan ChartSatta Matka Dpboss Kalyan Matka Results Kalyan Chart
Satta Matka Dpboss Kalyan Matka Results Kalyan Chart
 
Kirill Klip GEM Royalty TNR Gold Lithium Presentation
Kirill Klip GEM Royalty TNR Gold Lithium PresentationKirill Klip GEM Royalty TNR Gold Lithium Presentation
Kirill Klip GEM Royalty TNR Gold Lithium Presentation
 
list of states and organizations .pdf
list of  states  and  organizations .pdflist of  states  and  organizations .pdf
list of states and organizations .pdf
 
Lundin Gold Corporate Presentation - June 2024
Lundin Gold Corporate Presentation - June 2024Lundin Gold Corporate Presentation - June 2024
Lundin Gold Corporate Presentation - June 2024
 
Cover Story - China's Investment Leader - Dr. Alyce SU
Cover Story - China's Investment Leader - Dr. Alyce SUCover Story - China's Investment Leader - Dr. Alyce SU
Cover Story - China's Investment Leader - Dr. Alyce SU
 
Dpboss Matka Guessing Satta Matta Matka Kalyan Chart Indian Matka
Dpboss Matka Guessing Satta Matta Matka Kalyan Chart Indian MatkaDpboss Matka Guessing Satta Matta Matka Kalyan Chart Indian Matka
Dpboss Matka Guessing Satta Matta Matka Kalyan Chart Indian Matka
 
NIMA2024 | De toegevoegde waarde van DEI en ESG in campagnes | Nathalie Lam |...
NIMA2024 | De toegevoegde waarde van DEI en ESG in campagnes | Nathalie Lam |...NIMA2024 | De toegevoegde waarde van DEI en ESG in campagnes | Nathalie Lam |...
NIMA2024 | De toegevoegde waarde van DEI en ESG in campagnes | Nathalie Lam |...
 
The Genesis of BriansClub.cm Famous Dark WEb Platform
The Genesis of BriansClub.cm Famous Dark WEb PlatformThe Genesis of BriansClub.cm Famous Dark WEb Platform
The Genesis of BriansClub.cm Famous Dark WEb Platform
 
Satta Matka Dpboss Matka Guessing Kalyan Chart Indian Matka Kalyan panel Chart
Satta Matka Dpboss Matka Guessing Kalyan Chart Indian Matka Kalyan panel ChartSatta Matka Dpboss Matka Guessing Kalyan Chart Indian Matka Kalyan panel Chart
Satta Matka Dpboss Matka Guessing Kalyan Chart Indian Matka Kalyan panel Chart
 
TIMES BPO: Business Plan For Startup Industry
TIMES BPO: Business Plan For Startup IndustryTIMES BPO: Business Plan For Startup Industry
TIMES BPO: Business Plan For Startup Industry
 

Man Acc KNUST lecture 2 break even analysis.ppt

  • 1. ACC 557: MANAGEMENT ACCOUNTING Cost-Volume-profit analysis (Break-even analysis) Compiled by Kwame Oduro Amoako (Ph.D.) 23/08/2023 Kwame Oduro Amoako (PhD)
  • 2. Aims for today • To understand what break even means •How it can be used to assist businesses in their planning 23/08/2023 Kwame Oduro Amoako (PhD)
  • 3. What does break even mean? • Break even is where a firms TOTAL REVENUE is the same as its TOTAL COSTS • At the break even point, a firm is neither making a PROFIT nor A LOSS Kwame Oduro Amoako (PhD) 23/08/2023
  • 4. Break-even analysis? • A break-even analysis is a useful tool for determining at what point your company, or a new product or service, will be profitable. • Put another way, it's a financial calculation used to determine the number of products or services you need to sell to at least cover your costs. • The break even analysis is important to business owners and managers in determining how many units (or revenues) are needed to cover fixed and variable expenses of the business. 23/08/2023 Kwame Oduro Amoako (PhD)
  • 5. Uses of break-even analysis Break-even analysis enables a business organization to: • Measure profit and losses at different levels of production and sales. • Predict the effect of changes in sales prices on quantities to be sold. • Analyze the relationship between fixed and variable costs. • Predict the effect of cost and efficiency changes on profitability. 23/08/2023 Kwame Oduro Amoako (PhD)
  • 6. Assumptions of break-even • All costs are divided into fixed and variable costs. • Fixed costs will remain constant and will not change according to the level of production. • Variable costs will change in direct proportion according to the level of production. • Selling price remain constant even though there exists competition or any change in the volume of production. • The number of units of production is equal to sales. It means that there is no opening or closing stock. • The operating efficiency of the company remains the same. • There is only one product or product mix in the case of many products will remain unchanged. 23/08/2023 Kwame Oduro Amoako (PhD)
  • 7. Limitation of break even analysis • Break-even analysis is based on the assumption that all costs and expenses can be clearly separated into fixed and variable components. • It assumes that fixed costs remain constant at all levels of activity. It should be noted that fixed costs tend to vary beyond a certain level of activity. • It assumes that variable costs vary proportionately with the volume of output is not true. • The assumption that selling price remains unchanged gives a straight revenue line which may not be true. • The assumption that only one product is produced or that product mix will remain unchanged is difficult to find in practice. • It assumes that the business conditions may not change which is not true. 23/08/2023 Kwame Oduro Amoako (PhD)
  • 8. Methods of conducting break even analysis • Graphical method • Use of contribution margin method • Use of equation method 23/08/2023 Kwame Oduro Amoako (PhD)
  • 9. Task 2: Draw the break even chart using your data 1. Label the vertical axis “sales and costs in pounds”. 2. Label the horizontal axis “sales/production (units)”. 3. Draw on the BE point 4. Draw a horizontal line for total fixed costs. 5. Starting at the Total costs point, draw the total cost line going through the break even point. 6. Starting at zero, draw the total revenue line through the break even. 7. Where the sales revenue crosses the total costs line is the break even point. 8. Read off the units of sales to give the break even level of sales. 9. The gap between the total costs line and sales revenue line after the break even point represents the level of profit. Kwame Oduro Amoako (PhD) 23/08/2023
  • 10. Graphical method of Breakeven GH¢ Units Sold 23/08/2023 Kwame Oduro Amoako (PhD)
  • 11. Graphic method of Breakeven 0 500 1000 1500 2000 2500 3000 3500 4000 4500 5000 0 25 50 75 100 125 150 Fixed Cost Revenue Units Sold GH¢ 23/08/2023 Kwame Oduro Amoako (PhD)
  • 12. Graphic method of Breakeven 0 500 1000 1500 2000 2500 3000 3500 4000 4500 5000 0 25 50 75 100 125 150 Fixed Cost Total Cost Revenue Units Sold GH¢ 23/08/2023 Kwame Oduro Amoako (PhD)
  • 13. Graphic method of Breakeven 0 500 1000 1500 2000 2500 3000 3500 4000 4500 5000 0 25 50 75 100 125 150 Fixed Cost Total Cost Revenue GH¢ Units Sold 23/08/2023 Kwame Oduro Amoako (PhD)
  • 14. 23/08/2023 Kwame Oduro Amoako (PhD)
  • 15. Calculating the break even point Kwame Oduro Amoako (PhD) Step 1. Identify fixed & variable costs – add them together to get the TOTAL costs Step 2. Calculate the TOTAL REVENUE 23/08/2023
  • 16. Task 1: Calculating break even Kwame Oduro Amoako (PhD) • Use the following to complete the table: • FC=GH¢2000 • VC=GH¢2 per unit • Selling price=GH¢4 23/08/2023
  • 17. Task 1: Calculating break even 23/08/2023 Kwame Oduro Amoako (PhD)
  • 18. The break even chart Kwame Oduro Amoako (PhD) 23/08/2023
  • 19. Margin of safety formula • The difference between the planned number of units or actual sales and the number of units of sales at break even point. • From the table and chart They can make: • 2,000 units potentially – 1,000 actual units at break even • = 1,000 units Margin of safety 23/08/2023 Kwame Oduro Amoako (PhD)
  • 20. Task 3: Draw the margin of safety Kwame Oduro Amoako (PhD) 23/08/2023
  • 21. Self test • KFC operate a hot dog stand in their branch at Bekwai Roundabout. • The wages at the stand costs GH¢200 per week. Each hot dog needs one bread roll at 20p, one sausage at 25p and sauces at 5p. • The selling price of each hot dog is GH¢1 23/08/2023 Kwame Oduro Amoako (PhD)
  • 22. Complete the table At what quantity do total costs = total revenue? (Break even) What profit is made when they sell 600 hot dogs? QUANTITY FIXED COSTS VARIABLE COSTS TOTAL COSTS TOTAL REVENUE PROFIT OR LOSS? 100 150 200 250 300 350 400 450 500 550 600 650 23/08/2023 Kwame Oduro Amoako (PhD)
  • 23. Complete the table At what quantity do total costs = total revenue? (Break even) What profit is made when they sell 600 hot dogs? QUANTITY FIXED COSTS VARIABLE COSTS TOTAL COSTS TOTAL REVENUE PROFIT OR LOSS? 100 200 50 250 100 -150 150 200 75 275 150 -125 200 200 100 300 200 -100 250 200 125 325 250 -75 300 200 150 350 300 -50 350 200 175 375 350 -25 400 200 200 400 400 0 450 200 225 425 450 25 500 200 250 450 500 50 550 200 275 475 550 75 600 200 300 500 600 100 650 200 325 525 650 125 23/08/2023 Kwame Oduro Amoako (PhD)
  • 24. Next task 1. Draw a Break Even chart for the Hot Dog business - Ensure your chart is FULLY and CLEARLY labelled 2. Draw on the margin of safety 3. Explain how the Break even analysis will help Grace and Joe 4. Discuss what strategies Grace and Joe could use to enable them to reach their break even point quicker 5. Evaluate which of these strategies would be best for the business 23/08/2023 Kwame Oduro Amoako (PhD)
  • 25. Break even formulae approach 23/08/2023 Kwame Oduro Amoako (PhD)
  • 26. Contribution Margin • One of the key relationships in CVP analysis is contribution margin (CM). • Contribution margin is the remaining of a product price after deducting variable cost per unit. • Contribution margin is a product's price minus all associated variable costs, resulting in the incremental profit earned for each unit sold. • The total contribution margin generated by an entity represents the total earnings available to pay for fixed expenses and to generate a profit • The CM is then available to cover fixed costs and to contribute income for the company. 23/08/2023 Kwame Oduro Amoako (PhD)
  • 27. Unit Contribution Margin Views differ as to the best way to express contribution margin (CM). Some favor a per unit basis. • At Kuma Wood Videos, the contribution margin is GH¢2. Unit Selling Price Unit Variable Cost Contribution Margin - = GH¢5 GH¢3 GH¢2 - =  CM per unit indicates that for every CD sold, Kuma Wood Video will have GH¢200 to cover fixed costs and contribute to income. 23/08/2023 Kwame Oduro Amoako (PhD)
  • 28. Contribution Margin • For example, assume that Kumawood Video sells 100,000 CDs in one month, • sales are GH¢500,000 (100,000 x GH¢5) and • variable costs are GH¢300,000 (100,000 x GH¢3). • Thus, total contribution is GH¢200,000, computed as follows: Sales Variable Costs Contribution - = GH¢500,000 GH¢300,000 GH¢200,000 - = 23/08/2023 Kwame Oduro Amoako (PhD)
  • 29. Contribution Margin Ratio Others prefer to use a contribution margin ratio. • At Kuma Wood Video, the contribution margin ratio is 40%. Contribution Margin per Unit Unit Selling Price Contribution Margin Ratio  = GH¢2 GH¢5 40%  =  The CM ratio means that 40 cents of each sales dollar (GH¢1 x 40%) is available to apply to fixed costs and to contribute to income. 23/08/2023 Kwame Oduro Amoako (PhD)
  • 30. Break even formulae approach • Break-even point (in units) = Fixed Costs Contribution/unit • Break-even point (in sales value) = Fixed Costs x S.P Contribution/unit OR Break-even point (in units) x Selling price OR = Fixed Costs x 1 C/S ratio • C/S ratio = Contribution/unit x 100 Sales price per unit 23/08/2023 Kwame Oduro Amoako (PhD)
  • 31. Break even formulae approach cont’d • Level of sales to result in target profit (in units) = Fixed Costs + Target Profit Contribution/unit • Level of sales to result in target profit (in sales value) = Fixed Costs + Target Profit x Sales Price/unit Contribution per unit • Level of sales to result in target profit after tax (units) 23/08/2023 Kwame Oduro Amoako (PhD)
  • 32. Break even formulae approach cont’d • Margin of Safety in units = Total Profit Contribution/unit • Margin of Safety in sales value = Total Sales – Break-even point in sales. OR Total Profit C/S ratio 23/08/2023 Kwame Oduro Amoako (PhD)
  • 33. Illustration 1 A company makes a single product with a sales price of GH¢10 and a marginal cost of GH¢6. Fixed costs are GH¢60,000 p.a. Calculate: a) Contribution per unit b) Number of units to break even. c) Sales at break-even point. d) C/S ratio e) What number of units will need to be sold to achieve a profit of GH¢20,000 p.a. f) What level of sales will achieve a profit of GH¢20,000 p.a. g) If the taxation rate is 40% how many units will need to be sold to make a profit after tax of GH¢20,000 p.a.? h) Because of increasing costs the marginal cost is expected to rise to GH¢6.50 per unit and fixed costs to GH¢70,000 p.a. If the selling price cannot be increased what will be the number of units required to maintain a profit of GH¢20,000 p.a.? (Ignore tax). 23/08/2023 Kwame Oduro Amoako (PhD)
  • 34. Solution (a)Contribution per unit = Selling price per unit – Variable Cost = GH ¢10 - GH¢6 = GH¢4 (b) Break-even point (in units) = GH¢60,000 GH¢4 = 15,000 units (c) Break-even point (in sales value) = GH¢60,000 x GH ¢10 GH¢4 = GH¢150,000 (d) C/S ratio = GH¢4 x 100 GH¢10 = 40% 23/08/2023 Kwame Oduro Amoako (PhD)
  • 35. Solution cont’d (e) Number of units for target profit = GH¢60,000 + GH¢20,000 GH¢4 = 20,000 units (f) Sales for target profit = GH¢60,000 + GH¢20,000 x GH¢10 GH¢4 =GH¢200,000 (g) Number of units for target profit after tax =GH¢ 60,000+GH¢20,000 1-0.4 GH¢4 =23,333 unit (h) Number of units for target profit = GH¢70,000 + GH¢20,000 GH¢3.50 = 25,714 units 23/08/2023 Kwame Oduro Amoako (PhD)
  • 36. Home work 23/08/2023 Kwame Oduro Amoako (PhD)
  • 37. Sales Mix Break-even Point • Sales mix is the proportion in which two or more products are sold. • For the calculation of break-even point for sales mix, following assumptions are made in addition to those already made for CVP analysis: • The proportion of sales mix must be predetermined. • The sales mix must not change within the relevant time period. 23/08/2023 Kwame Oduro Amoako (PhD)
  • 38. Sales Mix Break-even Point • The calculation method for the break-even point of sales mix is based on the contribution approach method. • Since we have multiple products in sales mix therefore it is most likely that we will be dealing with products with different contribution margin per unit and contribution margin ratios. • This problem is overcome by calculating weighted average contribution margin per unit and contribution margin ratio. • These are then used to calculate the break-even point for sales mix. 23/08/2023 Kwame Oduro Amoako (PhD)
  • 39. Illustration: Following information is related to sales mix of product A, B and C. Calculate the break-even point in units and in dollars. Product A B C Sales Price per Unit GH¢15 GH¢21 GH¢36 Variable Cost per Unit GH¢9 GH¢14 GH¢19 Sales Mix Percentage 20% 20% 60% Total Fixed Cost GH¢40,000 23/08/2023 Kwame Oduro Amoako (PhD)
  • 40. Solution Step 1: Calculate the contribution margin Product A B C Sales Price per Unit GH¢15 GH¢21 GH¢36 − Variable Cost per Unit GH¢9 GH¢14 GH¢19 Contribution Margin per Unit GH¢6 GH¢7 GH¢17 23/08/2023 Kwame Oduro Amoako (PhD)
  • 41. Solution cont’d Step 2 Calculate the weighted-average contribution margin per unit for the sales mix using the following formula: • Product A CM per Unit × Product A Sales Mix Percentage + Product B CM per Unit × Product B Sales Mix Percentage + Product C CM per Unit × Product C Sales Mix Percentage = Weighted Average Unit Contribution Margin 23/08/2023 Kwame Oduro Amoako (PhD)
  • 42. Solution cont’d: Step 2 Product A B C Sales Price per Unit GH¢15 GH¢21 GH¢36 − Variable Cost per Unit GH¢9 GH¢14 GH¢19 Contribution Margin per Unit GH¢6 GH¢7 GH¢17 × Sales Mix Percentage 20% 20% 60% Weighted contribution per unit GH¢1.2 GH¢1.4 GH¢10.2 Sum: Weighted Average CM per Unit GH¢12.80 23/08/2023 Kwame Oduro Amoako (PhD)
  • 43. step 3: Calculate total units of sales mix required to break-even using the formula: Break-even Point in Units of Sales Mix = Total Fixed Cost ÷ Weighted Average CM per Unit Total Fixed Cost GH¢40,000 ÷ Weighted Average CM per Unit GH¢12.80 Break-even Point in Units of Sales Mix 3,125 23/08/2023 Kwame Oduro Amoako (PhD)
  • 44. Step 4: Calculate the number units of product A, B and C at break-even point: Product A B C Sales Mix Ratio 20% 20% 60% × Total Break-even Units 3,125 3,125 3,125 Product Units at Break- even Point 625 625 1,875 23/08/2023 Kwame Oduro Amoako (PhD)
  • 45. Step 5: Calculate Break-even Point in dollars as follows: Product A B C Product Units at Break-even Point 625 625 1,875 × Price per Unit GH¢15 GH¢21 GH¢36 Product Sales in Dollars GH¢9,375 GH¢13,125 GH¢67,500 Sum: Break-even Point in Dollars GH¢90,000 23/08/2023 Kwame Oduro Amoako (PhD)
  • 46. Self test in class 23/08/2023 Kwame Oduro Amoako (PhD)
  • 47. Self test: Solution Weighted average selling price: = (GH¢200 × 20%) + (GH¢100 × 30%) + (GH¢50 × 50%) = GH¢40 + GH¢30 + GH¢25 = GH¢95 Weighted average variable expenses: = (GH¢100 × 20%) + (GH¢75 × 30%) + (GH¢25 × 50%) = GH¢20 + 22.50 + 12.50 = GH¢55 The company will have to sell 1,250 units to break-even. Now I would compute the number of units of each product to be sold: Product X (1,250 × 20%): 250 units Product Y (1,250 × 30%): 375 units Product Z (1,250 × 50%): 625 units Total: 250 units + 375 units + 625 units = 1,250 units 23/08/2023 Kwame Oduro Amoako (PhD)
  • 48. Alternatively: Fast track • You can also use the break even formula: 23/08/2023 Kwame Oduro Amoako (PhD)
  • 49. Self test: Solution cont’d 23/08/2023 Kwame Oduro Amoako (PhD)
  • 50. • As the number of units of each individual product to be sold have been computed, I can compute the break-even point in dollars as follows: • Product X (250 units x 200) 50,000 • Product Y (375 units x 100) 37,500 • Product Z (625 units x 50) 31,250 • Break even point in cedis 118,750 23/08/2023 Kwame Oduro Amoako (PhD)

Editor's Notes

  1. Activity Step 3 Identify key variables in the breakeven equation. Identify the lines on the graph. The purple line represents revenue. Revenue when zero units are sold is zero dollars.
  2. Activity Step 3 Identify key variables in the breakeven equation. (cont’d) Identify the lines on the graph. The blue line represents fixed cost. FC, by definition, remains the same regardless of number of units sold
  3. Activity Step 3 Identify key variables in the breakeven equation. (cont’d) Identify the lines on the graph. The green line represents total cost, which is the sum of VC and FC.
  4. Activity Step 3 Identify key variables in the breakeven equation. Identify the lines on the graph. The Point at which Total Cost and Revenue intersect (are equal) is the point at which profit = zero
  5. 9
  6. 9
  7. 9