Downloaded 14 times

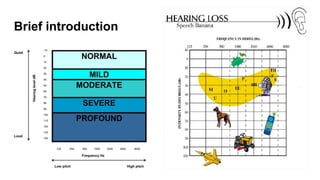
![Brief introduction
Etiology:
Hereditary, diseases and infections, intense noise exposure, ototoxic medicines,
aging and others…
Classification according to when the deafness occurred:
pre-lingual
post-lingual
Obstacle to the social development in relation to the family and community [1]](https://image.slidesharecdn.com/fmridtideafnessipem2016-190507174340/85/Brain-structural-connectivity-and-functional-default-mode-network-in-deafness-4-320.jpg)
![Sign Language
There are several studies showing that the sign language naturally developed as a
common communication method in groups of deaf individuals and presents the
same linguistics properties as the oral communication [2].
Examples of sign languages: American Sign Language (ASL), British Sign
Language (BSL) and Brazilian Sign Language (LIBRAS)](https://image.slidesharecdn.com/fmridtideafnessipem2016-190507174340/85/Brain-structural-connectivity-and-functional-default-mode-network-in-deafness-5-320.jpg)
![MRI and deafness
Basically, functional MRI has been widely used to the study of language and
motion processing, regarding the brain adaptation with the sign language
communication [3,4].
Figure: Example of activations in
motion-related areas for one deaf and
one hearing participant. Adapted from
[3].](https://image.slidesharecdn.com/fmridtideafnessipem2016-190507174340/85/Brain-structural-connectivity-and-functional-default-mode-network-in-deafness-6-320.jpg)
![Resting state networks Adapted from [5]](https://image.slidesharecdn.com/fmridtideafnessipem2016-190507174340/85/Brain-structural-connectivity-and-functional-default-mode-network-in-deafness-8-320.jpg)
![Resting state networks Adapted from [5]](https://image.slidesharecdn.com/fmridtideafnessipem2016-190507174340/85/Brain-structural-connectivity-and-functional-default-mode-network-in-deafness-9-320.jpg)
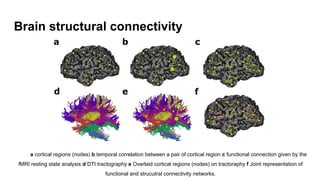
![Brain structural connectivity
Functional connectivity reflects structural
connectivity in the DMN.
a DMN.
b DTI fiber tractography in a single subject
demonstrates the cingulum bundle (blue
tracts) connecting the PCC/RSC to the
MPFC. The yellow tracts connect the bilateral
MTL to the PCC/RSC.
c Schematic representation of the structural
and functional connections between these
three nodes of the DMN.
Adapted from [6].](https://image.slidesharecdn.com/fmridtideafnessipem2016-190507174340/85/Brain-structural-connectivity-and-functional-default-mode-network-in-deafness-10-320.jpg)
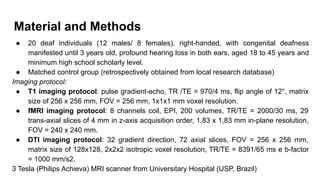
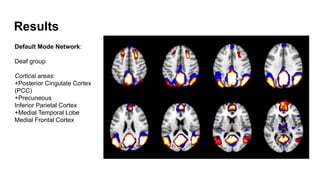
![Results
Global efficiency and
Transitivity:
Represents global network
organization regarding
integration and segregation
connectivity patterns [7]
Small-world network](https://image.slidesharecdn.com/fmridtideafnessipem2016-190507174340/85/Brain-structural-connectivity-and-functional-default-mode-network-in-deafness-16-320.jpg)
![References
[1] R. Calderon and M. Greenberg, “Social and emotional development of deaf children,” Oxford Handb. Deaf Stud,
2003.
[2] L. Petitto, “Are signed languages‘ real’ languages,” Evid. from Am. Sign Lang. Lang., 1994.
[3] D. Bavelier, C. Brozinsky, A. Tomann, T. Mitchell, H. Neville, and G. Liu, “Impact of early deafness and early exposure
to sign language on the cerebral organization for motion processing.,” 2001.
[4] H. J. Neville, D. Bavelier, D. Corina, J. Rauschecker, A. Karni, A. Lalwani, A. Braun, V. Clark, P. Jezzard, and R. Turner,
“Cerebral organization for language in deaf and hearing subjects: Biological constraints and effects of experience,”
Proc. Natl. Acad. Sci., vol. 95, no. 3, pp. 922–929, Feb. 1998.
[5] M. P. van den Heuvel and H. E. Hulshoff Pol, “Exploring the brain network: A review on resting-state fMRI
functional connectivity,” Eur. Neuropsychopharmacol., vol. 20, no. 8, pp. 519–534, 2010.
[6] J. S. Damoiseaux and M. D. Greicius, “Greater than the sum of its parts: a review of studies combining structural
connectivity and resting-state functional connectivity.,” Brain Struct. Funct., vol. 213, no. 6, pp. 525–533, 2009.
[7] M. Rubinov and O. Sporns, “Complex network measures of brain connectivity: Uses and interpretations,”
Neuroimage, vol. 52, no. 3, pp. 1059–1069, 2010.](https://image.slidesharecdn.com/fmridtideafnessipem2016-190507174340/85/Brain-structural-connectivity-and-functional-default-mode-network-in-deafness-19-320.jpg)

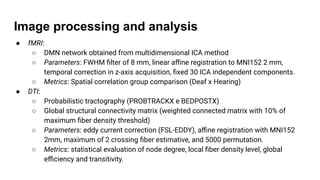
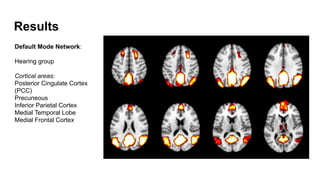
This study investigated differences in brain structural connectivity and the functional default mode network between deaf and hearing individuals using MRI. Results found increased activation in the posterior cingulate cortex, precuneus, and medial temporal lobes in the deaf group's default mode network. Analysis of structural connectivity found differences in node degree and fiber density in these areas and the motor cortex for the deaf group, suggesting neuronal plasticity related to sign language processing. Preliminary results provide new insights into brain network adaptations related to deafness and sign language use.