Download to read offline


![METHOD
HCP MEG resting state data [n=89]; preprocessed with HCP pipeline
Associated with structural MRI, 3D sensor position map, fiducials
Create single-shell conduction model [FieldTrip] + HCP structural pipeline
segment the cortical mantle [Freesurfer]
Mesh topology: 64,984 vertices/brain
Create leadfield matrix in FieldTrip, project dipole sources =10 nA.m
through leadfield to the sensors
2 different source models: source dipoles either constrained orthogonal to
individual’s cortical mantle [or were free from any anatomical constraint]](https://image.slidesharecdn.com/puceukentucky2020-201011214209/85/Puce-U-kentucky_2020-6-320.jpg)


![Interim sum up 1
Optimizing SNR in MEG studies?
No single optimal data acquisition protocol e.g. x number of trials, y
number of subjects
Consider potential activated structures in experiment: design with
adequate SNR for least detectable brain structure!
Implications analyses of functional & effective connectivity [DCM, graph
analyses]
How does this apply to EEG studies? MEG/EEG studies?](https://image.slidesharecdn.com/puceukentucky2020-201011214209/85/Puce-U-kentucky_2020-14-320.jpg)


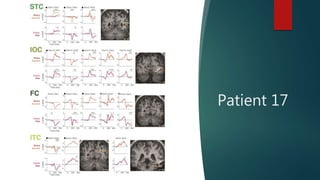
![METHOD
Existing iEEG data set with face processing task [Huijgen et al., 2015]
Localization of intracranial electrodes [MRI-based]
‘Cleaning’ of long-epochs of EEG data [n=18]; reject inter-ictal spikes [n=7]
Discard incorrect behavioral trials
Average data by condition in each site in each subject [Face 1, Face 2 etc.]
Express as bipolar activity; re-check anatomy
Normalize evoked activity
Statistical testing:
1. ID sites with evoked activity Z>1;
2. cluster-based permutation t-test against zero across time at each site [multiple
comparisons];
Visualize activity as a function of ROI](https://image.slidesharecdn.com/puceukentucky2020-201011214209/85/Puce-U-kentucky_2020-17-320.jpg)
![Paradigm
Huijgen et al, Soc Cogn Affect Neurosci 2015
Face onset
Emotion onset [happy/fearful]
Gaze aversion [or direct gaze]
Checkerboard target
[cong/incong to gaze]](https://image.slidesharecdn.com/puceukentucky2020-201011214209/85/Puce-U-kentucky_2020-18-320.jpg)


![IOC sends
information to ITC
[via ILF]
ITC communicates
with STC & FC [via
pARC]](https://image.slidesharecdn.com/puceukentucky2020-201011214209/85/Puce-U-kentucky_2020-28-320.jpg)

![Acknowledgement
George, Chaumon, Babo-Rebelo: CENIR platform at ICM in Paris; infrastructure funding from
"Investissements d’avenir" ANR-10-IAIHU-06 & ANR-11-INBS-0006
Dinkerlacker: John Bost Foundation [La Force, France]
Puce: Indiana University College of the Arts & Sciences [Sabbatical leave]
2021-2023 CR-CNS grant:
Puce PI, Pestilli Co-PI NIBIB USA; George, Chaumon Co-PIs INR France](https://image.slidesharecdn.com/puceukentucky2020-201011214209/85/Puce-U-kentucky_2020-31-320.jpg)

This document discusses two studies that aim to maximize the value of MEG/EEG data through improved experimental design and analysis methods. Study 1 uses simulations to examine how signal detectability varies across brain regions and individuals based on factors like regional position and orientation variability. Study 2 analyzes intracranial EEG data to map information flow within the face processing system, finding evidence that areas in the inferior occipital and inferior temporal cortices transfer information to other core and extended face regions via white matter pathways. Overall, the author advocates for more simulation work to optimize MEG/EEG study design and better integration of neuroimaging and connectivity methods to map information flow in the brain.


![Human Reproduction [ Reproductive System ] Notes @irfanullah_mehar Irfanullah...](https://cdn.slidesharecdn.com/ss_thumbnails/humanreproductionreproductivesystemnotesirfanullahmeharirfanullahmeharjanantantra-260111172350-56e85778-thumbnail.jpg?width=640&height=640&fit=bounds)


