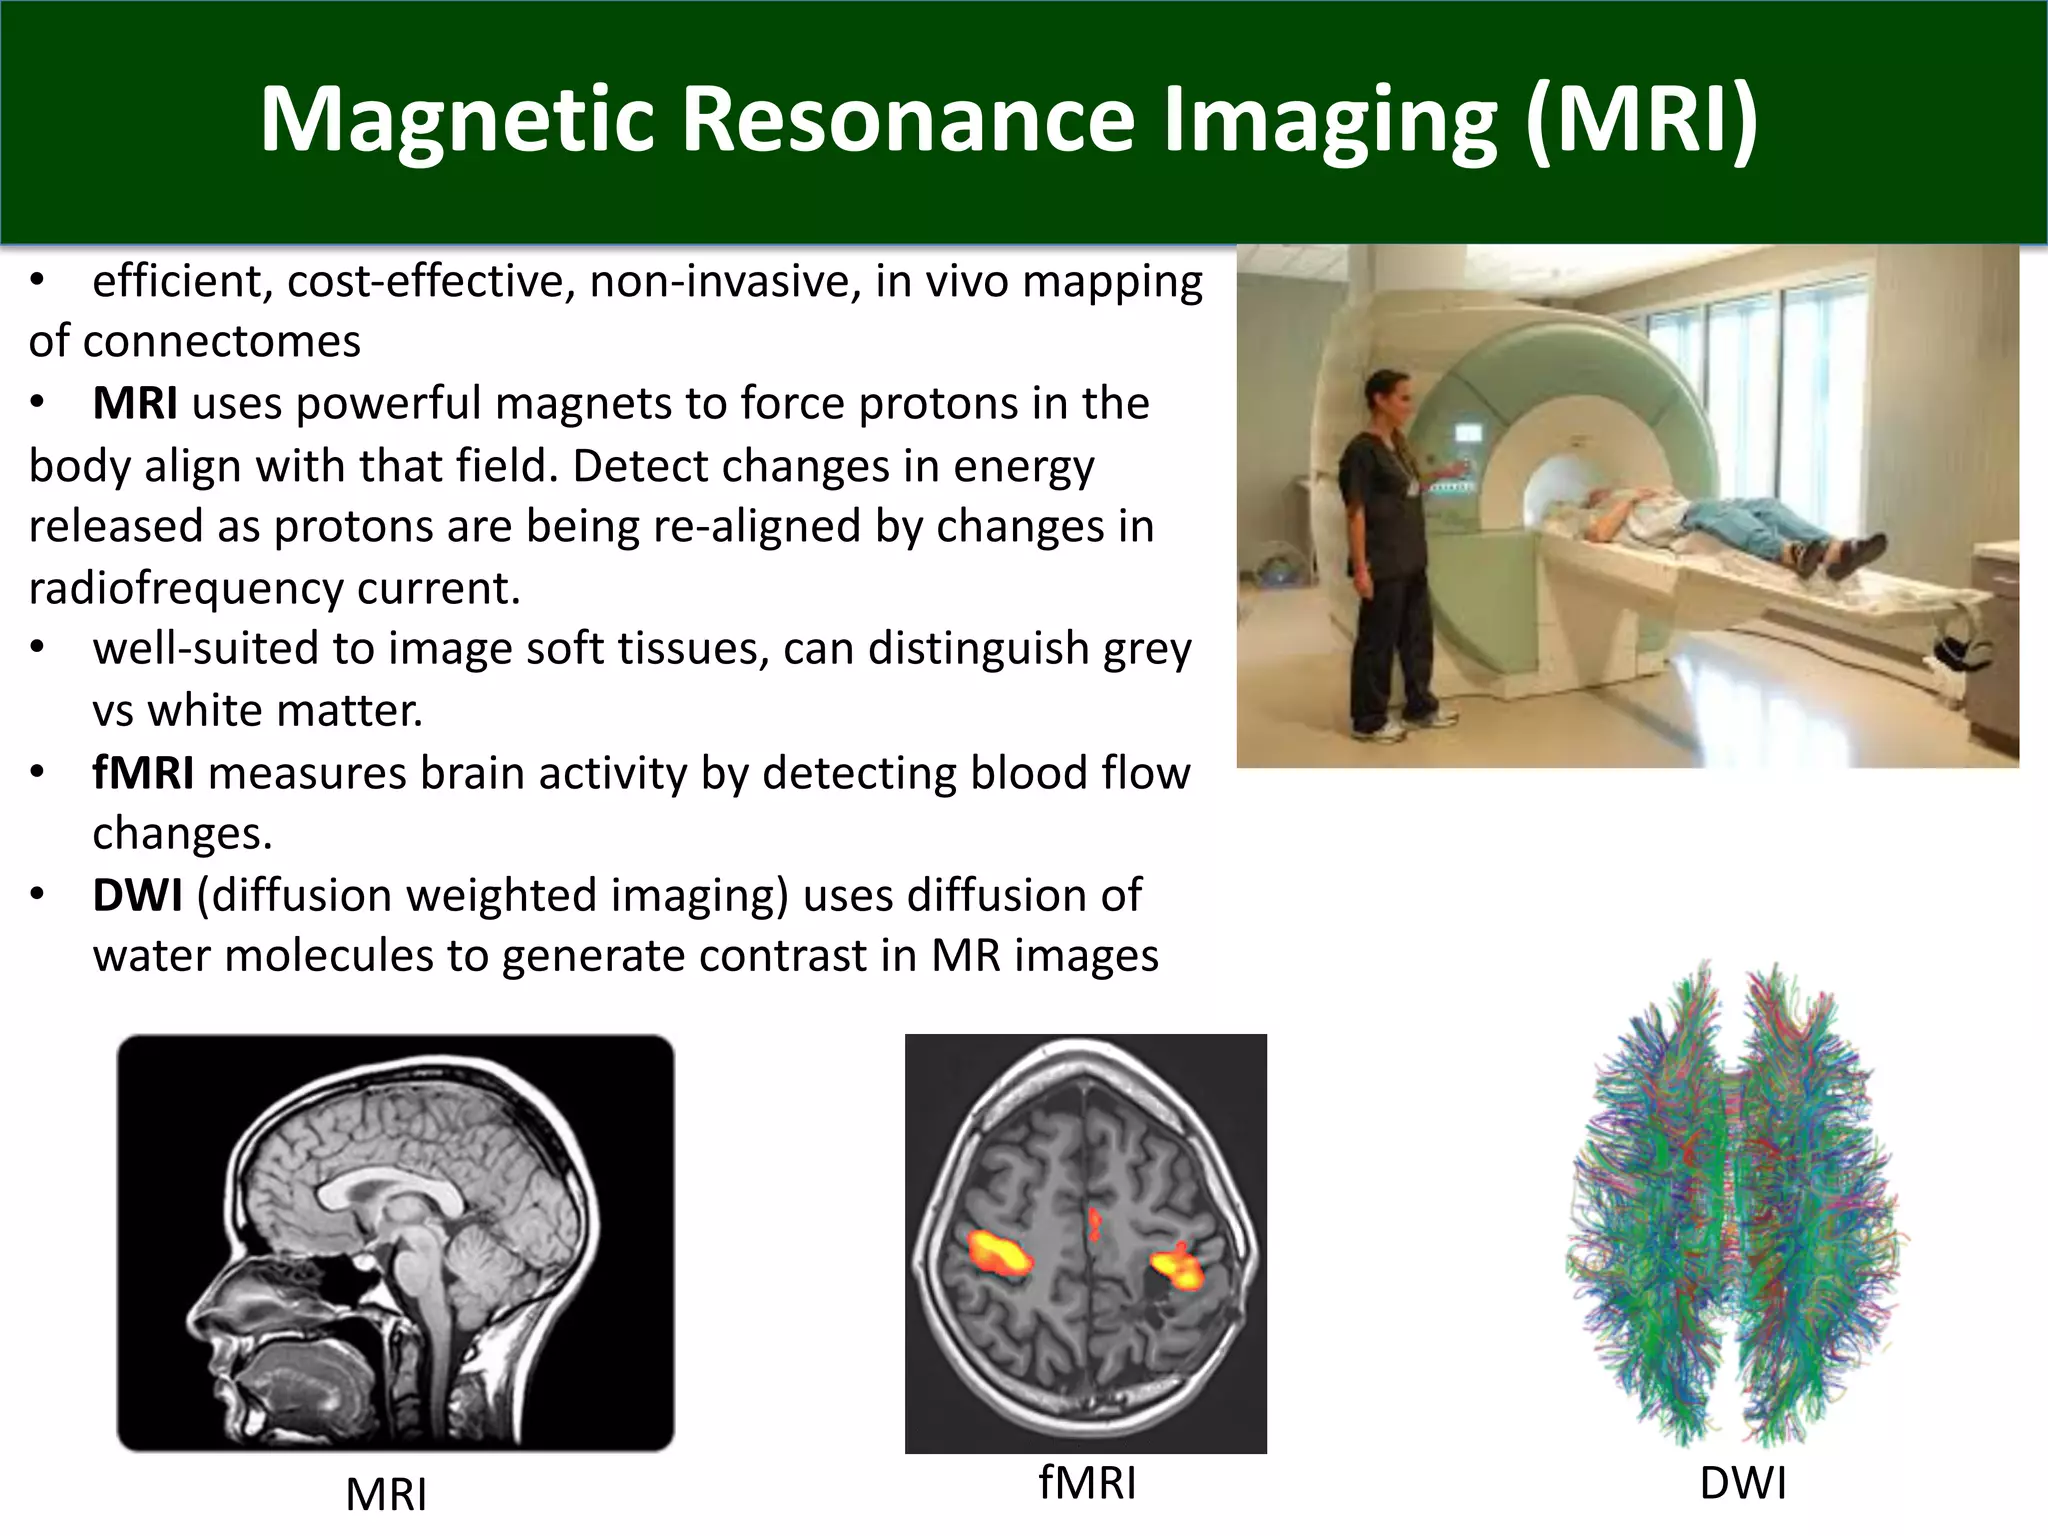
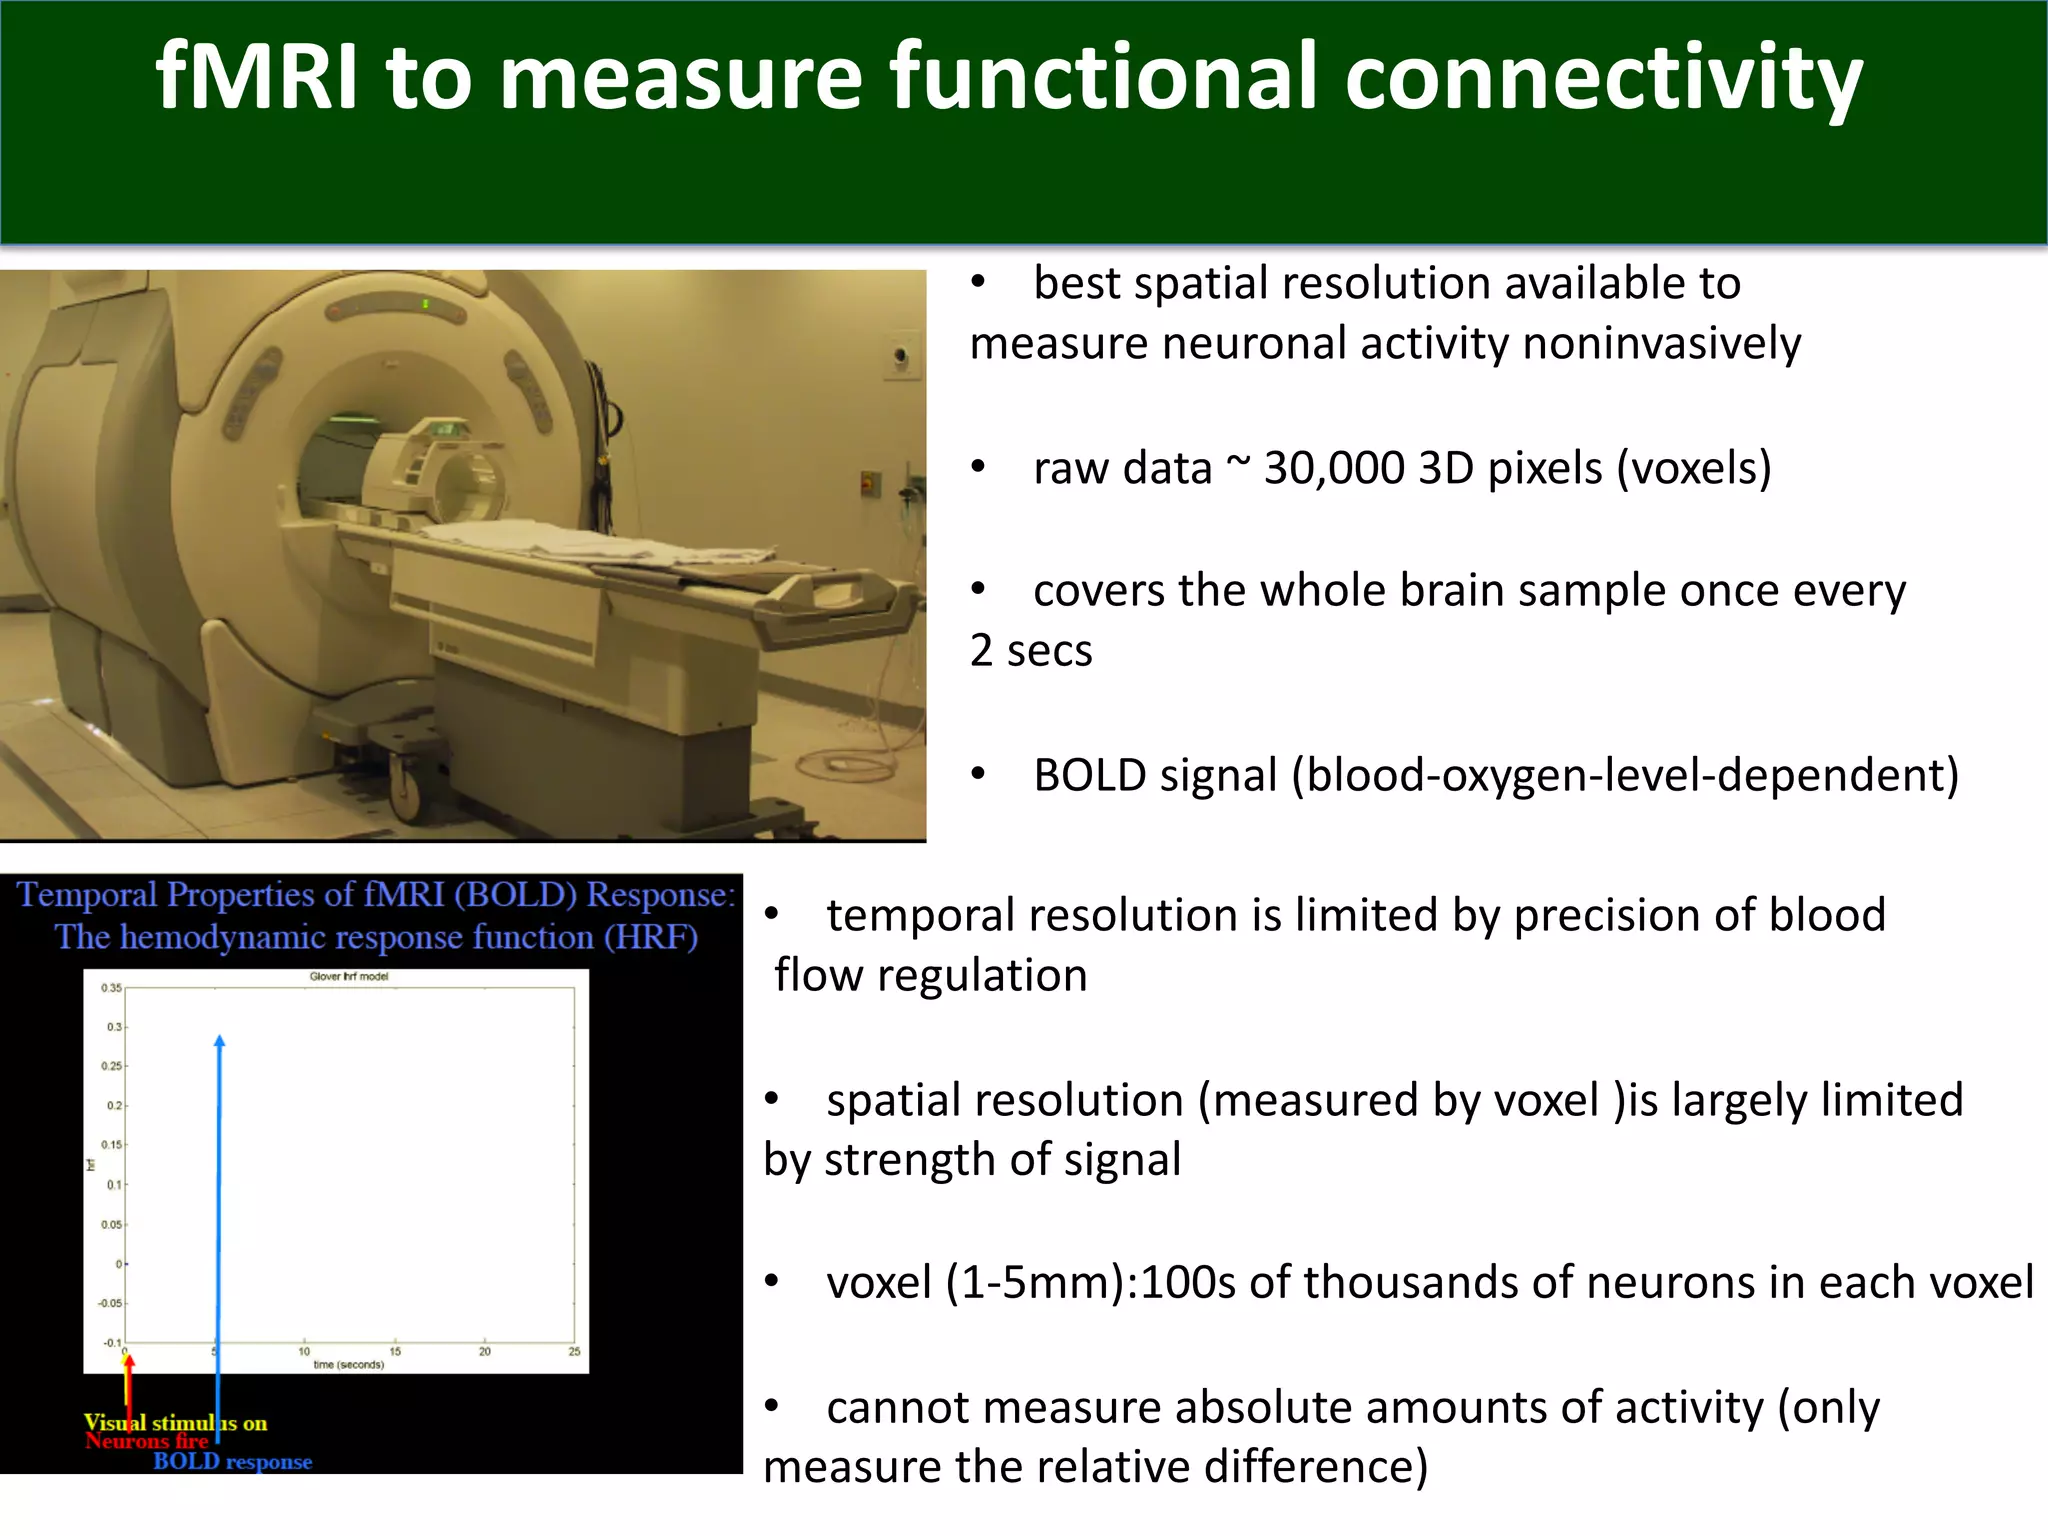
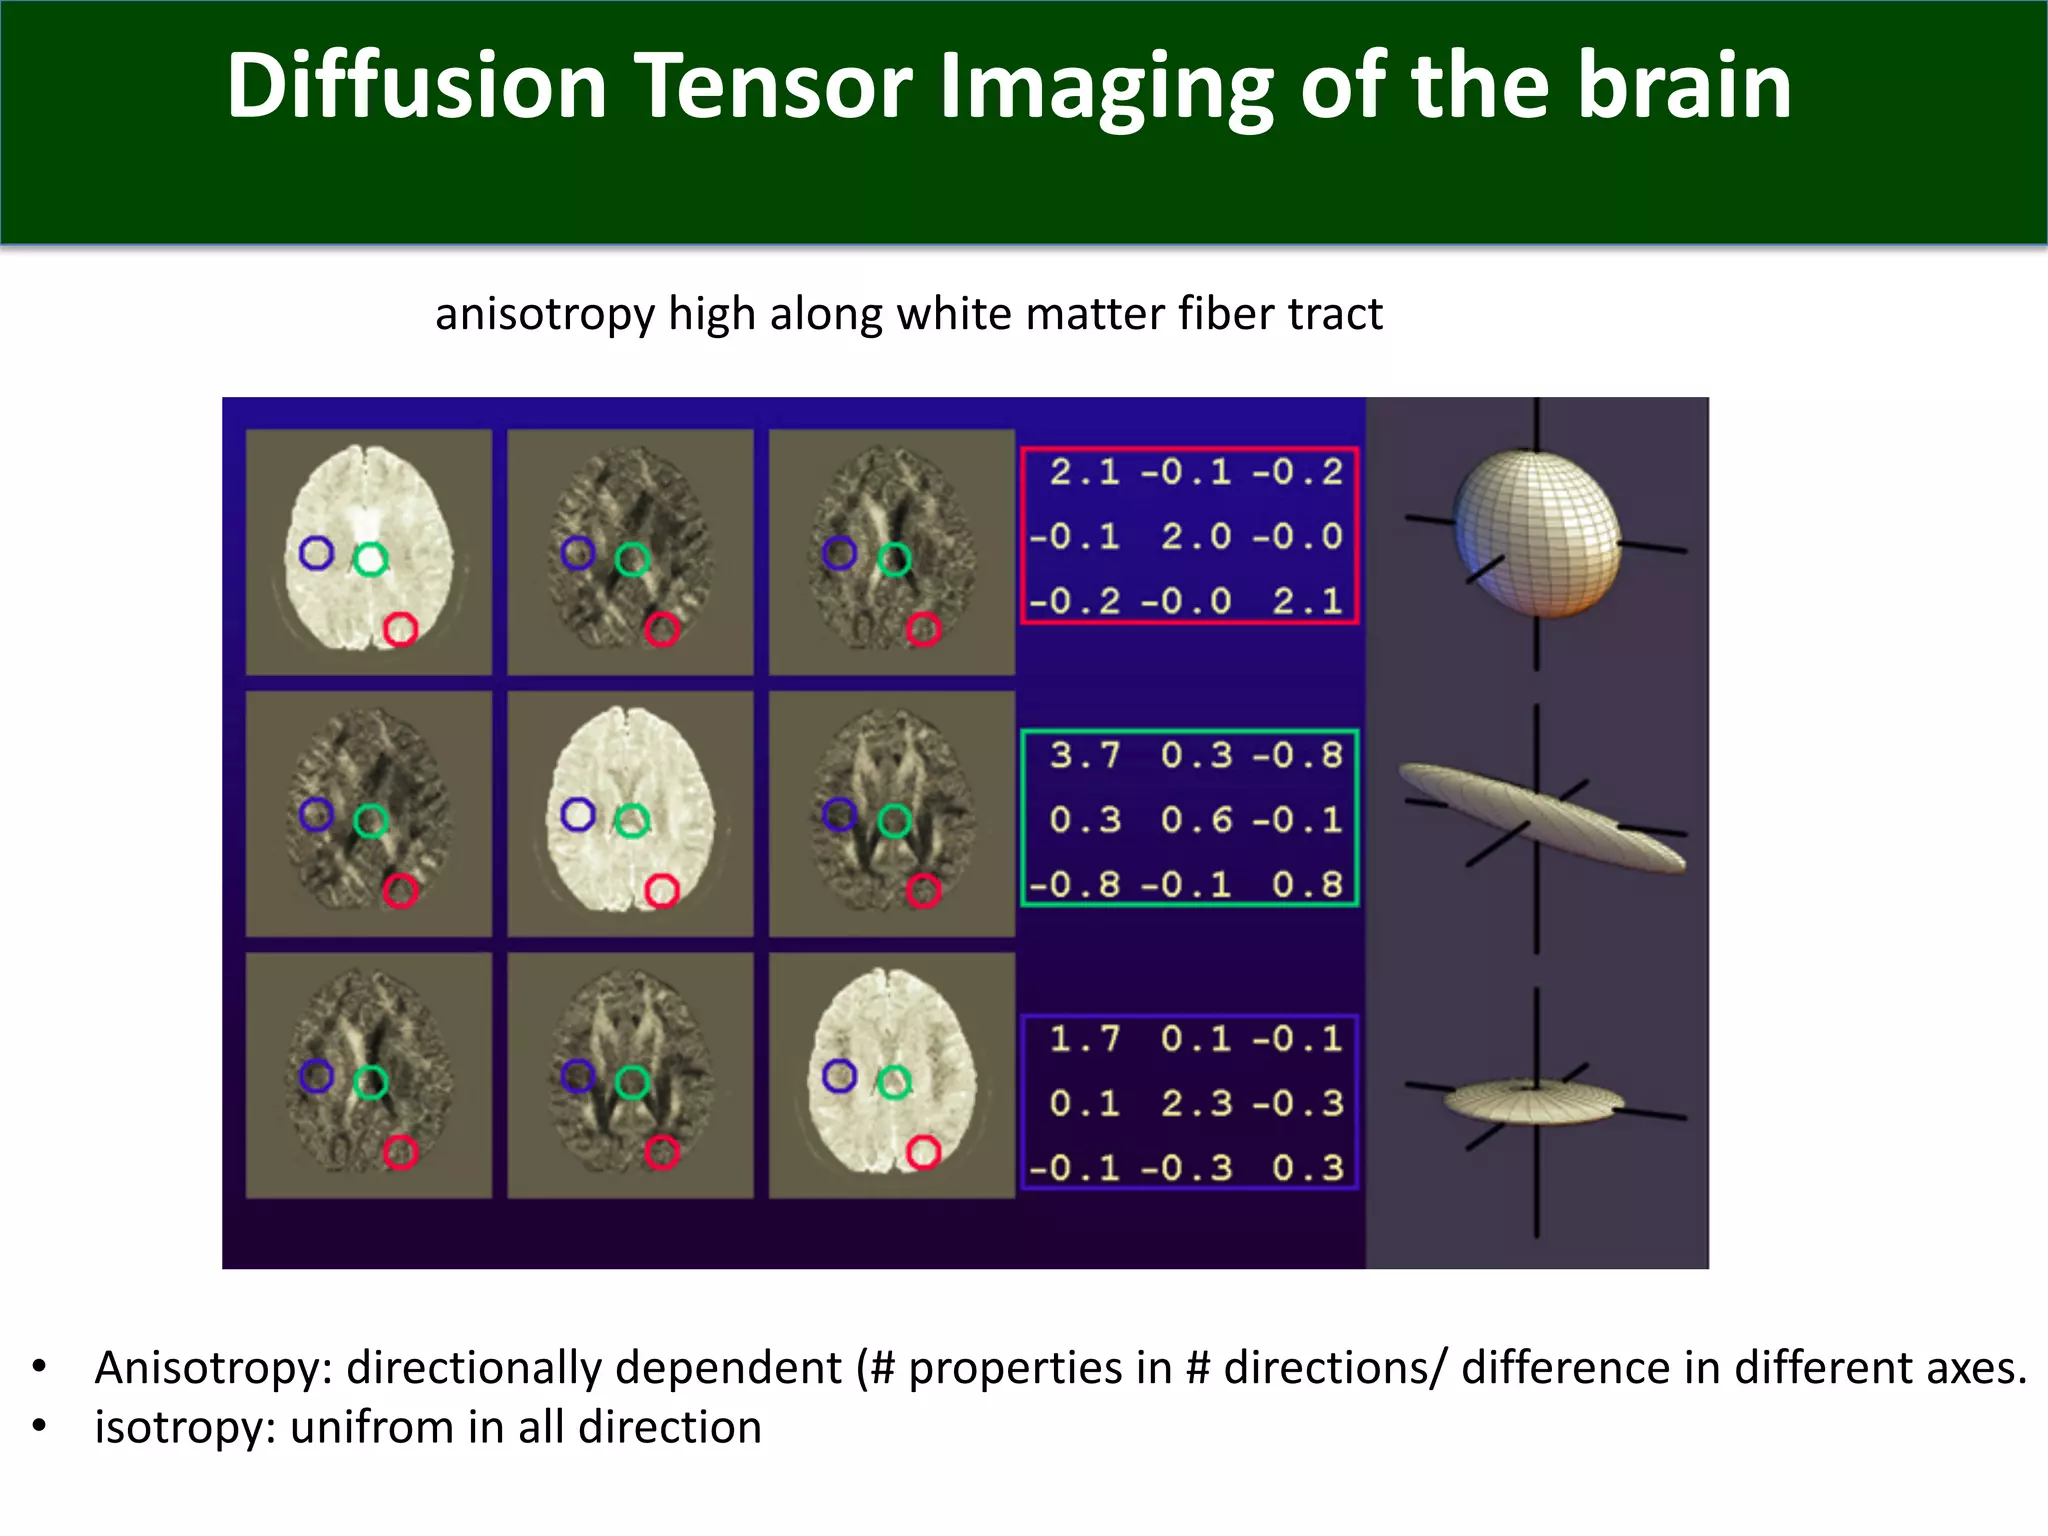
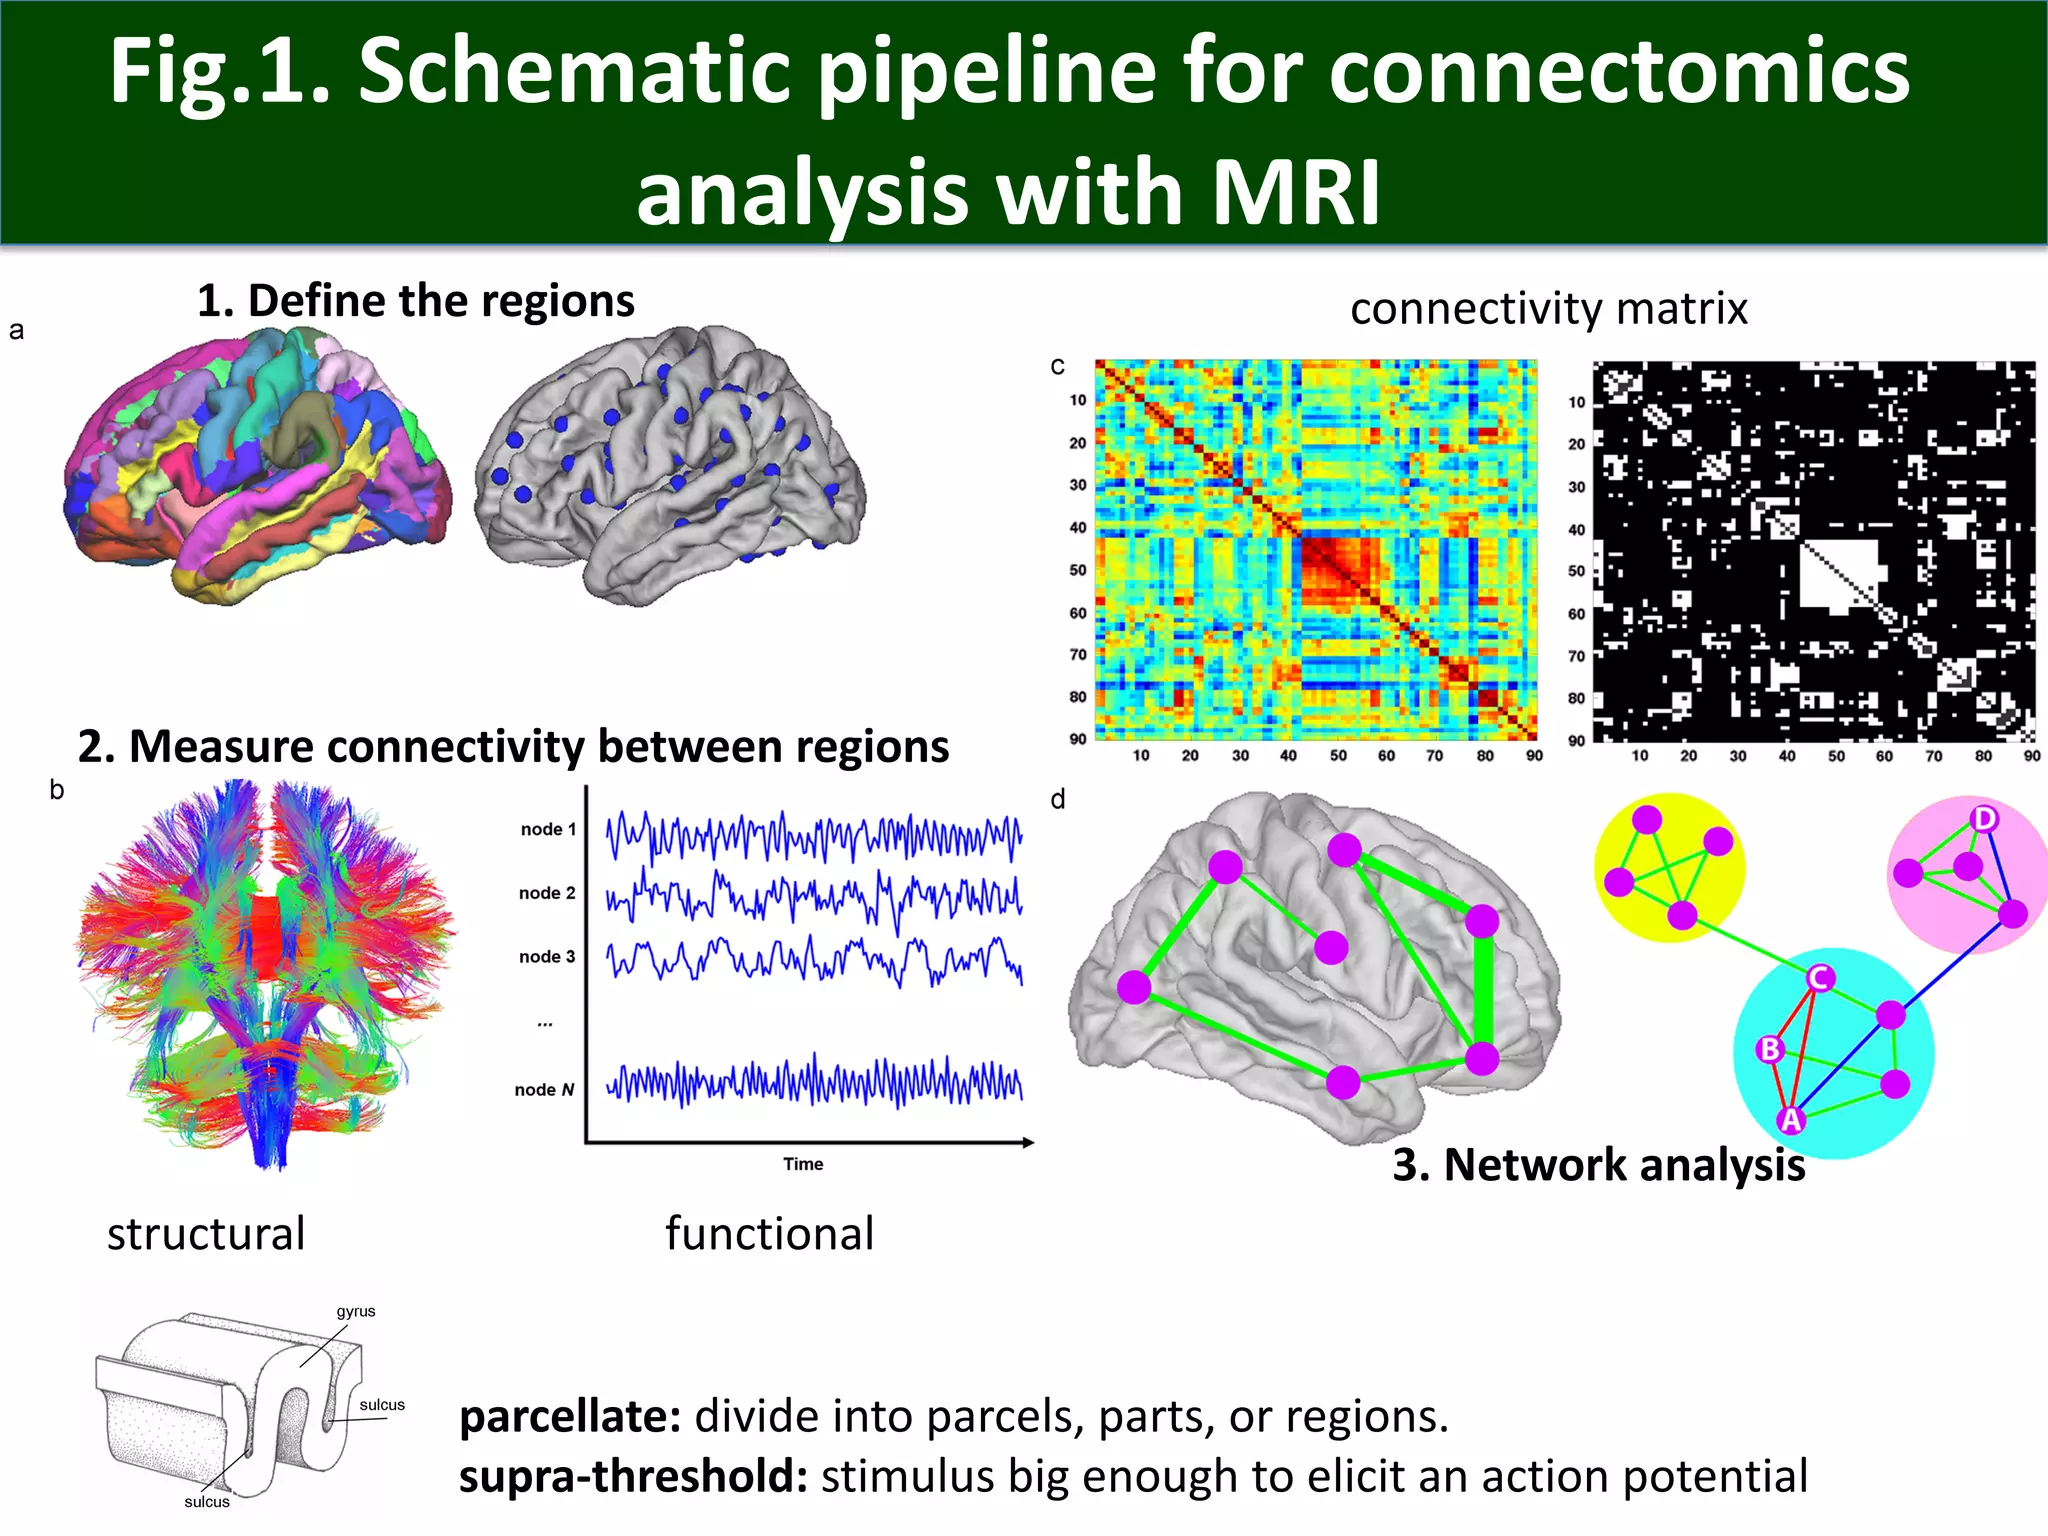
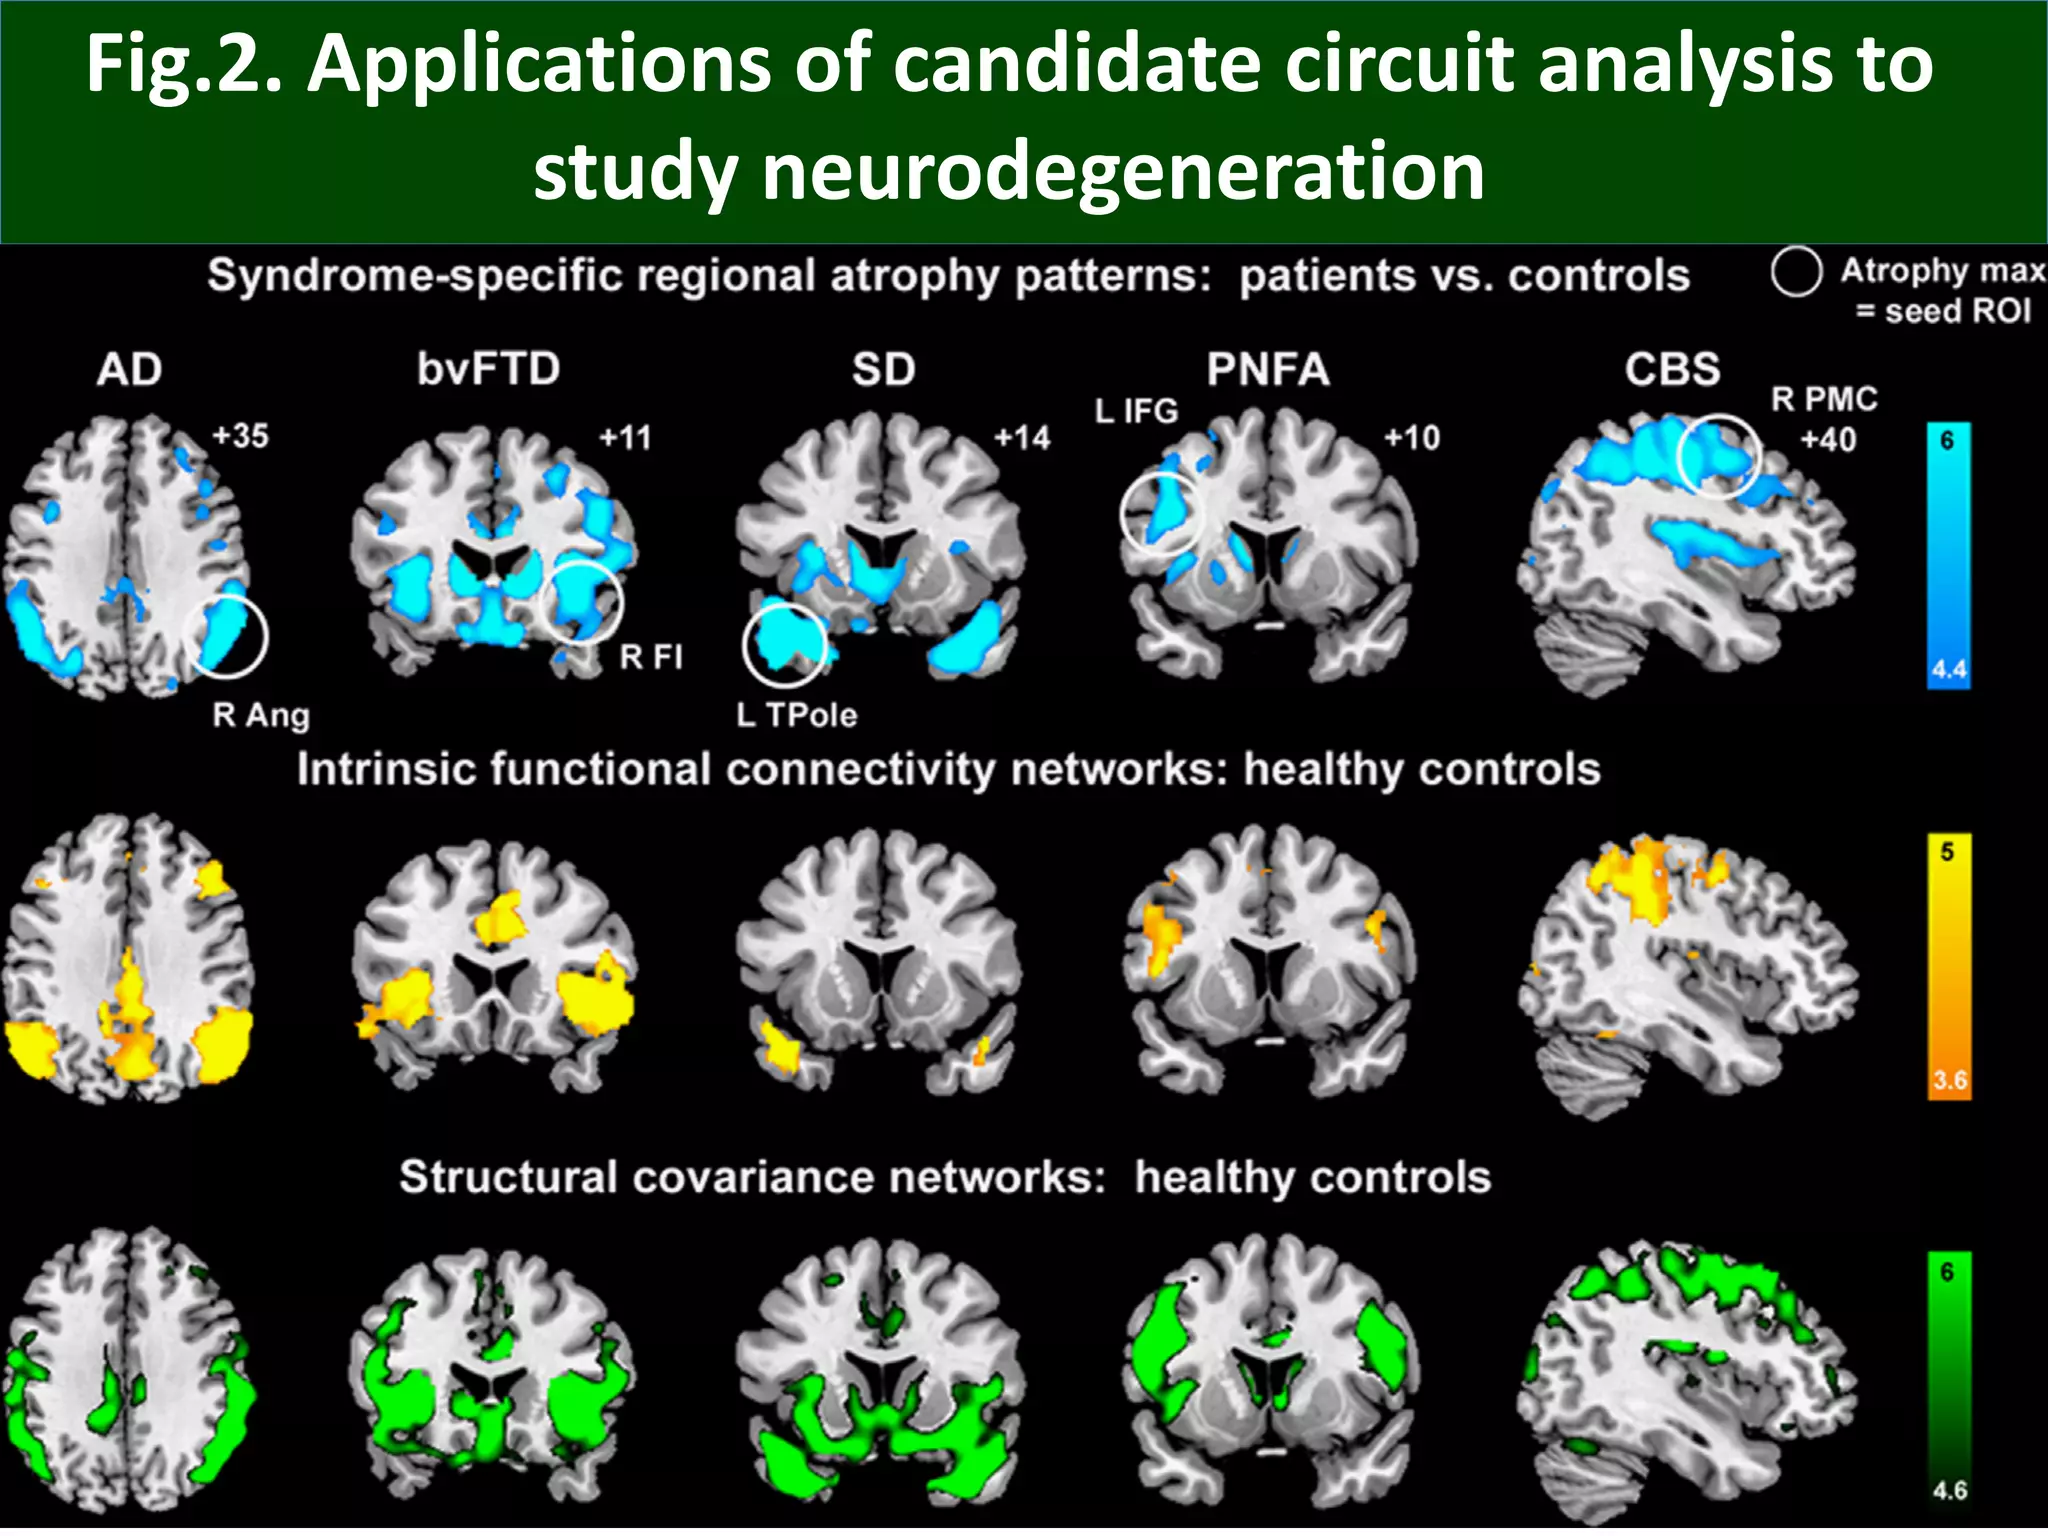
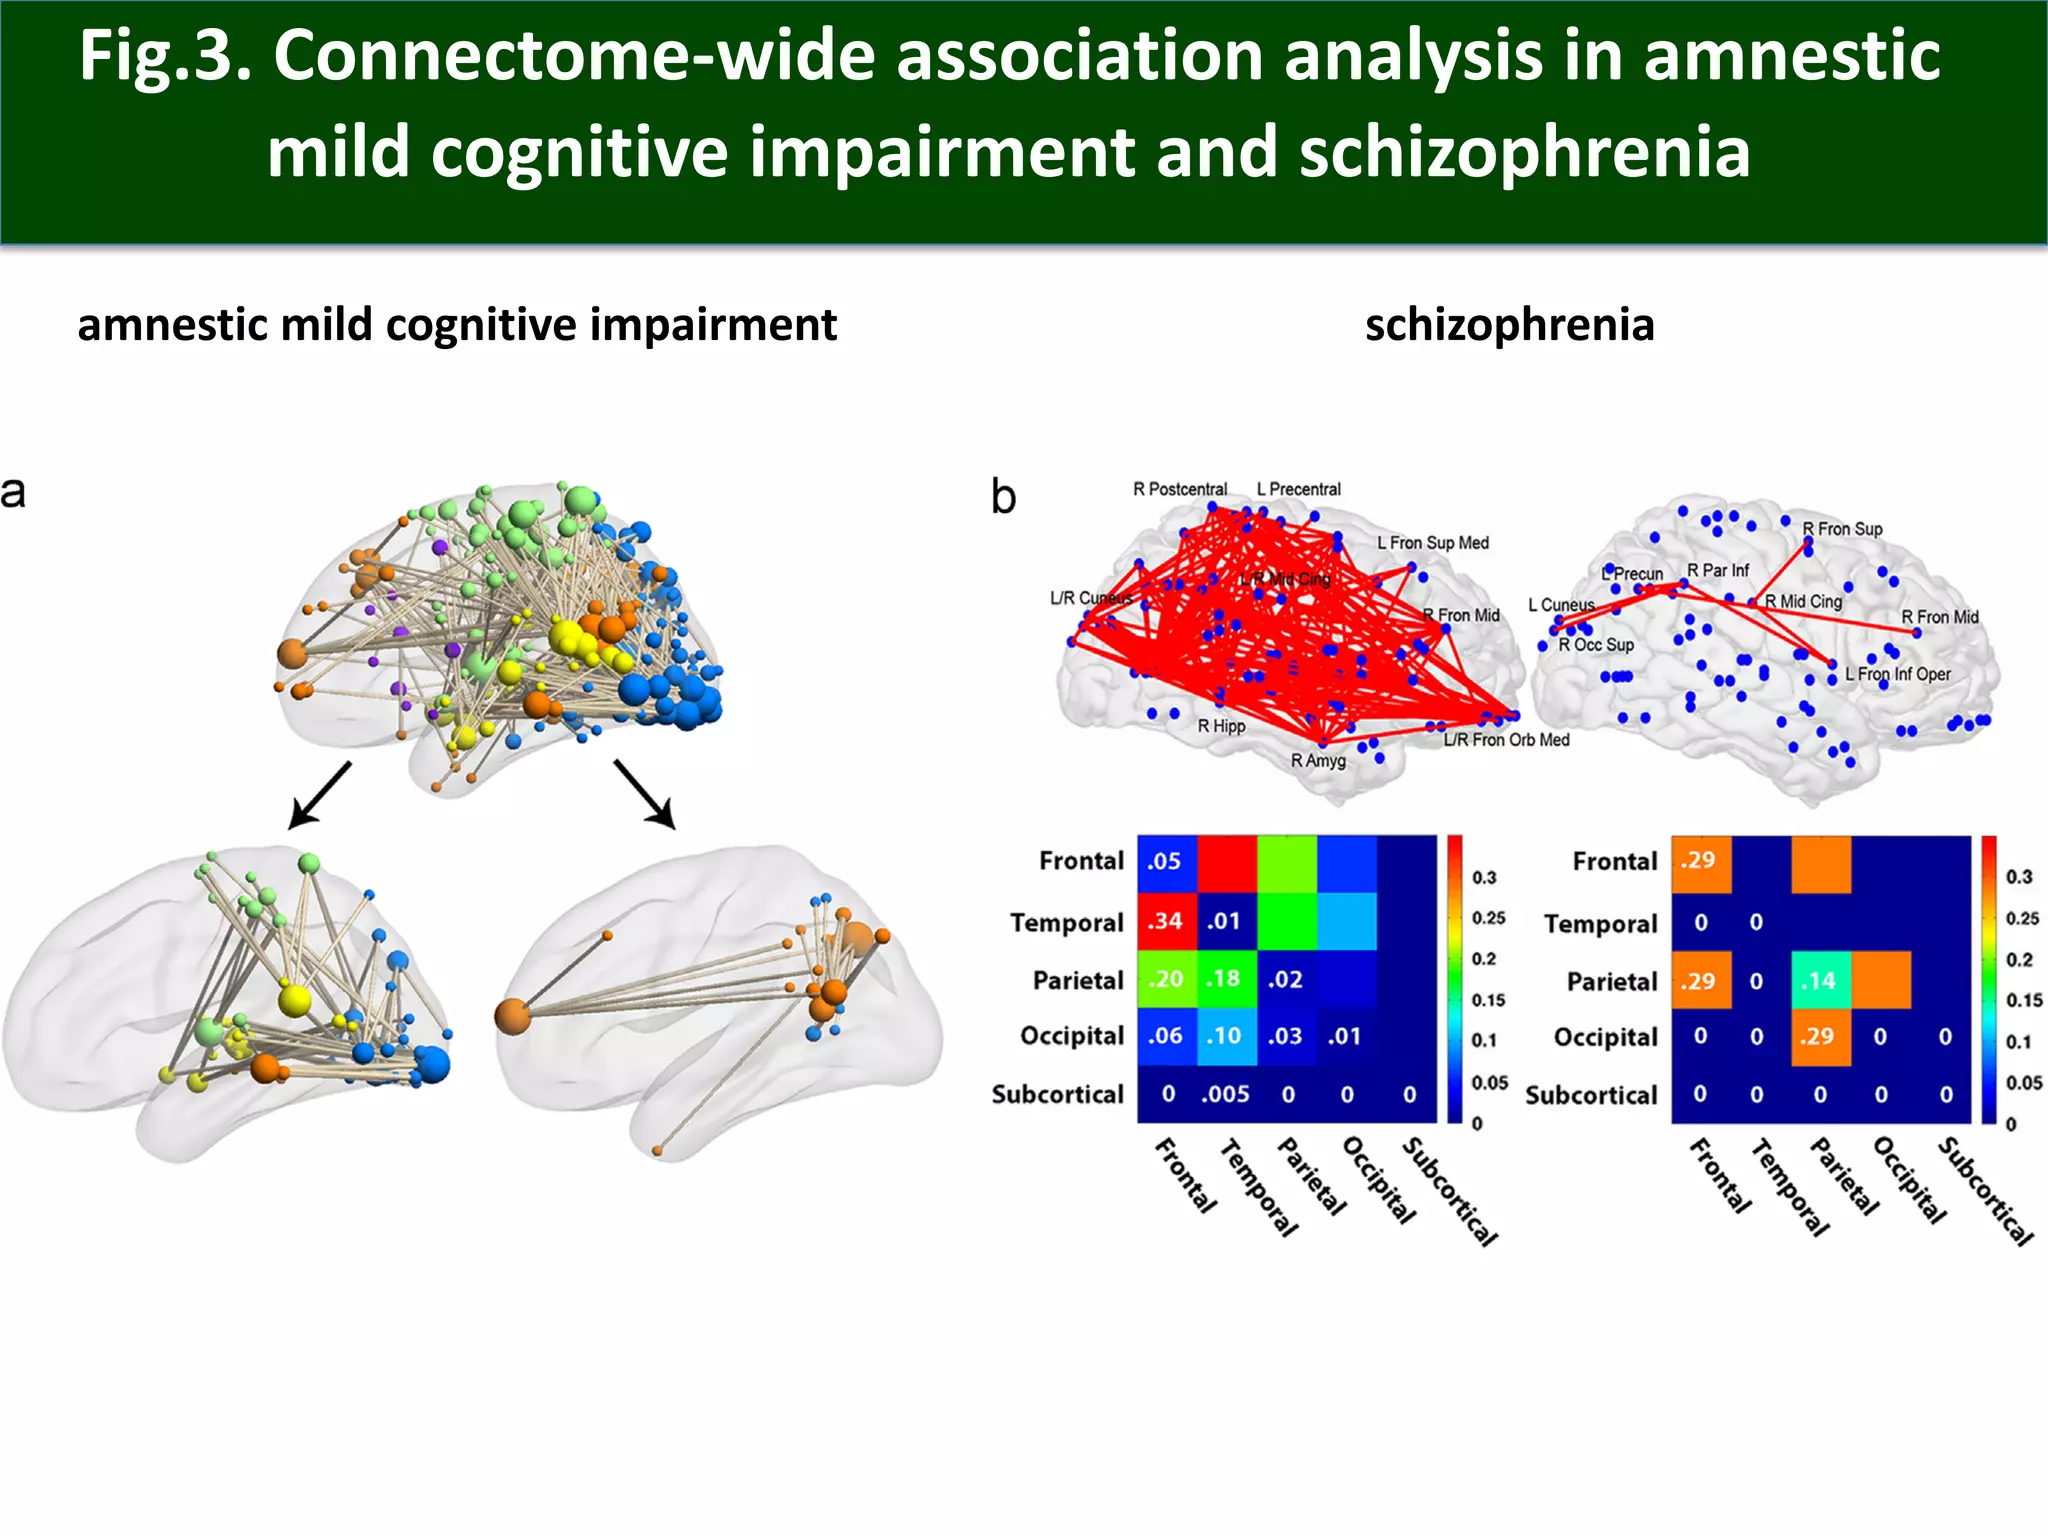
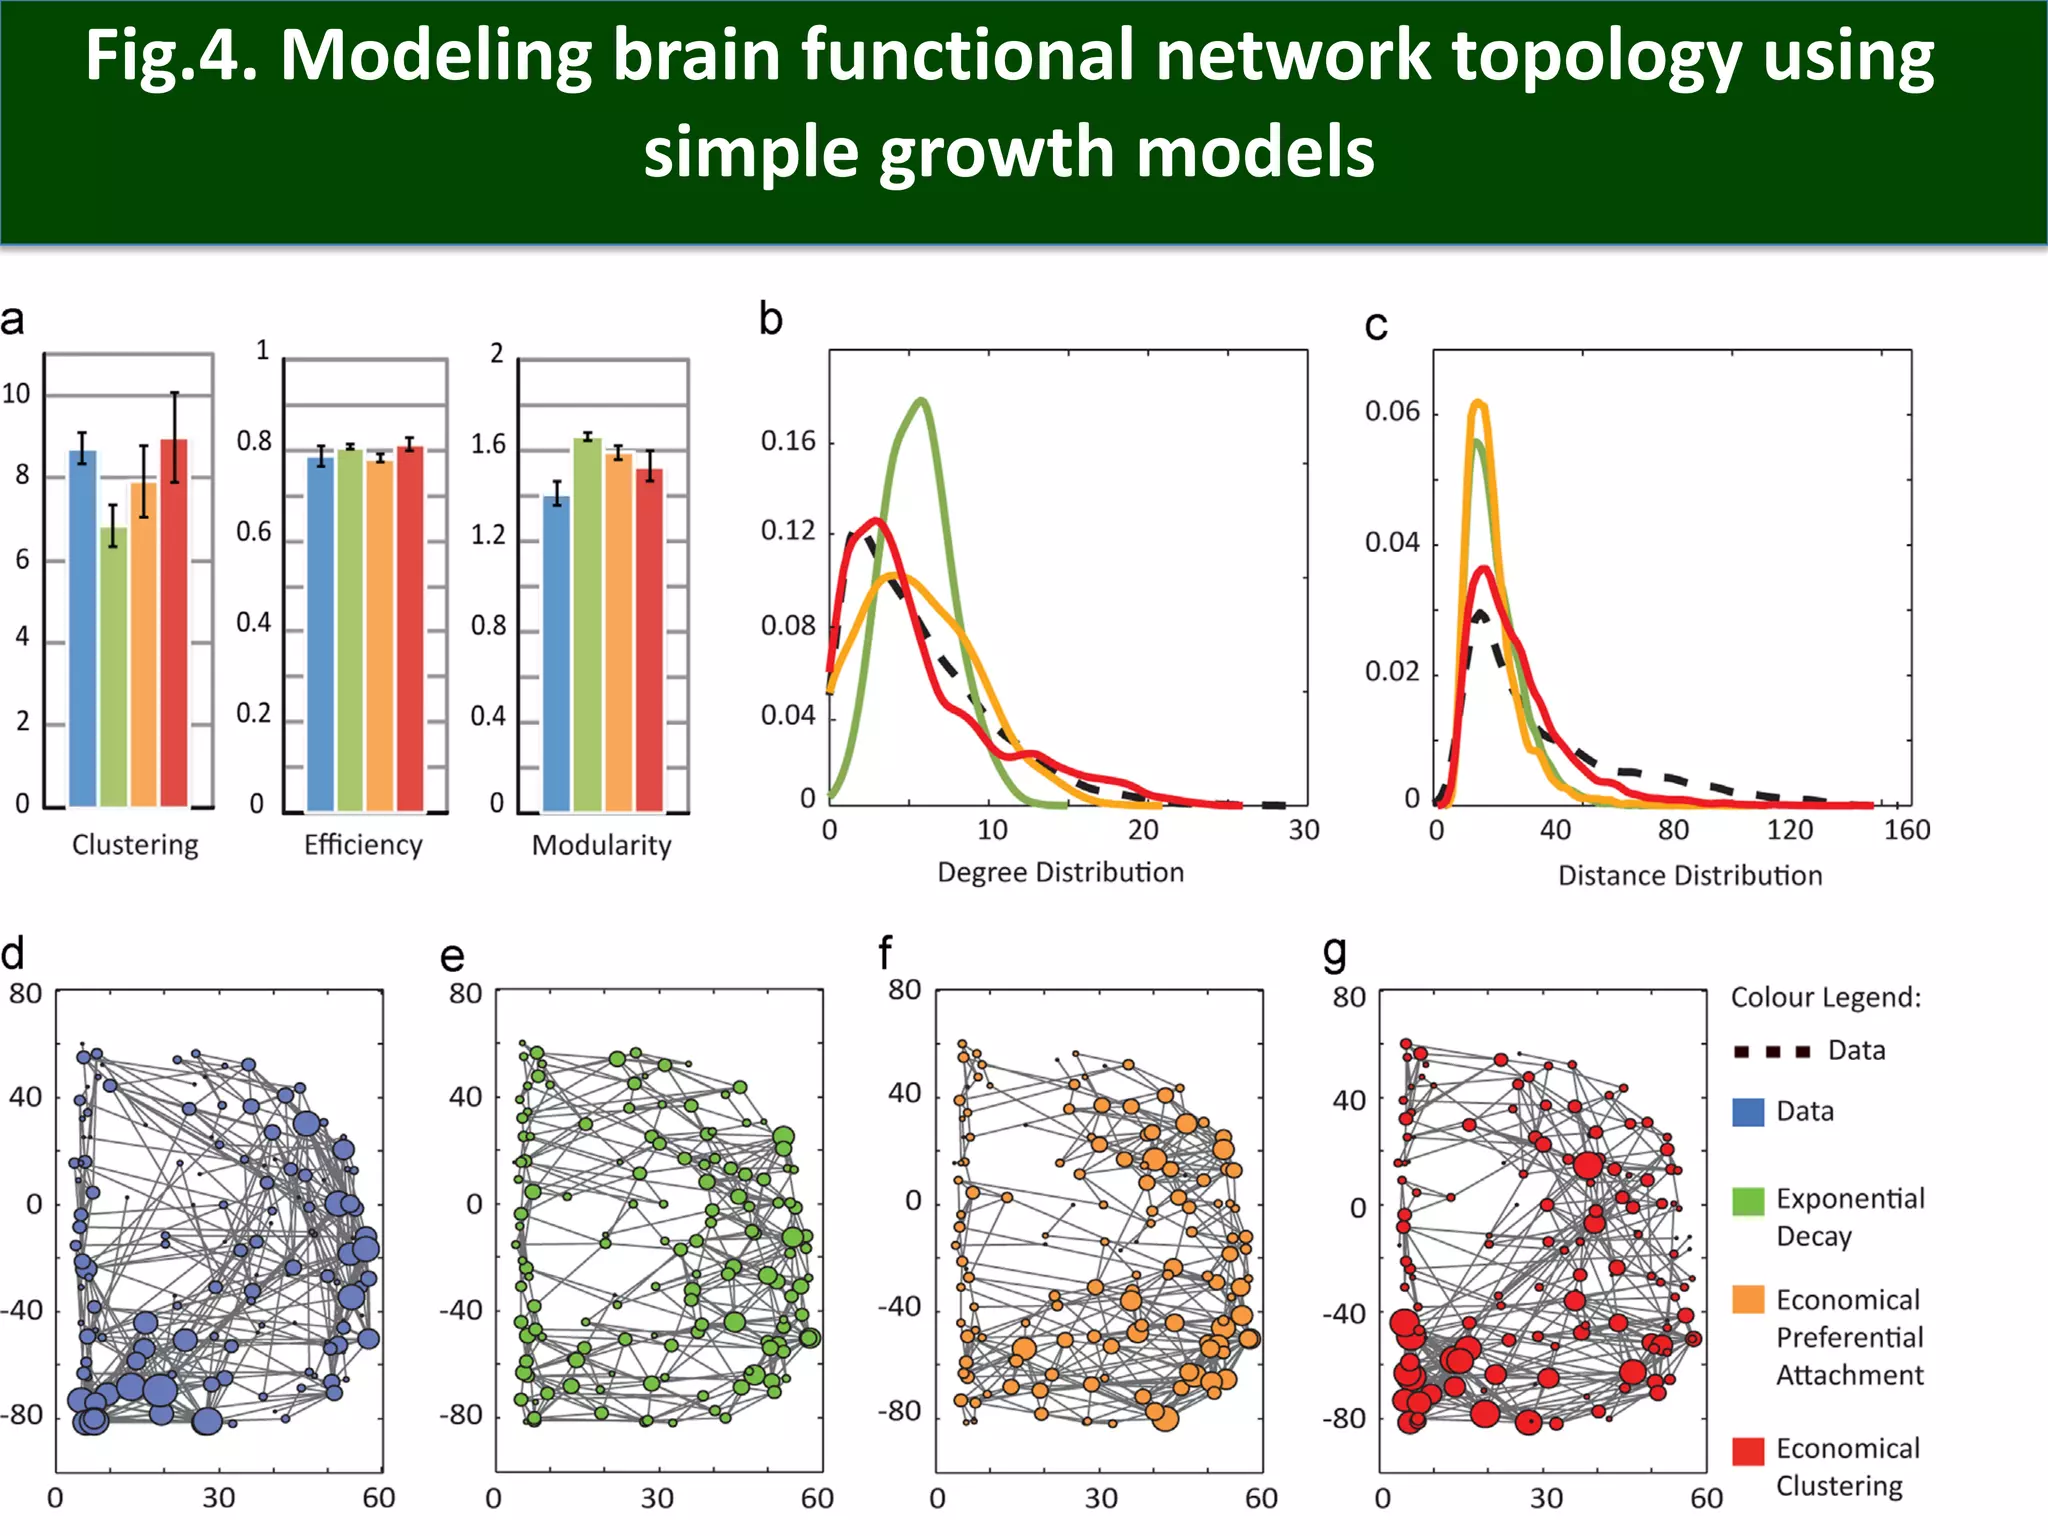
Connectomics:
A new paradigm for understanding brain disease
Bioinformatics Journal Club
March 20th, 2019
Presented by Thi Nguyen
Outline
• Functional specificity of human brain
• Connectomics
• Tools to study connectomics
1. fMRI measures functional connectivity
2. DWI measures anatomical connectivity
• Pipeline for connectomics analysis with MRI data
• Connectivity analysis
1. Candidate circuit analysis
2. Connectome-wide analysis
3. Topological analysis
• Conclusion
Functional specificity of human brain
• Franz Joseph Gall (1758-1828): father of phrenology
• phrenology : pseudoscience which involves measurement of
bumps on the skulls to predict mental traits.
• Galll: distinct mental faculties reside in different parts of the
brain
• Fluorens (1794-1867): founders of experimental brain research
attacked Gall’s idea “all sensory and volitional faculties exist in the
cerebral hemispheres and must be regarded as occupying
concurrently the same seat in these structures”
• 1861, Broca announced at the Societe d’ Anthropologie
that left frontal lobe is the seat of speech.
• By 20th century, agreement on cortical specialization for primary
sensory and motor function.
• still debate on higher level cognitive functions.
• fMRI: allows more resolution to map these functions
https://en.wikipedia.org/wiki/Phrenology
adapted from Prof. Nancy Kanwisher, MIT.
Functional specificity of human brain
https://www.pnas.org/content/107/25/11163
Connectomics
• connectomes: comprehensive map of all neural connections in the brain
macroscale levelmicroscale level
White matter fibre pathways of the brain as
depicted with MR tractography. Patric
Hagmann, CHUV-UNIL, Lausanne, Switzerland)
Neurons and their processes, color-coded to
distinguish one from another.
Lichtman Lab / Harvard University
Magnetic Resonance Imaging (MRI)
• efficient, cost-effective, non-invasive, in vivo mapping
of connectomes
• MRI uses powerful magnets to force protons in the
body align with that field. Detect changes in energy
released as protons are being re-aligned by changes in
radiofrequency current.
• well-suited to image soft tissues, can distinguish grey
vs white matter.
• fMRI measures brain activity by detecting blood flow
changes.
• DWI (diffusion weighted imaging) uses diffusion of
water molecules to generate contrast in MR images
MRI fMRI DWI
fMRI to measure functional connectivity
• best spatial resolution available to
measure neuronal activity noninvasively
• raw data ~ 30,000 3D pixels (voxels)
• covers the whole brain sample once every
2 secs
• BOLD signal (blood-oxygen-level-dependent)
• temporal resolution is limited by precision of blood
flow regulation
• spatial resolution (measured by voxel )is largely limited
by strength of signal
• voxel (1-5mm):100s of thousands of neurons in each voxel
• cannot measure absolute amounts of activity (only
measure the relative difference)
Diffusion Tensor Imaging of the brain
anisotropy high along white matter fiber tract
• Anisotropy: directionally dependent (# properties in # directions/ difference in different axes.
• isotropy: unifrom in all direction
Fig.1. Schematic pipeline for connectomics
analysis with MRI
1. Define the regions
2. Measure connectivity between regions
3. Network analysis
parcellate: divide into parcels, parts, or regions.
supra-threshold: stimulus big enough to elicit an action potential
structural functional
connectivity matrix
Connectivity analyses
• map the connectivity of a specific circuit/
sub-system of the connectome
• used when strong hypothesis about the
location of the effects
• greater control, more detailed characterization
of specific brain regions
• can be biased by neglecting wider context
Candidate circuit analysis Connectome-wide analysis
• map effects at each and every element of
connectivity matrix/ entire brain
• hypothesis-free
• need more focused investigation
• unbiased approach to identify targets
Candidate circuit analysis
• patterns of inter-regional co-activation/ dynamics commonly observed during cognitive
functions are represented in the brain’s resting state
• # in # species
• under strong genetic control
• correlate with anatomical connectivity
Þ resting-state fMRI is used to understand circuit level dysfunction in brain disorders
Þ note: resting-state fMRI = baseline BOLD variance
• Alzheimer’s disease:
Ø impairment in functional connectivity in default mode network
Ø correlate with anatomical changes in gray matter atrophy
Ø raises possibility of developing targeted intervention to selectively up/down regulate
that connectivity (deep brain stimulation (DBS), transcranial magnetic stimulation (TMS)).
Fig.2. Applications of candidate circuit analysis to
study neurodegeneration
Connectome-wide analysis
• comprehensive mapping of all disease-related changes/ experimental effects across entire
connectome.
• statistical challenge:
Ø network of N regions=> N(N-1) connections in a directed network or N(N-1)/2 connections in
a symmetric, undirected network.
Ø Typical MRI studies 100 <N< 1000
Ø Bonferoni-corrected thresholds need to be between p < 1.01 x 10⁻⁵ and p <1.01 x 10⁻⁷
Ø approach:
i.e. Network-based statistic (NBS) evaluates the null hypothesis at the level of interconnected
sub-networks as opposed to each pairwise connection
• visualization/ interpretation challenge:
Ø better to organize+ categorize nodes/edges in sub-network
• potential to integrate connectome-wide with genome-wide analyses (need novel approach)
Fig.3. Connectome-wide association analysis in amnestic
mild cognitive impairment and schizophrenia
amnestic mild cognitive impairment schizophrenia
Topological analysis
• how connections are arranged with respect to each other
• graph theory: any complex network can be represented as graphs of nodes connected by
edges.
1. topological integration measures:
• path length = mean number of connections on the shortest path linking any pair of nodes
• global efficiency = inverse path length
2. segregation measures
• clustering coefficient = probability that 2 nodes connected to the 3rd are also connected to
each other
• local efficiency
• modularity = how much the brain can be decomposed into subsets of highly connected regions
Connectome hubs
• Hubs = nodes that have high degree of connectivity that play a central role in the
connectome
• Brain networks are usually dominated by certain hubs
• Hub dominance can be determined by hub’s strength distribution (fat-tailed)
• connectome hub characteristics:
Ø high degree + strength
Ø high betweenness centrality
Ø low clustering
Ø metabolically costly to maintain
• trade-off between network wiring cost vs topological complexity
Fig.4. Modeling brain functional network topology using
simple growth models
Conclusion
• the brain is a complex organ with division-of-labor structure/function
• connectome studies the brain as a network
• advances in imaging techniques (fMRI, DWI) has enabled the burgeoning field of
connectomics at the macroscopic level.
• 3 approaches to study macro-connectomics:
Ø candidate circuits
Ø connectome-wide
Ø network topology
• connectomics has great research potential to uncover mechanism/ basis of neurological
disorders.
• connectomics has great clinical potential to help diagnose, monitor/track neurological
diseases.

Connectomics_Journal Club

  • 1.
    Connectomics: A new paradigmfor understanding brain disease Bioinformatics Journal Club March 20th, 2019 Presented by Thi Nguyen
  • 2.
    Outline • Functional specificityof human brain • Connectomics • Tools to study connectomics 1. fMRI measures functional connectivity 2. DWI measures anatomical connectivity • Pipeline for connectomics analysis with MRI data • Connectivity analysis 1. Candidate circuit analysis 2. Connectome-wide analysis 3. Topological analysis • Conclusion
  • 3.
    Functional specificity ofhuman brain • Franz Joseph Gall (1758-1828): father of phrenology • phrenology : pseudoscience which involves measurement of bumps on the skulls to predict mental traits. • Galll: distinct mental faculties reside in different parts of the brain • Fluorens (1794-1867): founders of experimental brain research attacked Gall’s idea “all sensory and volitional faculties exist in the cerebral hemispheres and must be regarded as occupying concurrently the same seat in these structures” • 1861, Broca announced at the Societe d’ Anthropologie that left frontal lobe is the seat of speech. • By 20th century, agreement on cortical specialization for primary sensory and motor function. • still debate on higher level cognitive functions. • fMRI: allows more resolution to map these functions https://en.wikipedia.org/wiki/Phrenology adapted from Prof. Nancy Kanwisher, MIT.
  • 4.
    Functional specificity ofhuman brain https://www.pnas.org/content/107/25/11163
  • 5.
    Connectomics • connectomes: comprehensivemap of all neural connections in the brain macroscale levelmicroscale level White matter fibre pathways of the brain as depicted with MR tractography. Patric Hagmann, CHUV-UNIL, Lausanne, Switzerland) Neurons and their processes, color-coded to distinguish one from another. Lichtman Lab / Harvard University
  • 6.
    Magnetic Resonance Imaging(MRI) • efficient, cost-effective, non-invasive, in vivo mapping of connectomes • MRI uses powerful magnets to force protons in the body align with that field. Detect changes in energy released as protons are being re-aligned by changes in radiofrequency current. • well-suited to image soft tissues, can distinguish grey vs white matter. • fMRI measures brain activity by detecting blood flow changes. • DWI (diffusion weighted imaging) uses diffusion of water molecules to generate contrast in MR images MRI fMRI DWI
  • 7.
    fMRI to measurefunctional connectivity • best spatial resolution available to measure neuronal activity noninvasively • raw data ~ 30,000 3D pixels (voxels) • covers the whole brain sample once every 2 secs • BOLD signal (blood-oxygen-level-dependent) • temporal resolution is limited by precision of blood flow regulation • spatial resolution (measured by voxel )is largely limited by strength of signal • voxel (1-5mm):100s of thousands of neurons in each voxel • cannot measure absolute amounts of activity (only measure the relative difference)
  • 8.
    Diffusion Tensor Imagingof the brain anisotropy high along white matter fiber tract • Anisotropy: directionally dependent (# properties in # directions/ difference in different axes. • isotropy: unifrom in all direction
  • 9.
    Fig.1. Schematic pipelinefor connectomics analysis with MRI 1. Define the regions 2. Measure connectivity between regions 3. Network analysis parcellate: divide into parcels, parts, or regions. supra-threshold: stimulus big enough to elicit an action potential structural functional connectivity matrix
  • 10.
    Connectivity analyses • mapthe connectivity of a specific circuit/ sub-system of the connectome • used when strong hypothesis about the location of the effects • greater control, more detailed characterization of specific brain regions • can be biased by neglecting wider context Candidate circuit analysis Connectome-wide analysis • map effects at each and every element of connectivity matrix/ entire brain • hypothesis-free • need more focused investigation • unbiased approach to identify targets
  • 11.
    Candidate circuit analysis •patterns of inter-regional co-activation/ dynamics commonly observed during cognitive functions are represented in the brain’s resting state • # in # species • under strong genetic control • correlate with anatomical connectivity Þ resting-state fMRI is used to understand circuit level dysfunction in brain disorders Þ note: resting-state fMRI = baseline BOLD variance • Alzheimer’s disease: Ø impairment in functional connectivity in default mode network Ø correlate with anatomical changes in gray matter atrophy Ø raises possibility of developing targeted intervention to selectively up/down regulate that connectivity (deep brain stimulation (DBS), transcranial magnetic stimulation (TMS)).
  • 12.
    Fig.2. Applications ofcandidate circuit analysis to study neurodegeneration
  • 13.
    Connectome-wide analysis • comprehensivemapping of all disease-related changes/ experimental effects across entire connectome. • statistical challenge: Ø network of N regions=> N(N-1) connections in a directed network or N(N-1)/2 connections in a symmetric, undirected network. Ø Typical MRI studies 100 <N< 1000 Ø Bonferoni-corrected thresholds need to be between p < 1.01 x 10⁻⁵ and p <1.01 x 10⁻⁷ Ø approach: i.e. Network-based statistic (NBS) evaluates the null hypothesis at the level of interconnected sub-networks as opposed to each pairwise connection • visualization/ interpretation challenge: Ø better to organize+ categorize nodes/edges in sub-network • potential to integrate connectome-wide with genome-wide analyses (need novel approach)
  • 14.
    Fig.3. Connectome-wide associationanalysis in amnestic mild cognitive impairment and schizophrenia amnestic mild cognitive impairment schizophrenia
  • 15.
    Topological analysis • howconnections are arranged with respect to each other • graph theory: any complex network can be represented as graphs of nodes connected by edges. 1. topological integration measures: • path length = mean number of connections on the shortest path linking any pair of nodes • global efficiency = inverse path length 2. segregation measures • clustering coefficient = probability that 2 nodes connected to the 3rd are also connected to each other • local efficiency • modularity = how much the brain can be decomposed into subsets of highly connected regions
  • 16.
    Connectome hubs • Hubs= nodes that have high degree of connectivity that play a central role in the connectome • Brain networks are usually dominated by certain hubs • Hub dominance can be determined by hub’s strength distribution (fat-tailed) • connectome hub characteristics: Ø high degree + strength Ø high betweenness centrality Ø low clustering Ø metabolically costly to maintain • trade-off between network wiring cost vs topological complexity
  • 17.
    Fig.4. Modeling brainfunctional network topology using simple growth models
  • 18.
    Conclusion • the brainis a complex organ with division-of-labor structure/function • connectome studies the brain as a network • advances in imaging techniques (fMRI, DWI) has enabled the burgeoning field of connectomics at the macroscopic level. • 3 approaches to study macro-connectomics: Ø candidate circuits Ø connectome-wide Ø network topology • connectomics has great research potential to uncover mechanism/ basis of neurological disorders. • connectomics has great clinical potential to help diagnose, monitor/track neurological diseases.