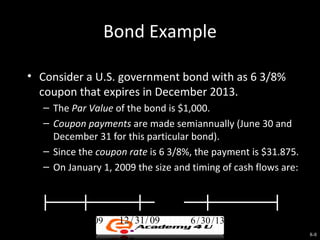
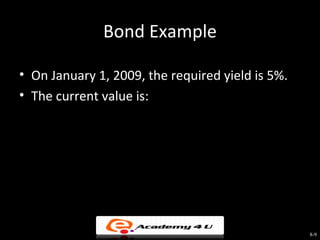
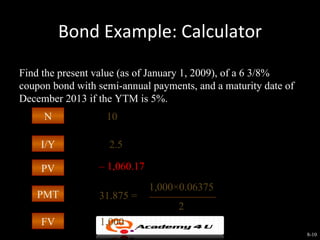
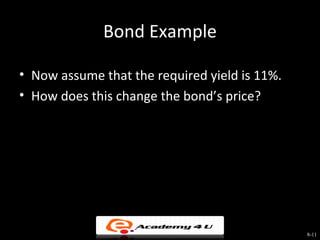
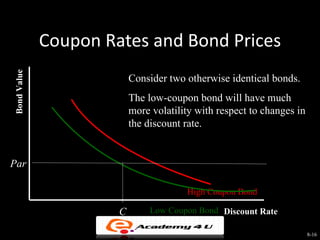
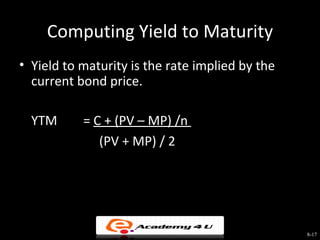
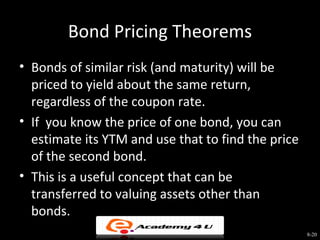
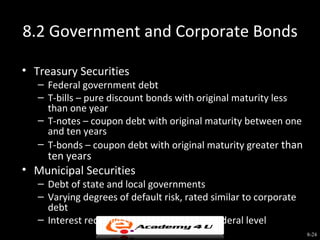
This document provides an overview of bond valuation and the bond market. It discusses key bond features and valuation concepts, including how bond prices are determined by expected future cash flows and interest rates. Government bonds such as Treasury securities are described as well as corporate bonds, which have greater default risk. Bond ratings are also covered, with higher rated bonds seen as less risky. The effects of inflation and the term structure of interest rates on bond yields are summarized.
The presentation slide is on stock valuation. We have tried to present the various techniques to stock valuation under which different methods are discussed with illustrations. Key concepts:
Zero Growth Model
Balance sheet Technique
Constant Growth Model
Two-stage growth Model
Feel Free to comment.
The presentation highlights some shortcut formulas that can speed up PV computations if a project have a particular set of cash flow patterns and the opportunity cost of capital is constant
Fixed Income securities- Analysis and Valuation. Very useful for CFA and FRM level 1 preparation candidates. For a more detailed understanding, you can watch the webinar video on this topic. The link for the webinar video on this topic is https://www.youtube.com/watch?v=r9j6Bu3aUNI
BONDS, FEATURES OF BONDS, BOND VALUATION, MEASURING YIELD, ASSESSING RISK, TYPES OF LONG- TERM DEBT INSTRUMENTS, SERIAL BONDS, TYPES OF RISK, SEMI- ANNUAL BONDS, YIELD TO CALL, YIELD TO MATURITY, DEFAULT RISK & FACTORS AFFECTING DEFAULT RISK & BOND RATINGS, etc.
Fixed coupon payments and final payment at maturity, except when the borrower defaults.
Possibility of gain (loss) from fall (rise) in interest rates
Depending on the debt issue, illiquidity can be a problem. (Illiquidity means it is possible that you cannot sell these securities quickly.)
INVESTING IN STOCKS AND BONDSWhy Consider BondsBond.docxmariuse18nolet
INVESTING IN
STOCKS AND BONDS
Why Consider Bonds?
Bonds reduce risk through diversification.
Bonds produce steady income.
Bonds can be a safe investment if held to maturity.
Your Rights as a Bondholder
Bondholders are creditors
Bond indenture
Protective covenants
Payment Characteristics of Bonds
Face value: The amount the issuer pays to redeem the bond
It is usually $1,000 for corporate bonds.
Coupon interest payments:
Most bonds have a fixed rate of return, which are the interest payments that are made every 6 months.
The amount of the payment is determined by multiplying the bond’s coupon rate by the face value of $1,000.
Example: An 8% bond pays $80 in interest per year (0.08 × $1,000) divided into two payments of $40 semiannually.
Retirement Methods
Redeemed at maturity
Call provision
Sinking fund provision
Convertible bonds can be converted into common stock.
Corporate Bonds
Corporate bonds - allow firms to borrow money, are a major source of funding.
Denominations in $1000.
Secured bond – backed by collateral.
Unsecured bond – a debenture.
Hierarchy of bonds – subordinated debentures are low on the list.
Government-Issued Bonds
U.S. Treasury Securities
U.S. Agency Bonds
Conventional
Mortgage-backed
Municipal Bonds
General obligation (GO) bonds
Revenue bonds
Special Types of U.S. Treasury Bonds
U.S. Treasury Strips
Inflation-Indexed Bonds
Intended to lessen price risk of bonds
The coupon rate is not changed.
The redemption value is adjusted periodically to reflect inflation. Example: If annual inflation is 3%, the redemption value is increased to $1,030.
Munis’ Income Tax Advantage
Example:
Muni Yield = 5.91% and Tax rate = 28% (0.28)
FTEY = 5.91/(1.00 – 0.28)
= 5.91/0.72 = 8.21%
Compare to yields on taxable bonds and choose the bond with the highest yield.
Special Situation Bonds
Zero Coupon Bonds
Junk bonds
Bond Ratings – A Measure
of Riskiness
Moody’s and Standard & Poor’s provide ratings on corporate and municipal bonds.
Ratings involve a judgment about a bond’s future risk potential.
Default risk – ability to repay principal.
Inability to meet interest obligations.
The lower the rating, the higher the rate of return demanded by investors.
Safest bonds receive AAA, D is extremely risky.
Expected Return from Bonds
Current yield (CY): annual interest divided by current price
Example:
Bond price (P) = $900
Annual coupon interest (I) = $120
The current yield calculation:
CY = I/P = $120/$900 = 0.1333 or 13.3%
The advantage of this calculation is that it is easy.
The disadvantage is that ignores maturity.
Yield to Maturity (YTM)
Yield to maturity is the return you would earn by buying a bond today and holding it until it is redeemed by the issuer.
Formula (approximation)
YTM = [ I + (1,000 – P)/N]/ [(P + 1,000)/2]
Example: I = 120, P = 900, N = 5
YTM = [120+(1,000 – 900)/5]/ [(900 + 1,000)/2]
= [120 + 20]/ [950]
= 140/950 = 0.1474 or 14.74%
YTM Example..contd.
.
This is a presentation by Dada Robert in a Your Skill Boost masterclass organised by the Excellence Foundation for South Sudan (EFSS) on Saturday, the 25th and Sunday, the 26th of May 2024.
He discussed the concept of quality improvement, emphasizing its applicability to various aspects of life, including personal, project, and program improvements. He defined quality as doing the right thing at the right time in the right way to achieve the best possible results and discussed the concept of the "gap" between what we know and what we do, and how this gap represents the areas we need to improve. He explained the scientific approach to quality improvement, which involves systematic performance analysis, testing and learning, and implementing change ideas. He also highlighted the importance of client focus and a team approach to quality improvement.
Ethnobotany and Ethnopharmacology:
Ethnobotany in herbal drug evaluation,
Impact of Ethnobotany in traditional medicine,
New development in herbals,
Bio-prospecting tools for drug discovery,
Role of Ethnopharmacology in drug evaluation,
Reverse Pharmacology.
Unit 8 - Information and Communication Technology (Paper I).pdfThiyagu K
This slides describes the basic concepts of ICT, basics of Email, Emerging Technology and Digital Initiatives in Education. This presentations aligns with the UGC Paper I syllabus.
Welcome to TechSoup New Member Orientation and Q&A (May 2024).pdfTechSoup
In this webinar you will learn how your organization can access TechSoup's wide variety of product discount and donation programs. From hardware to software, we'll give you a tour of the tools available to help your nonprofit with productivity, collaboration, financial management, donor tracking, security, and more.
Read| The latest issue of The Challenger is here! We are thrilled to announce that our school paper has qualified for the NATIONAL SCHOOLS PRESS CONFERENCE (NSPC) 2024. Thank you for your unwavering support and trust. Dive into the stories that made us stand out!
The Indian economy is classified into different sectors to simplify the analysis and understanding of economic activities. For Class 10, it's essential to grasp the sectors of the Indian economy, understand their characteristics, and recognize their importance. This guide will provide detailed notes on the Sectors of the Indian Economy Class 10, using specific long-tail keywords to enhance comprehension.
For more information, visit-www.vavaclasses.com
2. Key Concepts and Skills
• Know the important bond features and bond
types
• Understand bond values and why they fluctuate
• Understand bond ratings and what they mean
• Understand the impact of inflation on interest
rates
• Understand the term structure of interest rates
and the determinants of bond yields
8-2
3. Chapter Outline
8.1 Bonds and Bond Valuation
8.2 Government and Corporate Bonds
8.3 Bond Markets
8.4 Inflation and Interest Rates
8.5 Determinants of Bond Yields
8-3
4. 8.1 Bonds and Bond Valuation
• A bond is a legally binding agreement
between a borrower and a lender that
specifies the:
– Par (face) value
– Coupon rate
– Coupon payment
– Maturity Date
• The yield to maturity is the required market
interest rate on the bond.
8-4
5. Bond Valuation
• Primary Principle:
– Value of financial securities = PV of expected
future cash flows
• Bond value is, therefore, determined by the
present value of the coupon payments and
par value.
8-5
6. • Interest rates are inversely related to present
(i.e., bond) values.
– When interest rate rises, bond price will fall than the face
value and vice versa.
– Long term zero coupon bonds are more sensitive to
changes in interest rates than are short term zero coupon
bonds.
– Bonds with low coupon rates are more sensitive to
changes in interest rates than similar maturity bonds with
high coupon rates.
8-6
8. Bond Example
• Consider a U.S. government bond with as 6 3/8%
coupon that expires in December 2013.
– The Par Value of the bond is $1,000.
– Coupon payments are made semiannually (June 30 and
December 31 for this particular bond).
– Since the coupon rate is 6 3/8%, the payment is $31.875.
– On January 1, 2009 the size and timing of cash flows are:
$31.875 $31.875 $31.875 $1,031.875
1 / 1 / 09 6 / 30 / 09 12 / 31 / 09 6 / 30 / 13 12 / 31 / 13
8-8
9. Bond Example
• On January 1, 2009, the required yield is 5%.
• The current value is:
$31.875 1 $1,000
PV = 1 − (1.025)10 + (1.025)10 = $1,060.17
.05 2
8-9
10. Bond Example: Calculator
Find the present value (as of January 1, 2009), of a 6 3/8%
coupon bond with semi-annual payments, and a maturity date of
December 2013 if the YTM is 5%.
N 10
I/Y 2.5
PV – 1,060.17
1,000×0.06375
PMT 31.875 =
2
FV 1,000
8-10
11. Bond Example
• Now assume that the required yield is 11%.
• How does this change the bond’s price?
$31.875 1 $1,000
PV = 1 − (1.055)10 + (1.055)10 = $825.69
.11 2
8-11
12. YTM and Bond Value
When the YTM < coupon, the bond
1300 trades at a premium.
Bond Value
1200
1100 When the YTM = coupon, the
bond trades at par.
1000
800
0 0.01 0.02 0.03 0.04 0.05 0.06 0.07 0.08 0.09 0.1
6 3/8 Discount Rate
When the YTM > coupon, the bond trades at a discount. 8-12
13. Bond Concepts
Bond prices and market interest rates
move in opposite directions.
When coupon rate = YTM, price = par value
When coupon rate > YTM, price > par value
(premium bond)
When coupon rate < YTM, price < par value
(discount bond)
8-13
14. Interest Rate Risk
• Price Risk
– Change in price due to changes in interest rates
– Long-term bonds have more price risk than short-term bonds
– Low coupon rate bonds have more price risk than high coupon
rate bonds.
• Reinvestment Rate Risk
– Uncertainty concerning rates at which cash flows can be reinvested
– Short-term bonds have more reinvestment rate risk than long-term
bonds.
– High coupon rate bonds have more reinvestment rate risk than low
coupon rate bonds.
8-14
15. Maturity and Bond Price Volatility
Bond Value
Consider two otherwise identical bonds.
The long-maturity bond will have much more
volatility with respect to changes in the
discount rate.
Par
Short Maturity Bond
C Discount Rate
Long Maturity
Bond 8-15
16. Coupon Rates and Bond Prices
Bond Value
Consider two otherwise identical bonds.
The low-coupon bond will have much
more volatility with respect to changes in
the discount rate.
Par
High Coupon Bond
C Low Coupon Bond Discount Rate
8-16
17. Computing Yield to Maturity
• Yield to maturity is the rate implied by the
current bond price.
YTM = C + (PV – MP) /n
(PV + MP) / 2
8-17
18. YTM with Annual Coupons
• Consider a bond with a 10% annual coupon rate, 15
years to maturity, and a par value of $1,000. The
current price is $928.09.
YTM = C + (PV – MP) /n
(PV + MP) / 2
YTM = 100 + (1,000 – 928.09) /15
(1,000 +928.09) / 2
= 10.87%
8-18
19. YTM with Semiannual Coupons
• Suppose a bond with a 10% coupon rate and
semiannual coupons has a face value of $1,000, 20
years to maturity, and is selling for $1,197.93.
YTM = C/2 + (PV – MP) /nx2
(PV + MP) / 2
YTM = 100/2 + (1,000 – 1,197.93) /20x2
(1,000 + 1,197.93) / 2
YTM = 4.099%
8-19
20. Bond Pricing Theorems
• Bonds of similar risk (and maturity) will be
priced to yield about the same return,
regardless of the coupon rate.
• If you know the price of one bond, you can
estimate its YTM and use that to find the price
of the second bond.
• This is a useful concept that can be
transferred to valuing assets other than
bonds.
8-20
21. Zero Coupon Bonds
• Make no periodic interest payments (coupon rate =
0%)
• The entire yield to maturity comes from the
difference between the purchase price and the par
value
• Cannot sell for more than par value
• Sometimes called zeroes, deep discount bonds, or
original issue discount bonds (OIDs)
• Treasury Bills and principal-only Treasury strips are
good examples of zeroes
8-21
22. Pure Discount Bonds
Information needed for valuing pure discount bonds:
– Time to maturity (T) = Maturity date - today’s date
– Face value (F)
– Discount rate (r)
$0 $0 $0 $F
0 1 2 T −1 T
Present value of a pure discount bond at time 0:
F
PV =
(1 + r )T 8-22
23. Pure Discount Bonds: Example
Find the value of a 15-year zero-coupon bond
with a $1,000 par value and a YTM of 12%.
$0 $0 $0 $1,000 0$ 0$0,1$ 0
1 2930
02
0 1 2 29 30
F $1,000
PV = = = $174.11
(1 + r ) T
(1.06) 30
8-23
24. 8.2 Government and Corporate Bonds
• Treasury Securities
– Federal government debt
– T-bills – pure discount bonds with original maturity less
than one year
– T-notes – coupon debt with original maturity between one
and ten years
– T-bonds – coupon debt with original maturity greater than
ten years
• Municipal Securities
– Debt of state and local governments
– Varying degrees of default risk, rated similar to corporate
debt
– Interest received is tax-exempt at the federal level
8-24
25. Corporate Bonds
• Greater default risk relative to government
bonds
• The promised yield (YTM) may be higher than
the expected return due to this added default
risk
8-25
26. Bond Ratings – Investment Quality
• High Grade
– Moody’s Aaa and S&P AAA – capacity to pay is
extremely strong
– Moody’s Aa and S&P AA – capacity to pay is very
strong
• Medium Grade
– Moody’s A and S&P A – capacity to pay is strong, but
more susceptible to changes in circumstances
– Moody’s Baa and S&P BBB – capacity to pay is
adequate, adverse conditions will have more impact
on the firm’s ability to pay
8-26
27. Bond Ratings - Speculative
• Low Grade
– Moody’s Ba and B
– S&P BB and B
– Considered speculative with respect to capacity to
pay.
• Very Low Grade
– Moody’s C
– S&P C & D
– Highly uncertain repayment and, in many cases,
already in default, with principal and interest in
arrears.
8-27
28. 8.3 Bond Markets
• Primarily over-the-counter transactions with
dealers connected electronically
• Extremely large number of bond issues, but
generally low daily volume in single issues
• Makes getting up-to-date prices difficult,
particularly on a small company or municipal
issues
• Treasury securities are an exception
8-28
29. 8.4 Inflation and Interest Rates
• Real rate of interest – change in purchasing
power
• Nominal rate of interest – quoted rate of
interest, change in purchasing power and
inflation
• The ex ante nominal rate of interest includes
our desired real rate of return plus an
adjustment for expected inflation.
8-29
30. Real versus Nominal Rates
• (1 + R) = (1 + r)(1 + h), where
– R = nominal rate
– r = real rate
– h = expected inflation rate
• Approximation
–R=r+h
8-30
31. Inflation-Linked Bonds
• Most government bonds face inflation risk
• TIPS (Treasury Inflation-Protected Securities),
however, eliminate this risk by providing
promised payments specified in real, rather
than nominal, terms
8-31
32. The Fisher Effect: Example
• If we require a 10% real return and we expect
inflation to be 8%, what is the nominal rate?
• R = (1.1)(1.08) – 1 = .188 = 18.8%
• Approximation: R = 10% + 8% = 18%
• Because the real return and expected inflation
are relatively high, there is a significant
difference between the actual Fisher Effect
and the approximation.
8-32
33. 8.5 Determinants of Bond Yields
• Term structure is the relationship between
time to maturity and yields, all else equal.
• It is important to recognize that we pull out
the effect of default risk, different coupons,
etc.
• Yield curve – graphical representation of the
term structure
– Normal – upward-sloping, long-term yields are
higher than short-term yields
– Inverted – downward-sloping, long-term yields are
lower than short-term yields
8-33
34. Factors Affecting Required Return
• Default risk premium – remember bond
ratings
• Taxability premium – remember municipal
versus taxable
• Liquidity premium – bonds that have more
frequent trading will generally have lower
required returns (remember bid-ask spreads)
• Anything else that affects the risk of the cash
flows to the bondholders will affect the
required returns.
8-34
Editor's Notes
This formalizes the present value calculation.
Note that the assumed starting date is January 2009. This, however, provides a good beginning point for illustrating bond pricing in Excel, where you can specify exact beginning and ending dates. See Slide 8.23 for a link to a ready-to-go Excel spreadsheet.
Note that this example illustrates a premium bond (i.e., coupon rate is larger than the required yield).
Note that the interest rate is specified as a periodic rate, which assumes the payments setting is equal to one.
Note that this example illustrates a discount bond (i.e., coupon rate is smaller than the required yield).
The students should be able to recognize that the YTM is more than the coupon since the price is less than par.
Note the assumption of semiannual compounding.
It is a good exercise to ask students which bonds will have the highest yield-to-maturity (lowest price) all else equal. Debt rated C by Moody’s is typically in default.
Be sure to ask the students to define inflation to make sure they understand what it is.
The approximation works pretty well with “normal” real rates of interest and expected inflation. If the expected inflation rate is high, then there can be a substantial difference.