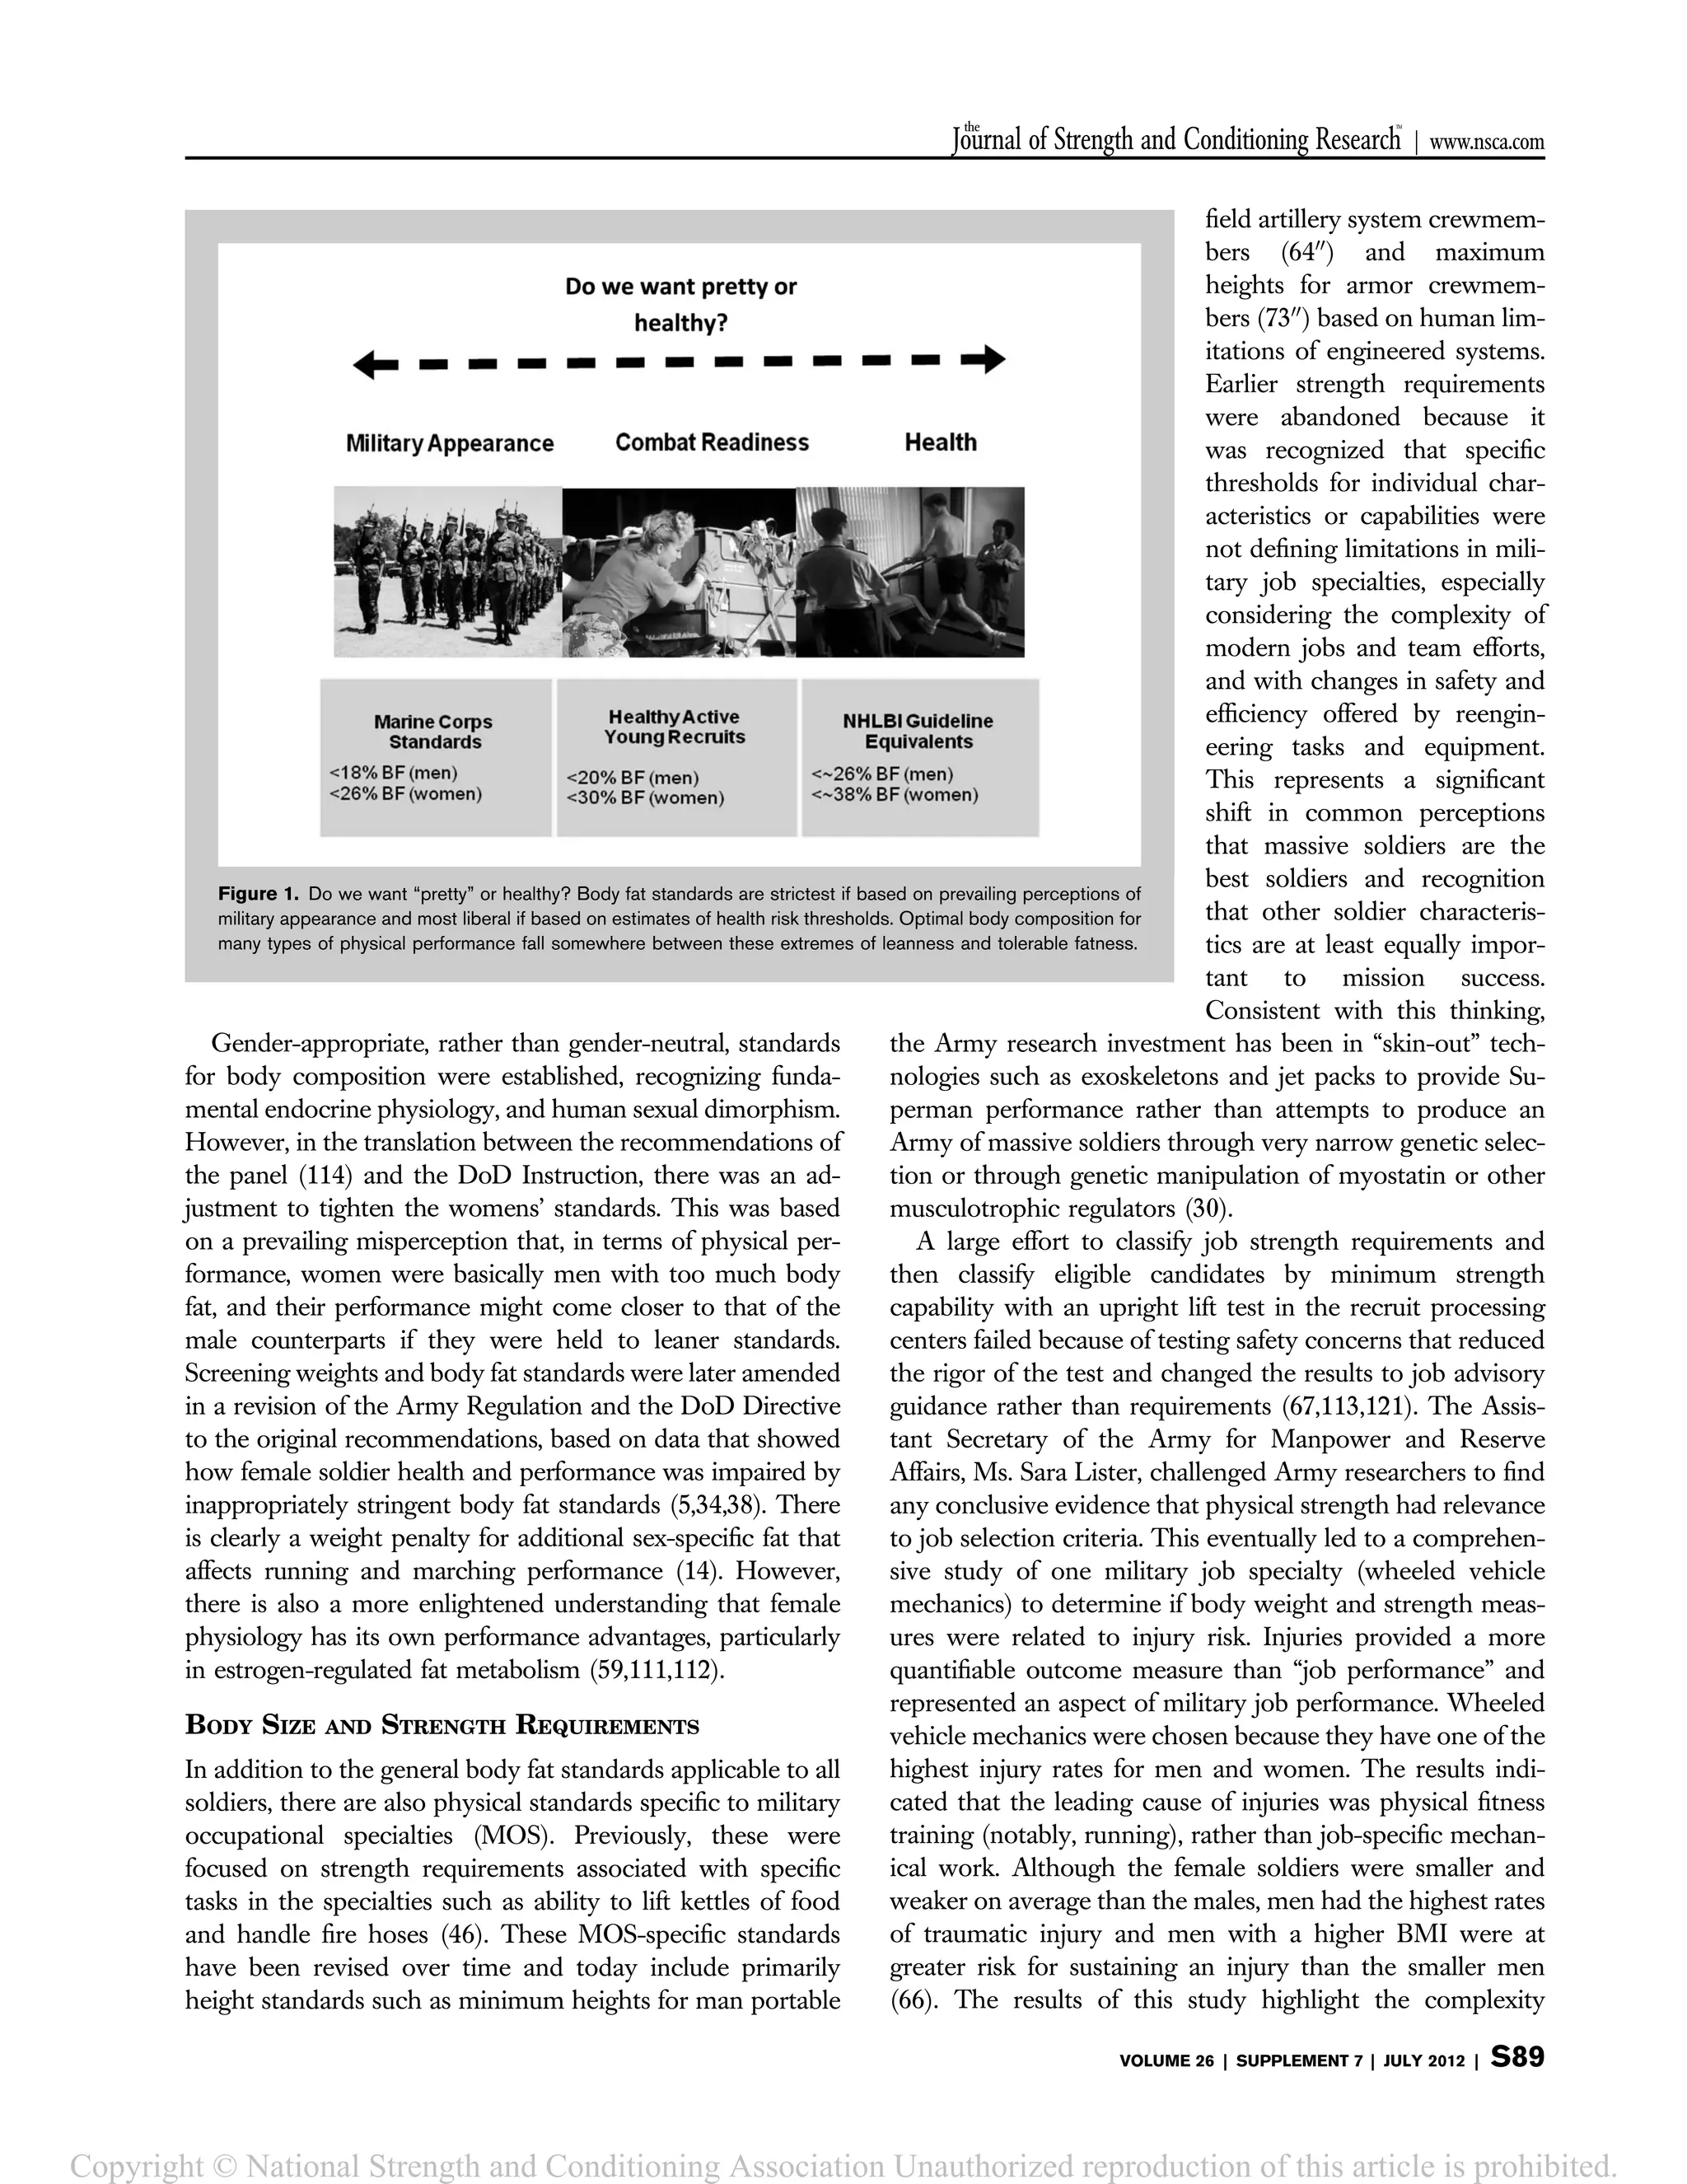
The document discusses the purpose and history of U.S. military body composition standards. It notes that standards aim to promote physical readiness while balancing health, performance, and appearance factors. Standards originated in the 1980s following recommendations that all military services adopt body fat-based programs. Gender-appropriate standards were set, though standards for women were initially tightened too much. The document also discusses how job-specific strength standards were abandoned as large size/strength were found not to define military job performance. Overall, standards seek to motivate fitness while not excluding potentially strong soldiers.


![Army age groups for men and women until the oldest group.
The oldest soldiers had median appearance ratings of only
“fair” as they approached the health-based upper limits of
body fat allowance; thus, military appearance dictates a more
stringent body fat standard than health risk thresholds (Col.
Karl E. Friedl, unpublished results, 1990).
CHRONIC HEALTH RISK ASSOCIATIONS
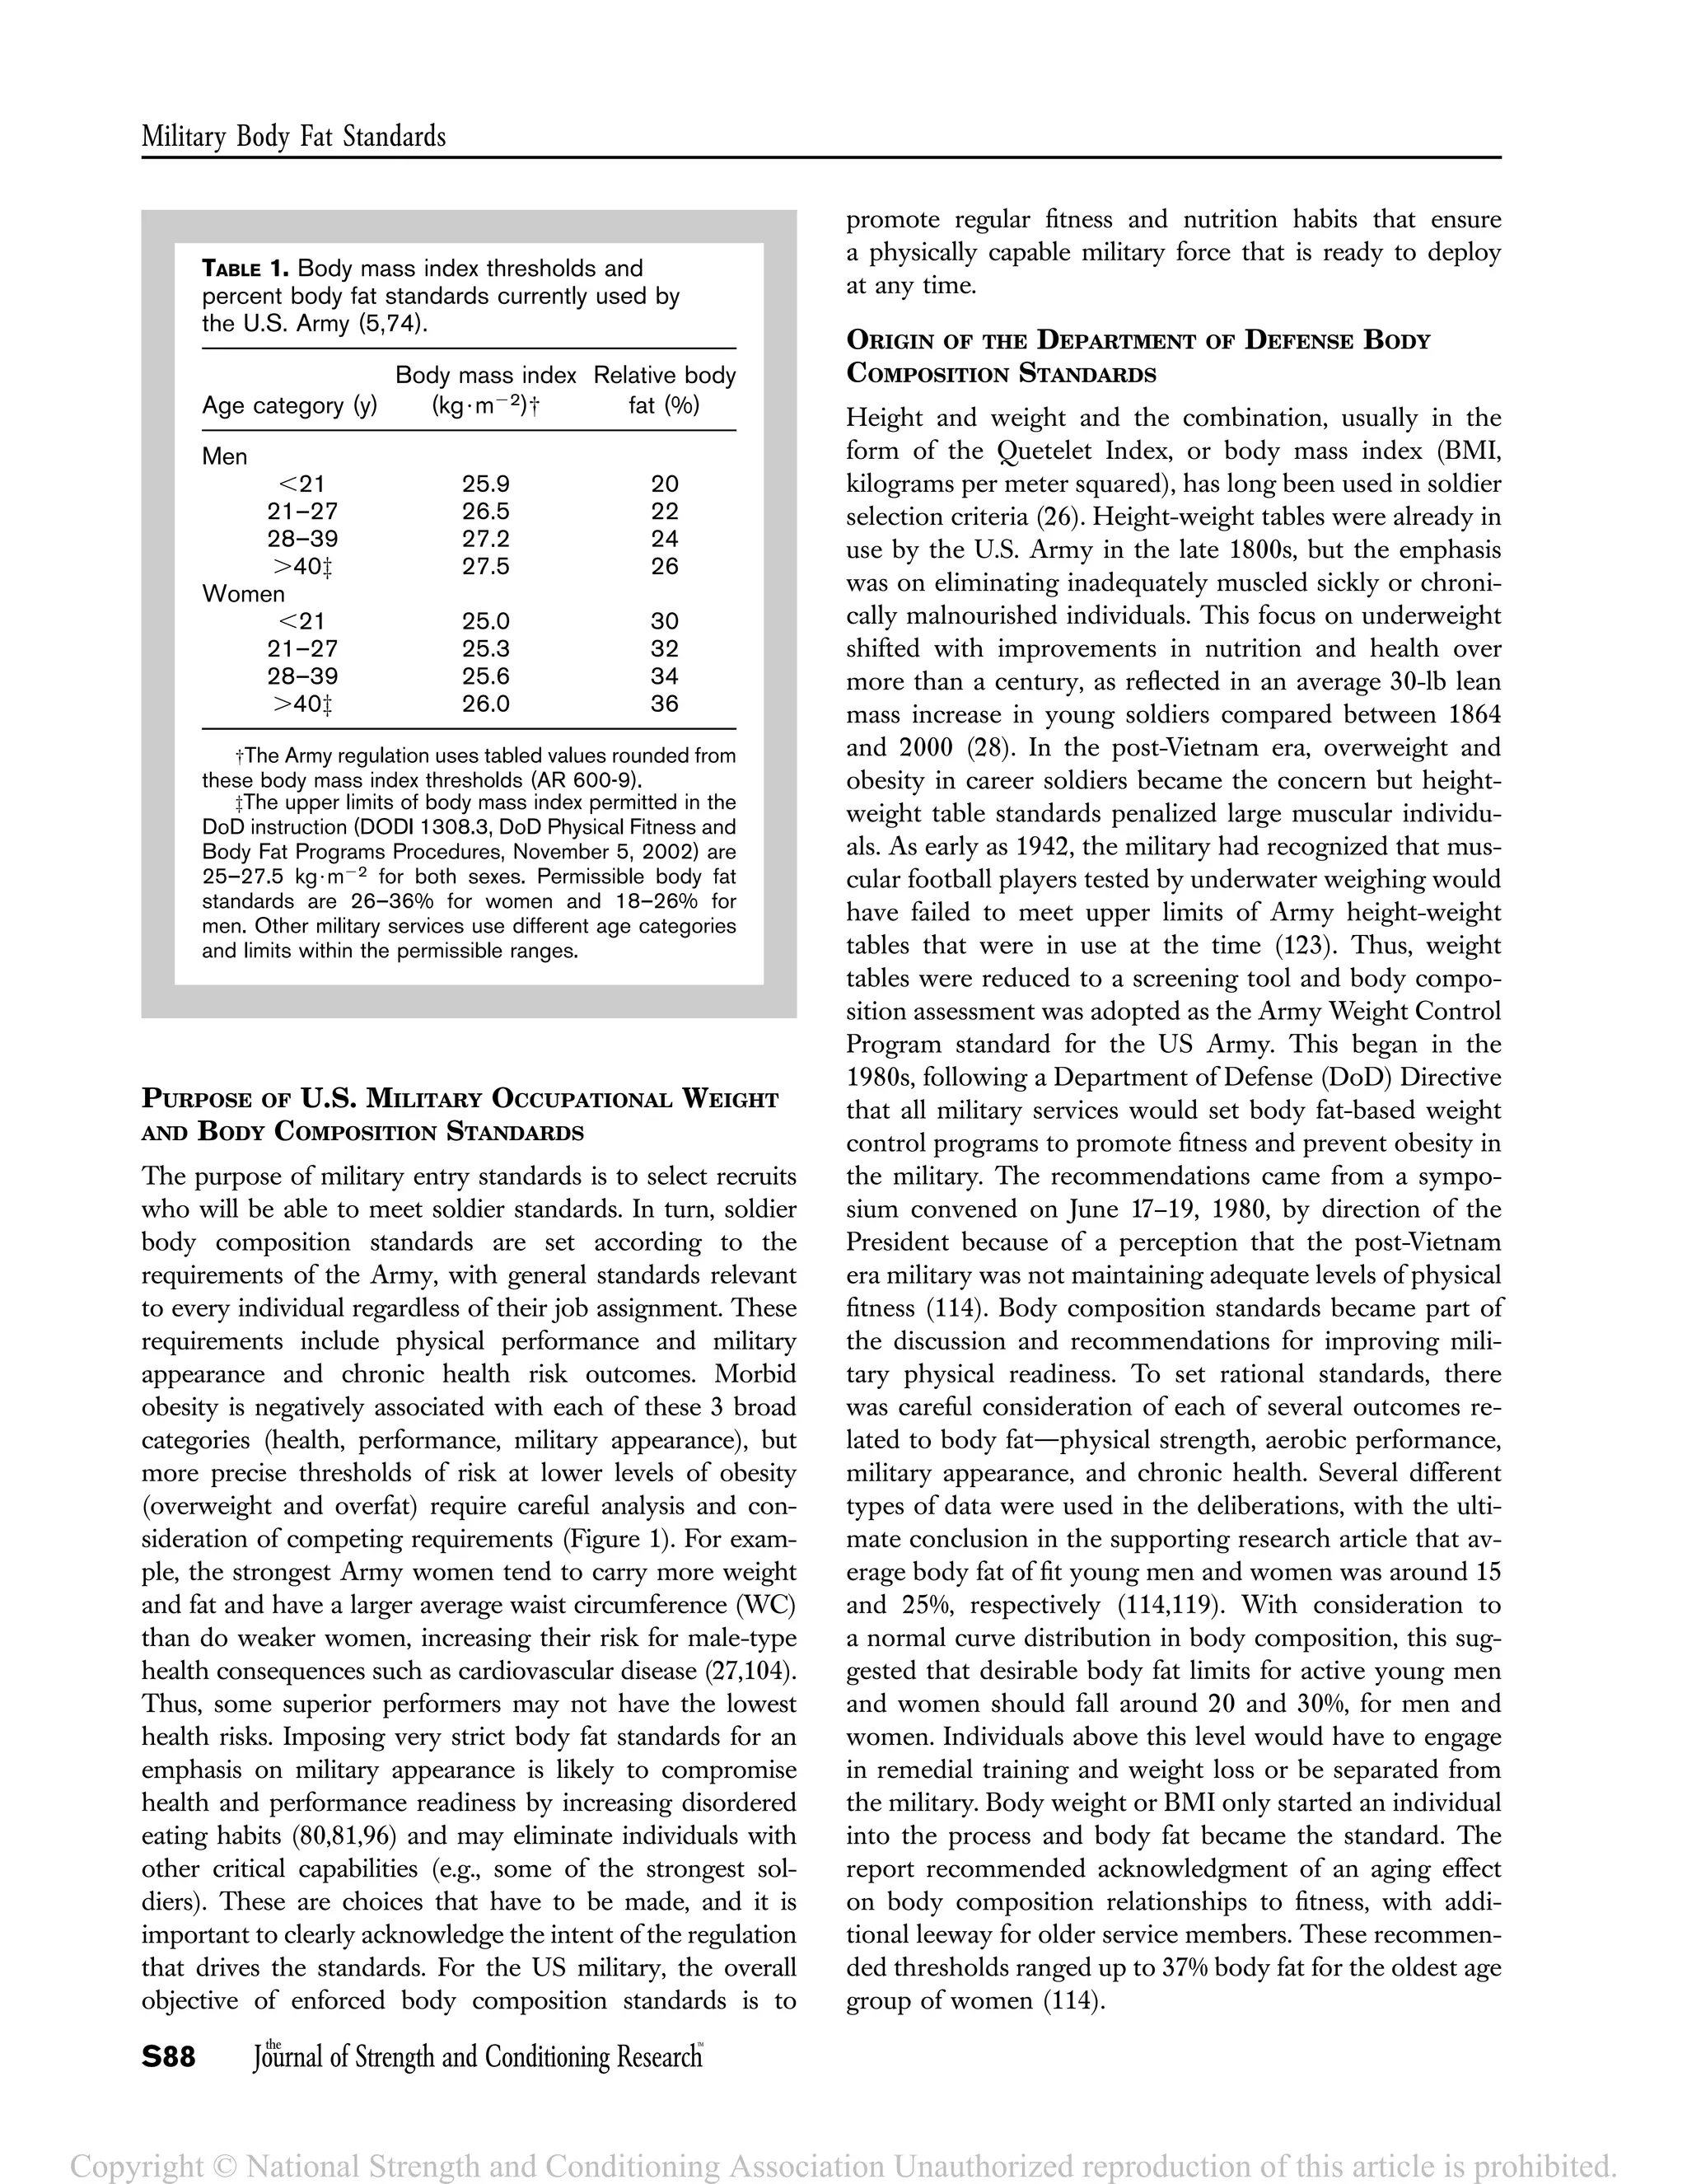
For upper limits of body fat standards at the oldest age
groups, thresholds of 26 and 36% body fat were set from
a variety of comparisons to epidemiological studies (Table 1),
with the strongest data from type 2 diabetes and overweight
associations (31,90). The screening weights that trigger
a body fat measurement in the Army regulation are BMI
of 27.5 kg$m22 (men) and 25.0 kg$m22 (women) (Table 1).
The body fat thresholds correspond to WCs of 38.500
and
35.000
for the typical male and female soldier, respectively
(31). Thus, the most liberal Army body composition stand-
ards, those applied to soldiers over age 40, map to health risk
thresholds including an approximation of the NHLBI guide-
lines for healthy body composition (BMI , 25 kg$m22;
WC , 4000
[men] and ,3500
[women]). Screening weights
are higher than BMI 25 for Army men; soldiers are larger but
leaner than the typical U.S. male because of selection and
because of the emphasis on fitness and enforced fitness test-
ing standards. If the male screening weight tables used an
upper limit of BMI 25 kg$m22, more than half of the Army
would also have to be measured for body fat in every semi-
annual evaluation required by the regulation. Thus, screening
weights extend up to BMI 27.5 kg$m22 for male soldiers.
There is a general perception that massively large men
must carry significant health risks no matter how their fat is
distributed. Although this may be true for factors such as
osteoarthritis that are suspected of an association with
biomechanical stress from increasing mass regardless of
whether it is from muscle or fat, it is not necessarily true
for cardiovascular and metabolic risks. Matsuzawa et al. (77)
highlighted this in a very interesting analysis of fat distribu-
tion and health risks in sumo wrestlers with BMI exceeding
35 kg$m22. This study demonstrated large differences in
CT-imaged intraabdominal fat distribution associated with
marked differences in biochemical health risk profiles.
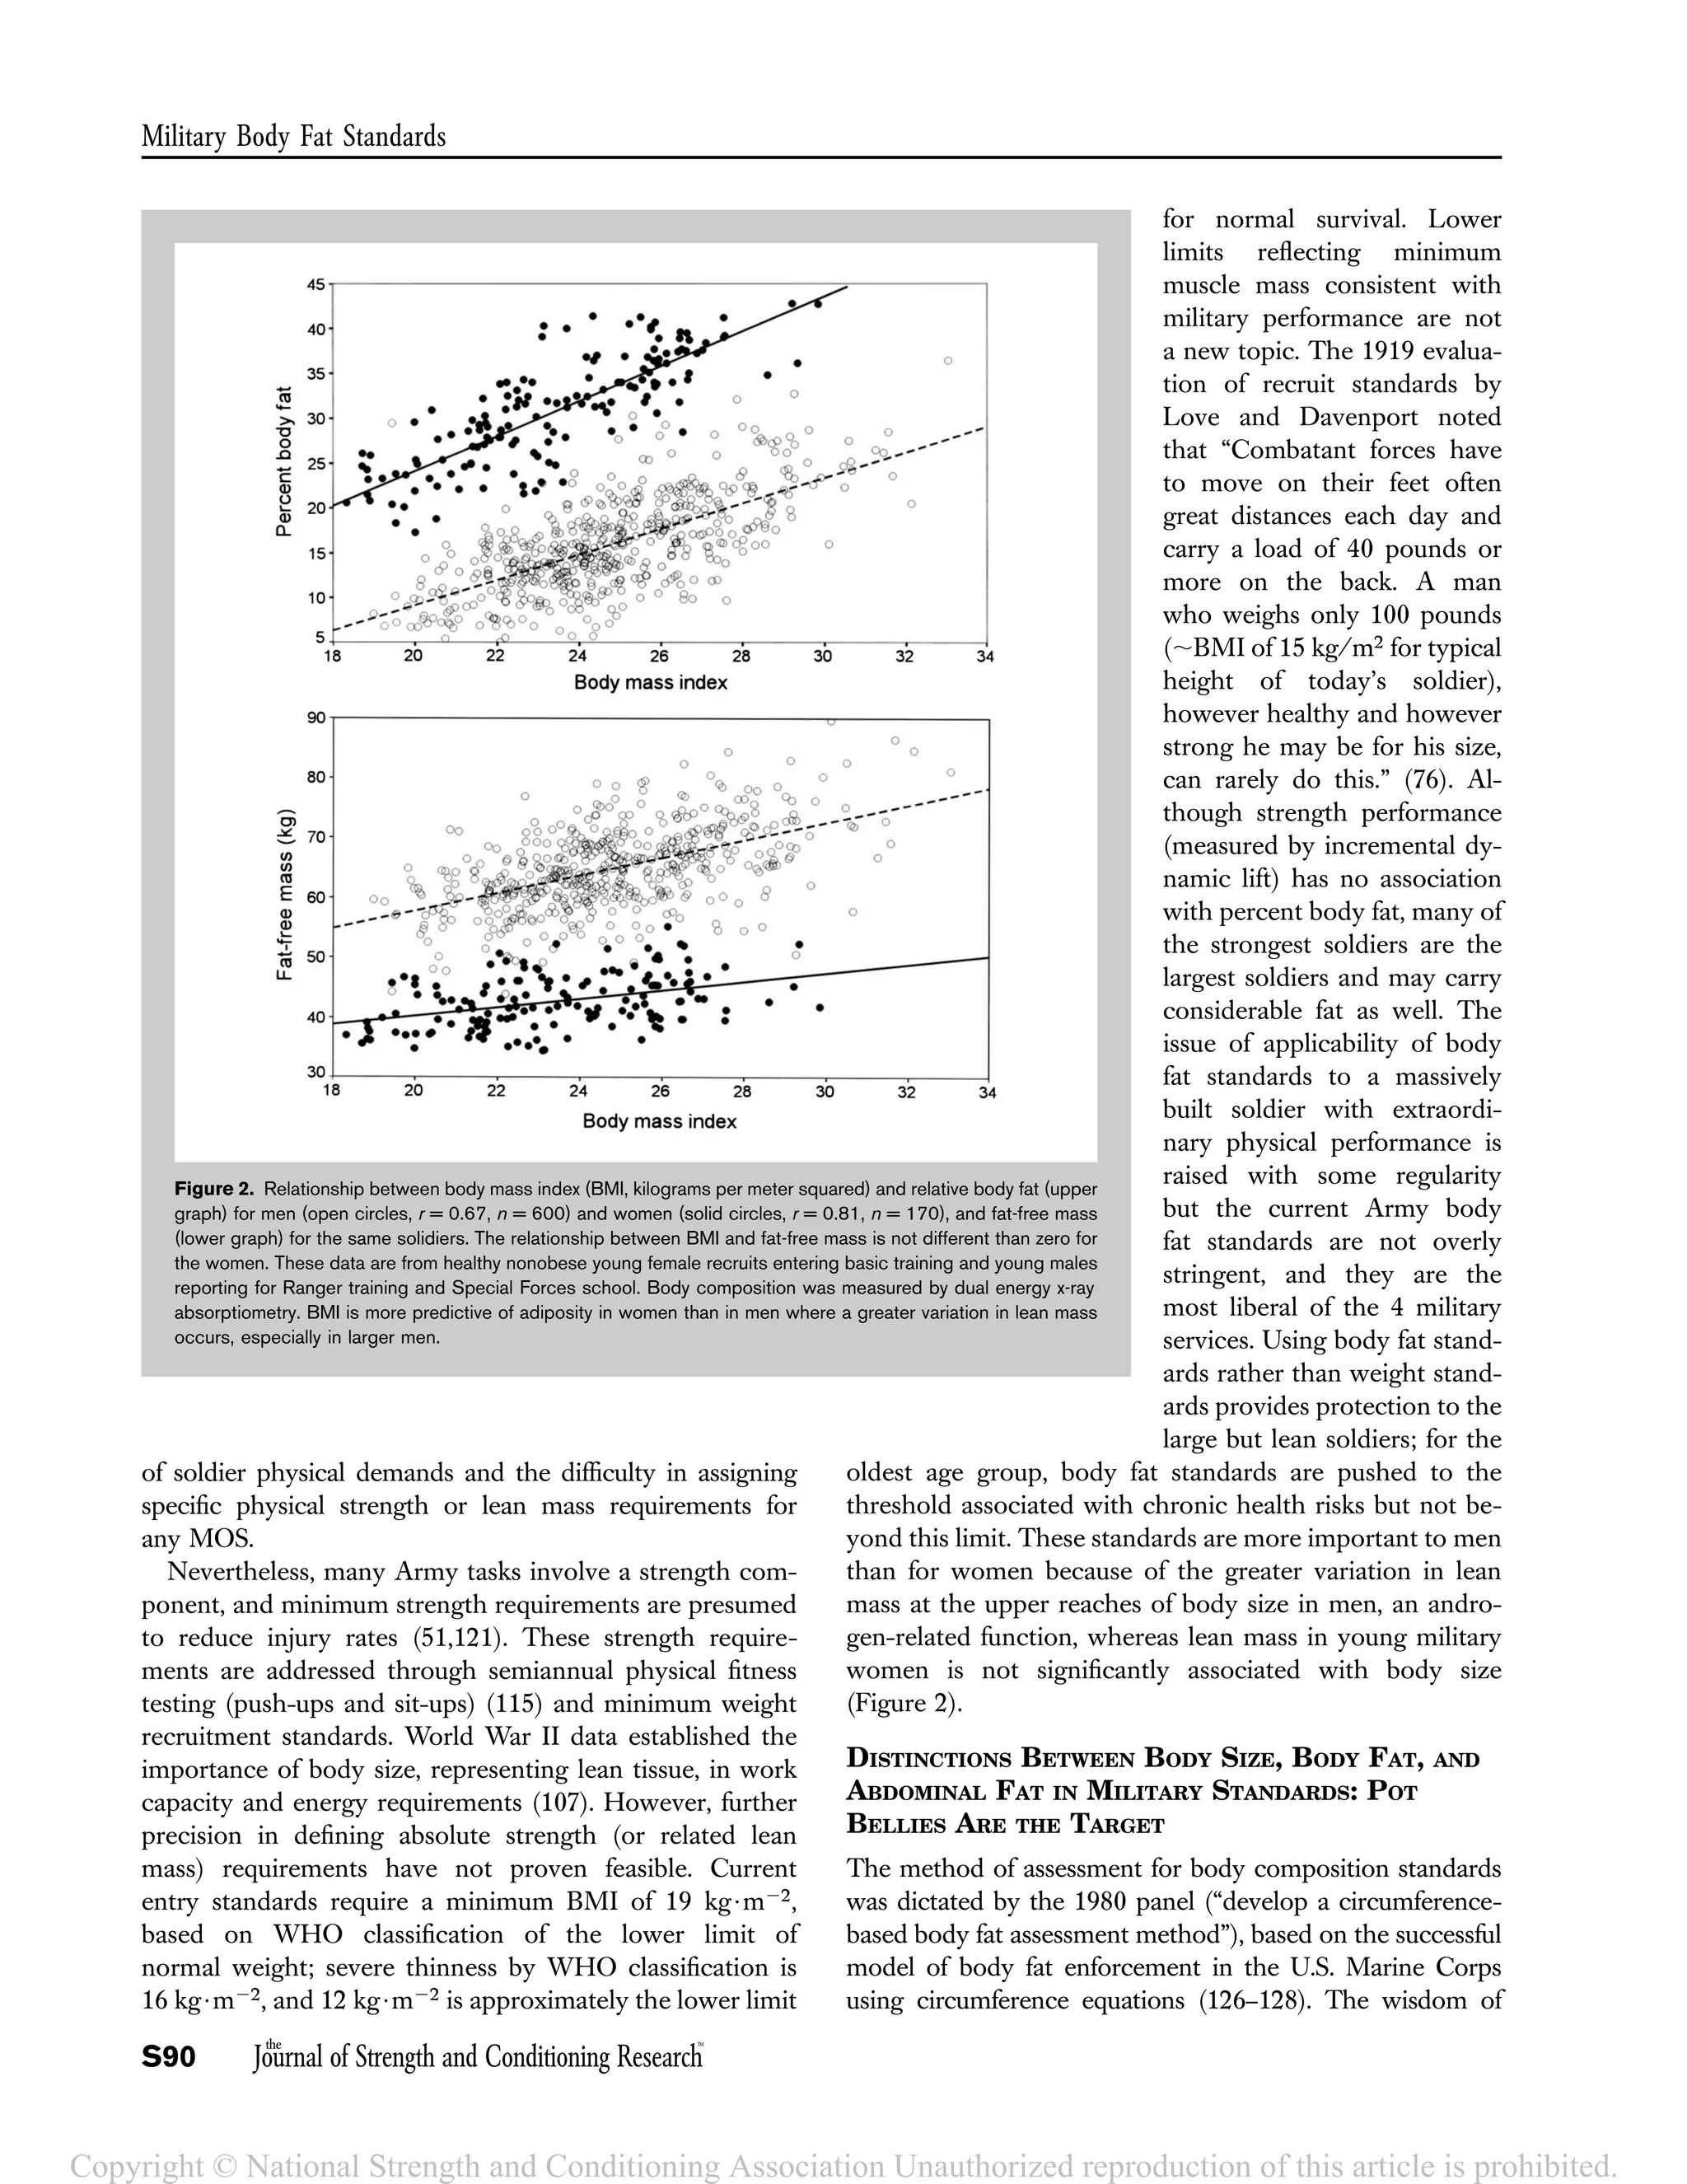
Although BMI might effectively identify overfat women
where there is no statistically significant relationship between
increasing BMI and lean mass, there is a highly significant
increase in lean mass for men and greater variability in their
adiposity with increasing BMI (Figure 2). In any case,
WC-based body fat estimation is much better associated with
male and female chronic health risks than total body fat, body
weight, or body size (BMI) (28). Even for women, intraabdo-
minal fat becomes an issue above a certain threshold of
adiposity. Kvist et al. (72) demonstrated a linear increase in
intraabdominal fat with increasing adiposity in men. In
women, intraabdominal fat remained at a minimal level with
increasing fatness until an accumulation of 30 L (;27 kg) of
total body fat, at which point a steady increase in intraabdo-
minal accumulation began. Fat deposition in other subcuta-
neous sites in women, including arms, legs, buttocks, and
breast are not generally associated with health risks and in
some cases may reflect an association with reduced cardio-
vascular and other health risks. Intraabdominal fat (detected
by WC), on the other hand, is strongly associated with
increasing health risks in women as it is with men (31).
At present, there is no plausible rationale for a more
lenient WC or body fat standard than this current U.S. Army
upper limit for men and women. A better understanding of
the interaction between physical activity and adipose tissue
physiology (i.e., “fit fat”) could change this. A proposal to
link Army physical fitness test performance with body fat
standards, allowing a sliding scale for body fat limits in the
younger age categories (74), was carefully evaluated but
ultimately deemed too complicated to implement (LTG
Timothy J. Maude, personal communication, 2001). Stricter
standards are conceivable for other populations character-
ized by slighter body builds. In 2008, Japan adopted WC
limits for men and women between age 40 and 74 years with
measurements that trigger weight management interven-
tions at 33.500
(men) and 35.400
(women) (88). Arguments
have been made for body composition standards to be
adjusted to correspond to national weight gain trends as
the Army should reflect the national population from which
recruits are drawn. Such an adjustment, or the suspension of
body fat standards, would signal a deliberate acceptance of
lower fitness and health standards. Some armies, such as the
People’s Republic of China, have been forced to ease weight
standards for recruits to reflect population trends that reflect
recruit availability (91). The good news for recruiters in
western Armies is that the increase in BMI in several other
countries with weight and health monitoring statistics
peaked around 2000 and appears to have leveled off. The
reason for this plateau in obesity rate is unexplained (87).
OTHER HEALTH AND PERFORMANCE ASSOCIATIONS
AND IMPACTS
A central tenet behind the military body fat standards is the
use of these standards to drive fitness and nutrition habits. The
standards are only fair if healthy men and women can
reasonably attain and maintain the standards through per-
sonal habits. This is a critically important point and one that
again points to the relevance of the abdominal circumference
as a key component of the military standards because this is
one of the most labile sites of fat deposition. Intraabdominal
fat as reflected by WC is sensitive to exercise and dietary
control (16,17,36,50,97). Other sites of fat deposition such as
thigh fat have a lower responsiveness to lipogenic factors and
appear to be relatively stable and immovable (94).
Weight gain after smoking cessation has been a concern
expressed by some soldiers considering giving up cigarettes.
This represents a tradeoff between 2 different types of health
risks; however, earlier data have also suggested that smokers
Journal of Strength and Conditioning Research
the TM
| www.nsca.com
VOLUME 26 | SUPPLEMENT 7 | JULY 2012 | S95
Copyright © National Strength and Conditioning Association Unauthorized reproduction of this article is prohibited.](https://image.slidesharecdn.com/jscr-s87-bodycomposition-160421145327/75/Body-composition-and-Military-Performance-9-2048.jpg)