This document is the 2020 Health of the Force Report, which analyzes health metrics and demographics of over 469,000 active duty U.S. Army soldiers. Some key findings include: over half of soldiers experienced a new injury in 2019, with most being overuse injuries; obesity rates remained at 17% overall but showed racial disparities; and behavioral health diagnoses were reported for 16% of soldiers. The report also introduces analysis by race and ethnicity to identify potential health disparities. It provides data and metrics to help Army leaders understand factors influencing medical readiness and make informed policy decisions.


![HEALTH OF THE CANINE FORCE:
MEDICAL PROBLEMS AMONG NON-DEPLOYED MILITARY WORKING DOGS
S P O T L I G H T
Top 5 Medical Conditions Among Active MWDs,
as Reported in the Remote Online Veterinary
Record, February 2014 – July 2017
*Relating to nourishment or sustenance
Source: APHC 2019a
Master Problem
List Entries
MWDs affected
Counts
0
100
200
300
400
500
600
Derm
atologic
Alim
entary*
Dental
Soft tissue injury
M
usculoskeletal
S
INCE WORLD WAR I, THE U.S. MILITARY HAS
used Military Working Dogs (MWDs) in a variety
of capacities, including explosive detection, drug
detection, patrol/attack work, and special operations
support. Despite the long-term use of MWDs, compre-
hensive MWD medical data has not often been re-
ported in the scientific literature, especially for MWDs
in non-deployed settings. This lack of published litera-
ture limits the identification of trends or areas of focus
that could potentially guide future veterinary medical
support of MWDs.
Because MWDs are a valuable military resource, achiev-
ing a better understanding of their common medical
problems is crucial for keeping them healthy and mis-
sion-ready. Furthermore, better knowledge of MWD
medical data may also improve readiness and training
focus among the U.S. Army Veterinary Corps Officers
specifically responsible for the comprehensive veteri-
nary medical care of MWDs.
A recent study investigated all medical problems
recorded in the DOD Remote Online Veterinary Re-
cord for a population of young, non-deployed MWDs
(n=762) participating in initial entry training or provid-
ing support to their assigned permanent home sta-
tions (APHC 2019a). Medical problems for this popula-
tion were recorded on the Master Problem List (2,416
entries) by an attending veterinarian during MWD visits
to a veterinary treatment facility. Results are shown in
the figure, organized by previously established cate-
gorizations for MWD medical problems (Takara et al.
2014; Mey et al. 2019). Risk factors for the five leading
conditions (dermatologic, alimentary [nutritional], den-
tal, soft tissue, and musculoskeletal) were investigated.
While they varied by condition, common risk factors for
MWD medical conditions included sex, spay/neuter sta-
tus, breed, and occupational duty certification.
Assessing the training and work environments is
recommended to identify unnecessary exposures to
hazards, as well as additional preventive strategies for
MWDs at greater risk for medical conditions. Future ef-
forts should collect demographic and hazard exposure
information on all MWDs, potentially through future
annual and post-deployment handler surveys.
THE 2019 COMMUNITY STRENGTHS
AND THEMES ASSESSMENT REPORT
S P O T L I G H T
E
VERY 2 YEARS, ARMY COMMUNITIES AROUND
the globe use the Community Strengths and
Themes Assessment (CSTA) to gather feedback
from Service members, their spouses, and adult Fam-
ily members; Retirees; and DA Civilians. The CSTA is a
public health survey tool used to support each Army
installation’s assessment of its community’s perspec-
tives. Questions focus on the five domains of public
health: physical, emotional, family, spiritual, and
social/environmental. Each local Commander’s Ready
and Resilient Council (CR2C) works with the APHC to
conduct the CSTA over a 3-month period, after which
the results are compiled and a report is provided to
local leadership.
Key Findings of the 2019 CSTA Report
Top strengths among respondents included the
diversity of the Army community, recreation activities,
clean environments, and safe neighborhoods. Over-
whelmingly, respondents viewed their communities
as healthy and resilient.
30%of respondents indicated
a belief that seeking help
will negatively impact their career.
Most Frequently Cited Concern for Each Public Health Domain, 2019
Physical Health Emotional Health Spiritual Health Family Health
Social/Environmental
Health
35%
poor diet
51%
stress
43%
no concerns
57%
work-life
balance
32%
financial
issues
For a majority of respondents, the most frequently
cited issues of concern were work-life balance, finan-
cial issues, stress, depression, overweight/obesity, and
lack of family time or community connections (see
figure). Qualitative feedback included reoccurring
themes of high operational tempo, stress, and fund-
ing competing demands with limited resources.
Respondents also reported stigma from seeking help
and accessing resources related to emotional needs.
Thirty percent (30%) of respondents indicated a belief
that seeking help will negatively impact their career;
26% indicated that doing so was unlikely to impact
their career. Informal support networks such as
talking with a friend or chaplain were preferred.
The full 2019 Army CSTA Report is available from the
APHC Health Promotion Operations Division, https://
iphc.amedd.army.mil/organization/HPW/Pages/
HealthPromotionOperations.aspx. Community- and
command-specific CSTA results are available through
the local CR2C.
The CSTA is an important tool with which Army Com-
munity members can make their voices heard. Please
consider participating in your installation’s next CSTA.
INTRODUCTION 15
14 2020 HEALTH OF THE FORCE REPORT
Introduction](https://image.slidesharecdn.com/2020-hof-report-210702001105/85/2020-Army-Health-of-the-Force-10-320.jpg)


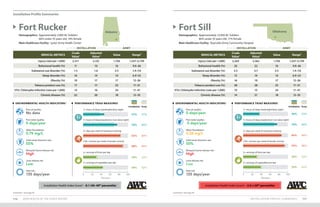


7+hoursofsleep[weeknights](%)
7+hoursofsleep[weekends](%)
7+hoursofsleep[weekends](%)
150+minutesperweek
ofaerobicactivity*(%)
150+minutesperweek
ofaerobicactivity*(%)
2+daysperweekof
resistancetraining(%)
2+daysperweek
ofresistancetraining(%)
2+servingsoffruitsperday(%)
2+servingsoffruitsperday(%)
2+servingsofvegetablesperday(%)
2+servingsofvegetablesperday(%)
Army 37 69 84 90 33 42 Army 37 69 84 90 33 42
Performance Triad Performance Triad](https://image.slidesharecdn.com/2020-hof-report-210702001105/85/2020-Army-Health-of-the-Force-76-320.jpg)


![METHODS 163
162 2020 HEALTH OF THE FORCE REPORT
Appendices
7. Heat Risk
The metric for heat risk reflects the number of days in a year when outdoor temperatures heighten
the risk of heat-related health impacts, and whether the year of interest is consistent or different
from the prior 10-year period. Heat risk days are calculated as the number of days in a calendar year
with at least one hour when the heat index is above 90⁰F. This corresponds to an outdoor heat sta-
tus of “Extreme Caution” as classified by the National Weather Service.
Hourly measurements for outdoor temperature and relative humidity are obtained from land-based
airport weather stations in closest proximity to installation cantonment areas or population centers.
Using these data, the U.S. Air Force 14th
Weather Squadron computes hourly heat index values for
each location of interest. Annual heat risk days are calculated for the year of interest and each of the
10 years prior to the year of interest. The mean and standard deviation (SD) for the prior 10 years are
calculated. Annual heat risk days for the year of interest are compared to the prior 10-year average ±
1 SD to show whether the year of interest is consistent with the prior decade.
VI. Installation Health Index (IHI)
The core metrics included in this report were prioritized for inclusion and weighting in the IHI
calculation based on the prevalence of the condition or factor, the potential health or readiness
impact, the preventability of the condition or factor, the validity of the data, supporting evidence,
and the importance to Army leadership. Although behavioral health impacts readiness, the behav-
ioral health medical metric was removed from the IHI in 2018 to avoid stigmatizing Soldiers who
seek treatment, and because treatment options for behavioral health conditions are not uniformly
available across all installations.
In generating the IHI, six selected medical metrics (injury, obesity, sleep disorders, chronic disease,
tobacco product use, and STIs [chlamydia]) for each included installation were individually stan-
dardized to the average across these installations using z-scores. Z-scores follow a standard normal
distribution, and reflect the number of standard deviations (amount of variation in data values for a
given metric) the installation is from the average for that medical metric. Values above the average
have positive z-scores, while values below the average have negative z-scores.
Installation medical metrics were adjusted by age and sex prior to standardization to allow more
valid comparisons. The 2015 U.S. Army population distribution was used as the standard based on
an assessment of reasonable contenders conducted by the APHC (Watkins et al. 2018). Direct stan-
dardization techniques were used whereby crude installation rates for each population strata (i.e.,
males 17–24, females 17–24,….,males 45–64, and females 45–64) were multiplied by the standard
and summed across strata to compute the installation adjusted rates. The same technique was
used when comparing Army rates to U.S. population rates for similarly defined metrics (i.e., obesity,
tobacco, and chlamydia). In these cases, both the Army and U.S. rates were adjusted to the standard.
In addition to the six age- and sex-adjusted medical measures, the IHI also includes one unadjusted
installation environmental health metric: number of poor air quality days. The air quality data are
not normally distributed, and vary widely by geographic location, particularly for installations
outside the U.S., where the number of poor air quality days were especially high relative to the
mean across all installations. Accordingly, the number of poor air quality days at each installation
was scored as follows for use in calculating the IHI: installations with missing or non-reported air
quality data received an air quality score of 0, and thus do not affect the IHI score; installations with
no reported poor air quality days received an air quality score of 2, the highest (best) possible score;
installations with between 1 and 4 poor air quality days received an air quality score of 1; installa-
tions with between 5 and 20 poor air quality days received an air quality score of -1; and installations
with greater than 20 poor air quality days received an air quality score of -2, the lowest (worst) possi-
ble score. These categories align with those used in the Environmental Health Indicator – Air Quality
section of Health of the Force.
Each installation’s IHI is a standardized score (z-score) calculated by pooling the metric-specific
scores for that installation. Metric-specific scores were weighted to prioritize readiness detractors,
as follows: injury–30%, sleep disorders–15%, obesity–15%, chronic disease–15%, tobacco product
use–15%, STI (chlamydia)–5%, and air quality–5%. The resulting weighted averages of these metrics
were then standardized using the mean and standard deviation across all installations presented
in Health of the Force (with the exception of JBLM and PoM, which had incomplete medical data) to
create the IHI score for each installation.
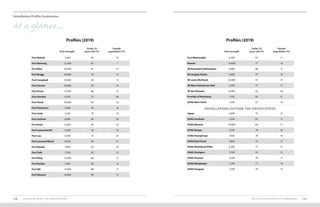
For ease of interpretation, the IHI is presented as a percentile as well as a z-score. The IHI percentile is
equal to the area under the standard normal probability distribution for each installation’s IHI score.
The IHI percentiles are categorized as follows: 20%, 20–29%, 30–39%, 40–49%, 50–59%, 60–69%,
70–79%, 80–89%, and ≥90%. Higher percentiles reflect more favorable health status.
Normally Distributed Data Curve
50
16 84 98 99.9
2
0.1
1
-1
Average
-2
-3 2 3 IHI Score
Percentile](https://image.slidesharecdn.com/2020-hof-report-210702001105/85/2020-Army-Health-of-the-Force-84-320.jpg)
![METHODS 165
164 2020 HEALTH OF THE FORCE REPORT
Appendices
VII. Installation Profile Summaries
The installation profile summary pages report population estimates, and age and sex distributions.
Population estimates were derived from person-time calculated from DMDC personnel rosters.
Person-time, which is analogous to Full-Time Equivalents (FTE), estimates the average number of
Soldiers at an installation during the year. Installation assignments for AC Soldiers and trainees
(excluding cadets) were determined by unit ZIP code.
Installations with a high turnover, such as those with a large trainee population, may not be accus-
tomed to calculating their population size in this way. These estimates are intended to be a frame of
reference and do not necessarily correspond to the population evaluated for each metric included in
the installation profile summary and report.
VIII. Data Limitations
• Methodology changes from prior Health of the Force reports prevent direct comparisons of measures
across the reports. Updated trend charts are provided for affected metrics, and additional details
regarding installation demographics and metric components are included to provide clarity.
• Higher estimates for a metric may not be indicative of a problem but rather may reflect a greater
emphasis on detection and treatment.
• Composite measures or indices such as the IHI may mask important differences seen at the individ-
ual metric level. It is important to examine the components for which more targeted prevention
programs can be developed.
• Personnel and medical data for cadets were not available; therefore, USAG West Point estimates
using DMDC-derived data are limited to permanent party AC Soldiers.
• Metrics based on ICD-9-CM and ICD-10-CM codes entered in patient medical records are subject to
coding errors. Estimates may also be conservative given that individuals may not seek care or may
choose to seek care outside the MHS or the TRICARE claims network.
• The obesity proportions among populations reported in Health of the Force are estimated from BMIs
recorded for a subset of the population at clinical encounters. BMI alone should not be used to diag-
nose obesity in individuals.
• Measures based on self-reported data (Azimuth Check and PHA) are limited to a subset of the popu-
lation (i.e., survey respondents) and may be prone to biases.
• The STI (chlamydia) and heat illness metrics rely on reporting compliance. STI (chlamydia) estimates
are conservative given the high proportion of asymptomatic infections that are undetected.
• Azimuth Check data used for the P3 measures were aggregated across demographic strata, and
counts below 40 were not reported. Thus, age and sex adjustments for the installations were not
possible.
• DMDC race and ethnicity data were not sufficiently detailed to determine which Soldiers identified
as multi-racial. Conflicting entries were also possible over the 5-year timeframe; in this situation,
the most frequently used entry was selected.
• The Air Quality EHI relies on outdoor ambient air monitoring data that were deemed representa-
tive of air pollution levels experienced by the population working and living in the locale where
the Army installation is situated. The metric does not reflect exposures from indoor air pollution
sources.
• The Solid Waste Diversion EHI relies on SWARWeb solid waste generation and diversion data that
may reflect estimates rather than the actual weight of materials.
• The Mosquito-borne Disease EHI relies on mosquito specimens acquired by installations and for-
warded to the supporting Public Health Command Region for identification and pathogen testing.
Robustness of the risk characterizations is dependent upon installation surveillance programs
collecting specimens and ensuring delivery to the supporting region for identification and testing.
• The Tick-borne Disease EHI relies on tick specimens submitted to the MilTICK for identification
and pathogen testing. Robustness of the risk estimate is dependent upon installation populations
submitting human ticks to the MilTICK for analysis.
Appendices
Suggested citation:
U.S. Army Public Health Center. 2020. 2020 Health of the Force, [https://phc.amedd.army.mil/topics/campaigns/hof].](https://image.slidesharecdn.com/2020-hof-report-210702001105/85/2020-Army-Health-of-the-Force-85-320.jpg)


![Appendices
REFERENCES 173
172 2020 HEALTH OF THE FORCE REPORT
Congressional Research Service (CRS). 2019. Military and Intimate Partner Violence: Background and Issues for Congress.
December 4, 2019,
https://crsreports.congress.gov/product/pdf/R/R46097
Dada, E.O., M.K. Anderson, T. Grier, J.A. Alemany, and B.H. Jones. 2017. Sex and age differences in physical
performance: A comparison of Army basic training and operational populations. J Sci Med Sport 20(Suppl 4):S68–
S73.
doi: 10.1016/j.jsams.2017.10.002
Dahl, K., and S. Udvardy. 2019. US Military on the Front Lines of Extreme Heat,
https://www.ucsusa.org/resources/us-military-bases-risk-extreme-heat (accessed 13 February 2020).
De Borba, A., Jost, R., Gass, R. et al. 2014. The influence of active and passive smoking on the cardiorespiratory fitness
of adults. Multidiscip Respir Med 9(1):34.
doi: 10.1186/2049-6958-9-34
Department of the Army (DA). 2020a. Strategic Management System (SMS) [database],
https://www.sms.army.mil/
DA. 2020b. Field Manual 7–22, Holistic Health and Fitness,
https://armypubs.army.mil
DA. 2020c. Family Advocacy Program (FAP) Army Central Registry,
https://www.myarmyonesource.com/familyprogramsandservices/familyprograms/familyadvocacyprogram/
default.aspx (accessed 15 September 2020).
DA. 2020d. Army Combat Fitness Test [website],
https://www.army.mil/acft/
DA. 2020e. Assistant Secretary of the Army (Installations, Energy Environment) Memorandum, Updated Army Climate
Assessment Tool Launch, 28 July 2020; Washington, D.C.
DA. 2019. Regulation 600–9, The Army Body Composition Program,
https://armypubs.army.mil
DA. 2018. Careers and Jobs. Civilian Careers,
https://www.goarmy.com/careers-and-jobs/army-civilian-careers.html (accessed 9 October 2020).
DA. 2015. Regulation 600–63, Army Health Promotion,
https://armypubs.army.mil
DA. 2014. Regulation 350–53, Comprehensive Soldier and Family Fitness,
https://armypubs.army.mil
Department of Defense (DOD). 2020a. Force Risk Reduction [website],
https://joint.safety.army.mil/Pages/home.html (accessed 9 October 2020).
DOD. 2020b. You Can Quit 2 [website],
https://www.ycq2.org/
DOD. 2016a. Manual 6400.01, Volume 3, Family Advocacy Program (FAP): Clinical Case Staff Meeting (CCSM) and Incident
Determination Committee (IDC),
https://www.esd.whs.mil/Portals/54/Documents/DD/issuances/dodm/640001m_vol3.pdf
DOD. 2016b. Form 3024, Annual Periodic Health Assessment,
http://www.esd.whs.mil/dd
DOD. 2016c. Department of Defense Instruction (DoDI) 4715.23, Integrated Recycling and Solid Waste Management.
Change 1, August 31, 2018;
https://www.esd.whs.mil
Dickin, D.C., and J.B. Doan. 2008. Postural stability in altered and unaltered sensory environments following fatiguing
exercise of lower extremity joints. Scand J Med Sci Sports 18(6):765–772.
doi: 10.1111/j.1600-0838.2007.00760.x
Dinkeloo, E., T. Grier, R. Brooks, and B.H. Jones. 2020. Vaping, Smoking, and the Physical Fitness of Active Young Men:
A Study of U.S. Army Soldiers. Am J Prev Med 58(1):e31–e37.
doi: 10.1016/j.amepre.2019.08.015
Eisen, R.J., L. Eisen, and C.B. Beard. 2016. County-scale distribution of Ixodes scapularis and Ixodes pacificus (Acari:
Ixodidae) in the continental United States. J Med Entomol 53(2): 349–386.
doi: 10.1093/jme/tjv237
European Environment Agency (EEA). 2017. Indicator assessment: waste recycling. Municipal waste recycled and
composted in Europe,
https://www.eea.europa.eu/data-and-maps/indicators/waste-recycling-1/assessment-1 (accessed 6 October
2020).
Friedl, K.E. 2012. Body composition and military performance—many things to many people. J Strength Cond Res
26(Suppl 2):S87–S100.
doi: 10.1519/JSC.0b013e31825ced6c
Friedl, K.E., Knapik, J.J., Häkkinen, K., et al. 2015. Perspectives on aerobic and strength influences on military physical
readiness: report of an international military physiology roundtable. J Strength Cond Res 29(Suppl 11):S10–S23.
doi: 10.1519/JSC.0000000000001025
Fullagar H., Skorski S., Duffield R., et. al. 2015. Sleep and athletic performance: the effects of sleep loss on exercise
performance, and physiological and cognitive responses to exercise. Sports Med 45(2):161–186.
doi: 10.1007/s40279-014-0260-0
Gallagher, D., S.B. Heymsfield, M. Heo, S.A. Jebb, P.R. Murgatroyd, and Y. Sakamoto. 2000. Healthy percentage body
fat ranges: an approach for developing guidelines based on body mass index. Am J Clin Nutr 72(3): 694–701.
doi: 10.1093/ajcn/72.3.694
Ghanem, K.G. 2018. Clinical manifestations and diagnosis of Neisseria gonorrhoeae infection in adults and
adolescents. UpToDate® [website],
https://www.uptodate.com/contents/clinical-manifestations-and-diagnosis-of-neisseria-gonorrhoeae-infection-
in-adults-and-adolescents
Grier T., E. Dinkeloo, M. Reynolds, and B.H. Jones. 2020. Sleep duration and musculoskeletal injury incidence in
physically active men and women: A study of U.S. Army Special Operation Forces Soldiers. Sleep Health 6(3):344–
349.
doi: 10.1016/j.sleh.2020.01.004
Haibach, J.P., G.G. Homish, and G.A. Giovino. 2012. A longitudinal evaluation of fruit and vegetable consumption and
cigarette smoking. Nicotine Tob Res 15(2):355–363.
doi: 10.1093/ntr/nts130
Hyman, J., R. Ireland, L. Frost, and L. Cottrell. 2012. Suicide incidence and risk factors in an active duty US military
population. Am J Public Health 102(Suppl 1):S138–S146.
doi: 10.2105/AJPH.2011.300484](https://image.slidesharecdn.com/2020-hof-report-210702001105/85/2020-Army-Health-of-the-Force-89-320.jpg)

![Appendices
REFERENCES 177
176 2020 HEALTH OF THE FORCE REPORT
Pierce, J.R., DeGroot, D.W., Grier, T.L., et al. 2017. Body mass index predicts selected physical fitness attributes but is not
associated with performance on military relevant tasks in U.S. Army Soldiers. J Sci Med Sport 20(suppl 4):S79–84.
doi: 10.1016/j.jsams.2017.08.021
Public Law (PL) 116–285—JAN. 01, 2021, National Defense Authorization Act for Fiscal Year 2021,
https://www.congress.gov/bill/116th-congress/house-bill/6395/text/pl?overview=closed (accessed 11 March 2021).
Raifman, M.A., and J.R. Raifman. 2020. Disparities in the Population at Risk of Severe Illness From COVID-19 by Race/
Ethnicity and Income. Am J Prev Med 59(1):137–139.
https://doi.org/10.1016/j.amepre.2020.04.003
Reinhold, J.M., C.R. Lazzari, and C. Lahondère. 2018. Effects of the Environmental Temperature on Aedes aegypti and
Aedes albopictus Mosquitoes: A Review. Insects 9(4):158.
doi: 10.3390/insects9040158
Rentsch, C.T., Kidwai-Khan, F., Tate, J.P., et al. 2020. Patterns of COVID-19 testing and mortality by race and ethnicity
among United States veterans: A nationwide cohort study. PLoS Med 22;17(9):e1003379.
https://doi.org/10.1371/journal.pmed.1003379
Rivera, L.O., J.D. Ford, M.M. Hartzell, and T.A. Hoover. 2018. An Evaluation of Army Wellness Center Clients’ Health-
Related Outcomes. Am J Health Promot 32(7):1526–1536.
doi: 10.1177/0890117117753184
Rozzi, S.L., S.M. Lephart, and F.H. Fu. 1999. Effects of muscular fatigue on knee joint laxity and neuromuscular
characteristics of male and female athletes. J Athl Train 34(2):106–114.
https://pubmed.ncbi.nlm.nih.gov/16558552/
Sakai H., S. Tanaka, H. Kurosawa, and A. Masujima. 1992. The effect of exercise on anterior knee laxity in female
basketball players. Int J Sports Med 13(7):552–554.
doi: 10.1055/s-2007-1024562
Sapkota, A., A.P Chelikowsky, K.E. Nachman, and B. Ritz. 2010. Exposure to particulate matter and adverse birth
outcomes: A comprehensive review and meta-analysis. Air Qual Atmos Health, 5(4):1–13.
https://doi.org/10.1007/s11869-010-0106-3
Takara, M.S., and K. Harrell. 2014. Noncombat-related injuries or illnesses incurred by military working dogs in a
combat zone. J Am Vet Med Assoc 245(10):1124–1128.
doi: 10.2460/javma.245.10.1124
Title 62, Federal Register 58782, Notice of Decision, Revisions to the Standards for the Classification of Federal Data on
Race and Ethnicity, October 30, 1997,
https://www.govinfo.gov/content/pkg/FR-1997-10-30/pdf/97-28653.pdf (accessed 8 January 2021).
Tomita, A., Cuadros, D.F., Burns, J.K., et al. 2020. Exposure to waste sites and their impact on health: a panel and
geospatial analysis of nationally representative data from South Africa, 2008–2015. Lancet Planet Health
4(6):e223–e234.
doi: 10.1016/S2542-5196(20)30101-7
United States Forces Korea (USFK). 2020. Regulation 40–6, USFK Air Quality Policy,
https://www.usfk.mil/Portals/105/USFK%20Air%20Quality%20Policy%202020%20Signature.pdf (accessed 24
August 2020).
U.S. Army Corps of Engineers (USACE). 2020. Army Climate Resilience Handbook. Prepared by Pinson, A.O., White, K.D.,
Moore, S.A., et al. Washington, D.C.
U.S. Army Medical Department (AMEDD) Rehabilitation and Reintegration Division. 2013. Building the Soldier Athlete,
https://www.hprc-online.org/total-force-fitness/service-specific-resources/army/army-resources-physical-fitness
(accessed 30 September 2020)
U.S. Army Public Health Center (APHC). 2021. Public Health Information Paper No. 22-02-0221, Establishing Army
Wellness Center Referral Guidelines for Injury Prevention Based on Aerobic Fitness and Body Composition. Aberdeen
Proving Ground, Maryland.
APHC. 2020a. Health of the Force Online,
https://carepoint.health.mil/sites/HOF/Pages/Home.aspx (CAC-enabled)
APHC. 2020b. Vaping: E-cigarettes Personal Vaporizers,
https://phc.amedd.army.mil/topics/healthyliving/tfl/Pages/Vaping.aspx
APHC. 2020c. Vector-Borne Disease Surveillance and Control Data Products. Available at:
https://carepoint.health.mil/sites/ENTO (accessed 18 September 2020).
APHC. 2019a. Public Health Report No. S.0049068-19, Injuries and Other Medical Problems Among Young Military
Working Dogs (MWDs). Prepared by A. Schuh-Renner, C.A. Rappole, W. Mey, M. Takara, M.K. Anderson, S. Mullaney,
and T.L. Grier;
https://appsdticmil/dtic/tr/fulltext/u2/1078416pdf (accessed 24 September 2019).
APHC. 2019b. Assessment of Behavioral and Social Health Outcomes at [name of installation withheld]. Prepared by:
Anke, K.A., Beymer, M., Forys-Donohue, K., et al. Aberdeen Proving Ground, Maryland.
APHC. 2017a. Public Health Information Paper No. 12-01-0717, A Taxonomy of Injuries for Public Health Monitoring and
Reporting,
http://www.dtic.mil/docs/citations/AD1039481
APHC 2017b. Surveillance of Suicidal Behavior Publication (SSBP), January through December 2016.
https://phc.amedd.army.mil/topics/healthsurv/bhe/Pages/ssbp.aspx.
U.S. Department of Agriculture. 2019. Choose My Plate [website],
https://www.choosemyplate.gov/MyPlate (accessed 24 October 2019).
U.S. Department of Health and Human Services (DHHS). Healthy People 2030,
https://health.gov/healthypeople (accessed 19 August 2020).
DHHS. 2014. The Health Consequences of Smoking—50 Years of Progress. A Report of the Surgeon General,
https://www.ncbi.nlm.nih.gov/books/NBK179276/pdf/Bookshelf_NBK179276.pdf (accessed 28 August 2019).
U.S. Environmental Protection Agency (EPA). 2019. Resource Conservation and Recovery Act (RCRA) Hazardous Waste
Pharmaceuticals Final Rule. Federal Register Vol. 84, p.5816 and following.
U.S. Global Change Research Program (USGCRP). 2016. The Impacts of Climate Change on Human Health in the United
States: A Scientific Assessment. Crimmins, A., Balbus J., Gamble, J.L., et al., eds. Washington, D.C.
Vogel, J.A., and K.E. Friedl. 1992. Army Data: Body Composition and Physical Capacity. In: Body Composition and
Physical Performance: Applications for the Military Services, Institute of Medicine (U.S.) Committee on Military
Nutrition Research, B.M. Marriott, and J. Grumstrup-Scott, eds., 89–104. Washington, D.C.: National Academies
Press.
Watkins, E.Y., Spiess, A., Abdul-Rahman, I., et al. 2018. Adjusting Suicide Rates in a Military Population: Methods to
Determine the Appropriate Standard Population. Am J Public Health 108(6):769–776.
doi: 10.2105/AJPH.2018.304410](https://image.slidesharecdn.com/2020-hof-report-210702001105/85/2020-Army-Health-of-the-Force-91-320.jpg)


