This monthly medical surveillance report summarizes morbidity data for the U.S. Armed Forces in 2020. It finds that musculoskeletal disorders, injuries, and mental health disorders accounted for the most medical encounters, largest number of affected service members, and greatest number of hospital days. Despite the COVID-19 pandemic, COVID-19 accounted for less than 1% of total medical encounters and hospital bed days for active service members. The report concludes that musculoskeletal disorders, injuries, and mental health disorders detract from individual readiness and deployability and hinder the military's ability to complete its missions. Continued focus on prevention and treatment of these conditions is warranted.
![MSMR Vol. 28 No. 05 May 2021
Page 2
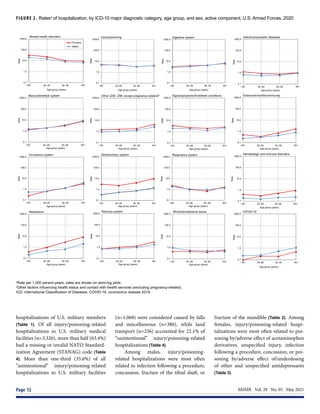
Absolute and Relative Morbidity Burdens Attributable to Various Illnesses and
Injuries, Active Component, U.S. Armed Forces, 2020
W H AT A R E T H E N E W F I N D I N G S ?
In 2020, as in prior years, the medical con-
ditions associated with the most medical
encounters, the largest number of affected
service members, and the greatest number of
hospital days were in the major categories of
musculoskeletal disorders, injuries, and men-
tal health disorders. Despite the pandemic,
COVID-19 accounted for less than 1% of total
medical encounters and bed days in active
component service members.
W H AT I S T H E I M PA C T O N
R E A D I N E S S A N D F O R C E H E A LT H
P R O T E C T I O N ?
Musculoskeletal disorders, injuries, and men-
tal health disorders detract from service mem-
bers’ individual readiness and deployability
and hinder the ability to execute the missions
of the Armed Forces. Continued focus on en-
hanced measures to prevent and treat such
disorders is warranted.
P
erceptions of the relative impor-
tance of various health conditions
in military populations often deter-
mine the natures, extents, and priorities for
resources applied to primary, secondary,
and tertiary prevention activities. However,
these perceptions are inherently subjective
and may not reflect objective measures of
the relationship between the conditions
and their impacts on health, fitness, mili-
tary operational effectiveness, health care
costs, and so on.
Several classification systems and mor-
bidity measures have been developed to
quantify the “public health burdens” that
are attributable to various illnesses and
injuries in defined populations and set-
tings.1
Not surprisingly, different classifica-
tion systems and morbidity measures lead
to different rankings of illness- and injury-
specific public health burdens.2
For example, in a given population
and setting, the illnesses and injuries that
account for the most hospitalizations are
likely different from those that account for
the most outpatient medical encounters.
The illnesses and injuries that account for
the most medical encounters overall may
differ from those that affect the most indi-
viduals, have the most debilitating or long-
lasting effects, and so on.2
Thus, in a given
population and setting, the classification
system or measure used to quantify con-
dition-specific morbidity burdens shapes
to a large extent the conclusions that may
be drawn regarding the relative impor-
tance of various conditions and, in turn, the
resources that may be indicated to prevent
or minimize their impacts.
This annual summary uses a standard
disease classification system (modified for
use among U.S. military members) and sev-
eral health care burden measures to quan-
tify the impacts of various illnesses and
injuries among members of the active com-
ponent of the U.S. Armed Forces in 2020.
M E T H O D S
The surveillance period was 1 January
through 31 December 2020. The surveil-
lance population included all individu-
als who served in the active component of
the U.S. Army, Navy, Air Force, or Marine
Corps at any time during the surveillance
period. All data used in this analysis were
derived from records routinely maintained
in the Defense Medical Surveillance Sys-
tem (DMSS). These records document
both ambulatory encounters and hospital-
izations of active component members of
the U.S. Armed Forces in fixed military and
civilian (if reimbursed through the Military
Health System [MHS]) treatment facilities
worldwide.
For this analysis, DMSS data for all
inpatient and outpatient medical encoun-
ters of all active component members
during 2020 were summarized according
to the primary (first-listed) diagnosis (if
reported with an International Classifica-
tion of Diseases, 10th Revision [ICD-10]
code between A00 and T88, an ICD-10
code beginning with Z37, or Department
of Defense [DoD] unique personal history
codes DOD0101–DOD0105). For sum-
mary purposes, all illness- and injury-spe-
cific diagnoses (as defined by the ICD-10)
were grouped into 153 burden of disease-
related “conditions” and 25 “categories”
based on a modified version of the classi-
fication system developed for the Global
Burden of Disease (GBD) Study.1
This rep-
resents the addition of 2 new conditions for
the 2020 burden analysis: coronavirus 2019
(COVID-19) and polycystic ovarian syn-
drome. The 2019 MSMR analyses grouped
illness- and injury-specific diagnoses into
151 conditions, which was an increase over
the prior 142 conditions used in previous
MSMR analyses. The increase to 151 con-
ditions in the 2019 analysis was informed
by the review of preliminary results of the
2019 burden analysis which revealed that
within 8 of the 22 “all other” conditions,
large numbers of medical encounters were
attributable to 9 diagnosis codes or groups
of codes (cervicalgia, chronic pain, vagini-
tis and vulvitis, urinary tract infection and
cystitis, deviated nasal septum, tinea skin
infections, constipation, testicular hypo-
function, and gout). Based on this finding,
these diagnosis codes or groups of codes
were broken out and treated as separate
burden of disease-related conditions in the
current analysis.
In general, the GBD system groups
diagnoses with common pathophysiologic
or etiologic bases and/or significant inter-
national health policymaking importance.
In this analysis, some diagnoses that are
grouped into single categories in the GBD
system (e.g., mental health disorders) were
disaggregated to increase the military rel-
evance of the results. Also, injuries were
classified by affected anatomic site rather
than by cause because external causes of
injuries are incompletely reported in mili-
tary outpatient records.
The “morbidity burdens” attributable
to various “conditions” were estimated](https://image.slidesharecdn.com/msmrvolume28number05508-210702001148/85/DOD-2020-Health-of-the-Force-2-320.jpg)
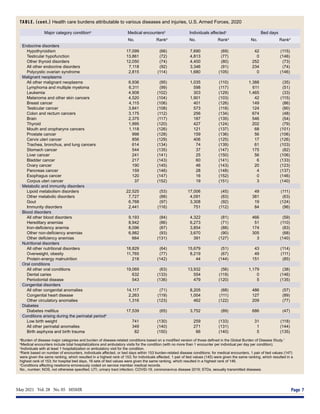
![May 2021 Vol. 28 No. 05 MSMR Page 11
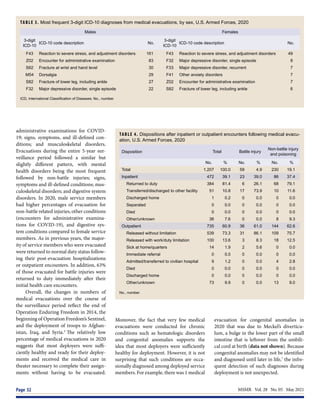
of active component members: mental
health disorders (28.7%), pregnancy- and
delivery-related conditions (25.1%), injury/
poisoning (8.8%), and digestive system dis-
orders (8.3%) (Table 1). Similar to 2016 and
2018, in 2020 there were more hospitaliza-
tions for mental health disorders than for
any other major diagnostic category (per
ICD-10); 2009 was the last year in which
the number of hospitalizations for preg-
nancy- and delivery-related conditions
exceeded the number for mental health dis-
orders (data not shown).
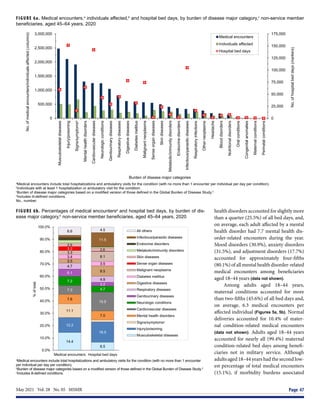
Comparing 2020 to 2016, numbers of
hospitalizations decreased in all major cat-
egories of illnesses and injuries except for
mental health disorders, pregnancy and
delivery, and hematologic and immune
disorders, which increased 7.2%, 1.1%,
and 9.2%, respectively (Table 1). The larg-
est drop in the number of hospitalizations
during 2016–2020 was seen in the category
of “musculoskeletal system and connective
system disorders” (hospitalization differ-
ence, 2016–2020: -2,081; 34.7% decrease).
Hospitalizations, by sex
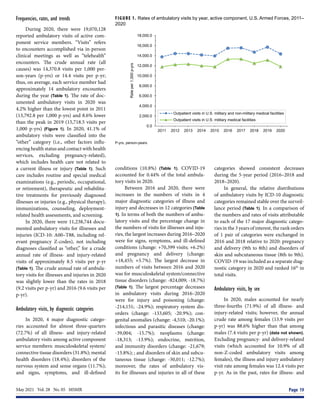
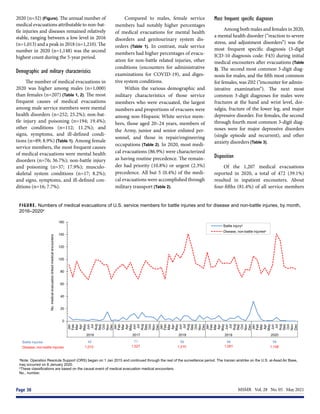
In 2020, the hospitalization rate (all
causes) among females was more than 3
times that of males (114.8 per 1,000 p-yrs
vs. 32.6 per 1,000 p-yrs, respectively).
Excluding pregnancy and delivery, the rate
of hospitalizations among females (46.1 per
1,000 p-yrs) was 41.6% higher than among
males (data not shown).
Overall hospitalization rates were
higher (i.e., the rate difference [RD] was
greater than 1.0 per 1,000 p-yrs) among
females than males for mental health disor-
ders (female:male, RD: 7.4 per 1,000 p-yrs);
genitourinary disorders (RD: 2.9 per 1,000
p-yrs); and neoplasms (RD: 1.4 per 1,000
p-yrs) (data not shown). With the exception
of pregnancy- and delivery-related condi-
tions, hospitalization rates were similar
among males and females for the remain-
ing 13 major disease-specific categories
(data not shown).
Relationships between age and hospi-
talization rates varied considerably across
illness- and injury-specific categories. For
example, among both males and females,
hospitalization rates generally increased
with age for musculoskeletal system/con-
nective tissue disorders, neoplasms, and
circulatory, genitourinary, digestive, ner-
vous, and endocrine/nutrition/immu-
nity disorders (Figure 2). Among service
members aged 30 years or older, there
was a pronounced difference by sex in the
slopes of the rates of neoplasms, with the
rates among females notably higher than
among males in the same age groups. Rates
decreased with age for mental health dis-
orders but were relatively stable across age
groups for injury/poisoning, signs/symp-
toms/ill-defined conditions, and infec-
tious/parasitic diseases.
Most frequent diagnoses
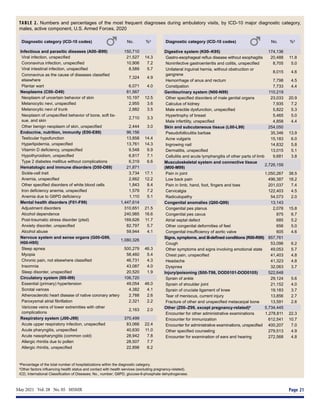
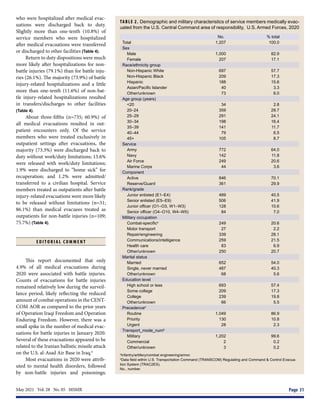
In 2020, adjustment disorder was
the most frequent discharge diagnosis
among males (n=4,433) (Table 2). Alco-
hol dependence (n=2,303), acute appendi-
citis (n=1,197), major depressive disorder
[recurrent, severe without psychotic fea-
tures] (n=1,104), major depressive disor-
der [single episode, unspecified] (n=1,087),
other symptoms and signs involving emo-
tional state (n=542), and post-traumatic
stress disorder (PTSD) (n=523) were the
next 6 most frequent diagnoses in males
(Table 2).
In 2020, the most frequent discharge
diagnosis among females was adjustment
disorder (n=1,352). Pregnancy- and deliv-
ery-related conditions represented the next
5 leading causes of hospitalizations among
females, and this category alone accounted
for 59.7% of all hospitalizations of females
(Table 3). The top 5 discharge diagnoses in
this condition category included post-term
(late) pregnancy (n=1,332), abnormal-
ity in fetal heart rate and rhythm (n=922),
maternal care due to uterine scar from
previous surgery (n=856), premature rup-
ture of membranes [onset of labor within
24 hours of rupture] (n=847), and first
degree perineal laceration during delivery
(n=793). After the top 6 discharge diagno-
ses described above for females, the other
leading causes of hospitalizations among
females were recurrent major depres-
sive disorder without psychotic features
(n=454), PTSD (n=448), major depres-
sive disorder [single episode, unspecified]
(n=380), and alcohol dependence (n=304).
Combined, mental health disorder diagno-
ses accounted for one-sixth (17.1%) of all
hospitalizations of females.
Injury/poisoning
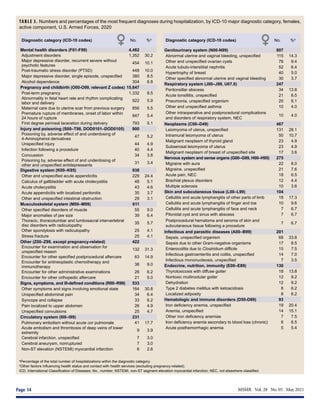
As in the past, in 2020, injury/poi-
soning was the third leading cause of
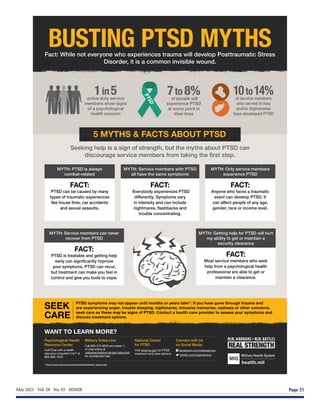
FIGURE 1. Rates of hospitalization, by year, active component, U.S. Armed Forces, 2011–2020
P-yrs, person-years.
0
10
20
30
40
50
60
70
80
2011 2012 2013 2014 2015 2016 2017 2018 2019 2020
Rate
of
hospitalizations
per
1,000
p-yrs
Hospitalizations in U.S. military and non-military medical facilities
Hospitalizations in U.S. military medical facilities only](https://image.slidesharecdn.com/msmrvolume28number05508-210702001148/85/DOD-2020-Health-of-the-Force-11-320.jpg)
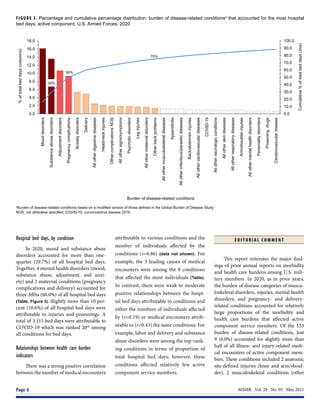
![May 2021 Vol. 28 No. 05 MSMR Page 13
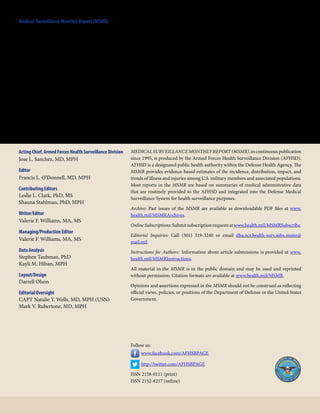
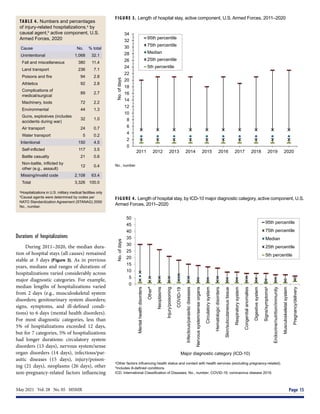
TABLE 2. Numbers and percentages of the most frequent diagnoses during hospitalization, by ICD-10 major diagnostic category, males,
active component, U.S. Armed Forces, 2020
Diagnostic category (ICD-10 codes) No. %a
Mental health disorders (F01-F99) 13,467
Adjustment disorders 4,433 32.9
Alcohol dependence 2,303 17.1
Major depressive disorder, recurrent severe without
psychotic features
1,104 8.2
Major depressive disorder, single episode, unspecified 1,087 8.1
Post-traumatic stress disorder (PTSD) 523 3.9
Injury and poisoning (S00–T98, DOD0101–DOD0105) 4,598
Infection following a procedure 201 4.4
Concussion 124 2.7
Fracture of shaft of tibia 116 2.5
Fracture of mandible 113 2.5
Heatstroke and sunstroke 113 2.5
Digestive system (K00–K95) 4,223
Other and unspecified acute appendicitis 1,197 28.3
Acute appendicitis with localized peritonitis 258 6.1
Acute pancreatitis, unspecified 172 4.1
Alcohol induced acute pancreatitis 125 3.0
Other and unspecified intestinal obstruction 109 2.6
Musculoskeletal system (M00–M99) 3,310
Other specified disorders of muscle 474 14.3
Thoracic, thoracolumbar and lumbosacral intervertebral
disc disorders with radiculopathy
275 8.3
Spinal stenosis 222 6.7
Other spondylosis with radiculopathy 165 5.0
Major anomalies of jaw size 152 4.6
Other (Z00–Z99, except pregnancy-related) 1,355
Encounter for examination and observation for
unspecified reason
363 26.8
Encounter for antineoplastic chemotherapy and
immunotherapy
189 13.9
Encounter for other specified postprocedural aftercare 173 12.8
Encounter for other orthopedic aftercare 134 9.9
Aftercare following joint replacement surgery 93 6.9
Signs, symptoms, and ill-defined conditions (R00–R99) 1,854
Other symptoms and signs involving emotional state 542 29.2
Syncope and collapse 174 9.4
Other chest pain 121 6.5
Chest pain, unspecified 116 6.3
Unspecified convulsions 93 5.0
Circulatory system (I00–I99) 1,264
Pulmonary embolism without acute cor pulmonale 152 12.0
Non-ST elevation (NSTEMI) myocardial infarction 69 5.5
Unspecified atrial fibrillation and atrial flutter 55 4.4
Paroxysmal atrial fibrillation 53 4.2
Atherosclerotic heart disease of native coronary artery 38 3.0
Genitourinary system (N00–N99) 744
Acute kidney failure, unspecified 167 22.4
Hydronephrosis with renal and ureteral calculous
obstruction
58 7.8
Calculus of ureter 53 7.1
Calculus of kidney 49 6.6
Torsion of testis 39 5.2
Diagnostic category (ICD-10 codes) No. %a
Respiratory system (460–519; J00–J99) 1,224
Pneumonia, unspecified organism 152 12.4
Peritonsillar abscess 98 8.0
Deviated nasal septum 63 5.1
Other pneumothorax and air leak 53 4.3
Acute respiratory failure 51 4.2
Neoplasms (C00–D49) 727
Malignant neoplasm of thyroid gland 40 5.5
Acute lymphoblastic leukemia [ALL] 26 3.6
Malignant neoplasm of prostate 23 3.2
Acute myeloblastic leukemia 23 3.2
Malignant neoplasm of rectum 17 2.3
Nervous system and sense organs (G00–G99, H00–H95) 981
Sleep apnea 73 7.4
Epilepsy, unspecified 64 6.5
Other epilepsy and recurrent seizures 47 4.8
Brachial plexus disorders 47 4.8
Acute pain, NEC 32 3.3
Skin and subcutaneous tissue (L00–L99) 632
Cellulitis and acute lymphangitis of other parts of limb 257 40.7
Cutaneous abscess, furuncle and carbuncle of limb 43 6.8
Cellulitis and acute lymphangitis of face and neck 32 5.1
Pilonidal cyst and sinus with abscess 31 4.9
Cellulitis and acute lymphangitis of finger and toe 28 4.4
Infectious and parasitic diseases (A00–B99) 666
Sepsis, unspecified organism 196 29.4
Other specified sepsis 56 8.4
Infectious gastroenteritis and colitis, unspecified 53 8.0
Infectious mononucleosis, unspecified 36 5.4
Enterocolitis due to Clostridium difficile 28 4.2
Endocrine, nutrition, immunity (E00–E89) 422
Type 2 diabetes mellitus with ketoacidosis 68 16.1
Type 1 diabetes mellitus with ketoacidosis 66 15.6
Dehydration 27 6.4
Hypo-osmolality and hyponatremia 27 6.4
Type 2 diabetes mellitus with other specified complications 26 6.2
Congenital anomalies (Q00–Q99) 141
Meckel's diverticulum (displaced) (hypertrophic) 12 8.5
Other congenital deformities of hip 12 8.5
Atrial septal defect 11 7.8
Arteriovenous malformation of cerebral vessels 10 7.1
Pectus excavatum 9 6.4
Hematologic and immune disorders (D50–D89) 193
Neutropenia, unspecified 27 14.0
Other specified aplastic anemias and other bone
marrow failure syndromes
17 8.8
Immune thrombocytopenic purpura 16 8.3
Iron deficiency anemia, unspecified 14 7.3
Acute posthemorrhagic anemia 12 6.2
a
Percentage of the total number of hospitalizations within the diagnostic category.
b
Other factors influencing health status and contact with health services (excluding pregnancy-related).
ICD, International Classification of Diseases; No., number; NSTEMI, non-ST segment elevation myocardial infarction; NEC, not elsewhere classified.](https://image.slidesharecdn.com/msmrvolume28number05508-210702001148/85/DOD-2020-Health-of-the-Force-13-320.jpg)
![MSMR Vol. 28 No. 05 May 2021
Page 18
T
his report documents the frequen-
cies, rates, trends, and characteris-
tics of ambulatory health care visits
of active component members of the U.S.
Army, Navy, Air Force, and Marine Corps
during 2020. Ambulatory visits of U.S. ser-
vice members in fixed military and non-
military (reimbursed through the Military
Health System [MHS]) medical treatment
facilities are documented with standard-
ized, automated records. These records are
routinely archived for health surveillance
purposes in the Defense Medical Surveil-
lance System (DMSS), which is the source
of data for this report. Ambulatory vis-
its that are not routinely and completely
documented with standardized elec-
tronic records (e.g., during deployments,
field training exercises, or at sea) are not
included in this analysis.
Ambulatory Visits, Active Component, U.S. Armed Forces, 2020
W H AT A R E T H E N E W F I N D I N G S ?
In 2020, the overall numbers and rates of ac-
tive component service member ambulatory
care visits decreased slightly compared to
previous years. Most categories of illness and
injury showed modest declines in numbers
and rates. The proportions of ambulatory care
visits that were accomplished via telehealth
encounters increased to 19% in 2020, com-
pared to 14% in 2016 and 2018.
W H AT I S T H E I M PA C T O N
R E A D I N E S S A N D F O R C E H E A LT H
P R O T E C T I O N ?
The response to the coronavirus pandemic
may have been associated with not only a
decrease in the incidence of disease and in-
jury diagnoses in the service member popu-
lation but also an increase in the proportions
of health care encounters delivered through
telehealth. Lessons learned may guide future
steps in reducing disease and injury inci-
dence in the post-pandemic era.
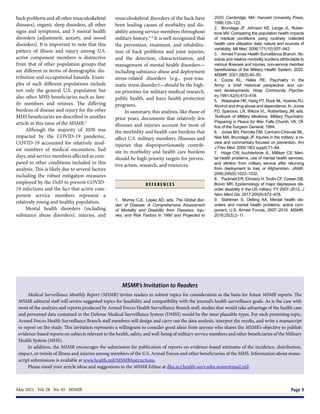
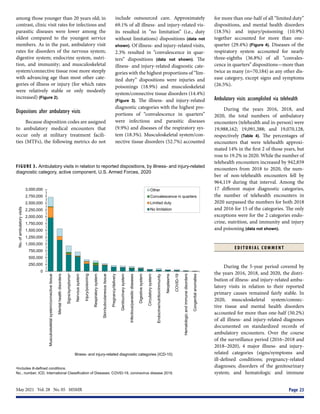
TABLE 1. Numbers, rates,a
and ranksb
of ambulatory visits, by ICD-9/ICD-10 major diagnostic category, active component, U.S. Armed Forces,
2016, 2018, and 2020
2016c
2018 2020
Major diagnostic category (ICD-9; ICD-10) No. Ratea
Rankb
No. Ratea
Rankb
No. Ratea
Rankb
Other (V01–V99, except pregnancy-related; Z00–Z99, except
pregnancy-related)d
7,568,681 5872.4 (1) 7,155,040 5519.7 (1) 7,831,384 5901.5 (1)
Musculoskeletal system and connective tissue (710–739; M00–M99) 4,399,712 3413.7 (2) 4,240,142 3271.0 (2) 3,575,703 2694.6 (2)
Mental health disorders (290–319; F01–F99) 2,070,773 1606.7 (3) 1,913,176 1475.9 (3) 2,068,706 1558.9 (3)
Nervous system and sense organs (320–389; G00–G99, H00–H95) 1,327,664 1030.1 (4) 1,329,520 1025.7 (4) 1,313,805 990.1 (4)
Signs, symptoms, and ill-defined conditions (780–799; R00–R99) 1,143,051 886.9 (5) 1,166,310 899.7 (5) 1,213,450 914.4 (5)
Injury and poisoning (800–999; S00–T98, DOD0101–DOD0105) 859,750 667.1 (6) 771,839 595.4 (6) 645,599 486.5 (6)
Respiratory system (460–519; J00–J99) 638,271 495.2 (7) 629,983 486.0 (7) 504,666 380.3 (7)
Pregnancy and delivery (630–679, relevant V-codes; O00–
O99, relevant Z codes)e
325,185 1,599.4 (9) 333,532 1,565.1 (9) 343,640 1,508.9 (8)
Skin and subcutaneous tissue (680–709; L00–L99) 393,370 305.2 (8) 380,308 293.4 (8) 343,259 258.7 (9)
Genitourinary system (580–629; N00–N99) 281,184 218.2 (10) 275,770 212.7 (10) 281,369 212.0 (10)
Digestive system (520–579; K00–K95) 248,088 192.5 (11) 232,925 179.7 (11) 224,811 169.4 (11)
Infectious and parasitic diseases (001–139; A00–B99) 247,988 192.4 (12) 225,660 174.1 (12) 208,984 157.5 (12)
Endocrine, nutrition, immunity (240–278; E00–E89) 157,572 122.3 (13) 136,619 105.4 (13) 135,893 102.4 (13)
Circulatory system (390–459; I00–I99) 139,928 108.6 (14) 129,022 99.5 (14) 126,954 95.7 (14)
Neoplasms (140–239; C00–D49) 131,882 102.3 (15) 119,622 92.3 (15) 113,569 85.6 (15)
COVID-19 (ICD-10: U07.1) -- -- -- -- -- -- 83,405 62.9 (16)
Hematologic and immune disorders (279–289; D50–D89) 32,663 25.3 (16) 31,949 24.6 (16) 37,041 27.9 (17)
Congenital anomalies (740–759; Q00–Q99) 22,400 17.4 (17) 19,971 15.4 (17) 17,890 13.5 (18)
Total 19,988,162 15,508.5 19,091,388 14,728.0 19,070,128 14,370.8
a
Rates are based on 1,000 person-years.
b
Rank of major diagnostic category based on number of hospitalizations.
c
2016 ambulatory visit data included ICD-9 diagnostic codes.
d
Other factors influencing health status and contact with health services (excluding pregnancy-related).
e
Rate of pregnancy and delivery-related hospitalizations among females only.
ICD, International Classification of Diseases; No., number.
As in previous MSMR reports, all
records of ambulatory visits of active com-
ponent service members were categorized
according to the first 4 characters of the
International Classification of Diseases, 10th
Revision (ICD-10) codes entered in the pri-
mary (first-listed) diagnostic position of the
visit records.1
In this analysis, a special query
of the DMSS records was performed to dis-
tinguish ambulatory visits that were accom-
plished via “telehealth” encounters (e.g., via
telephone or video teleconference) rather
than in-person encounters. Both types of
encounters were included and not distin-
guished in most of the data summaries, but
trends in the proportions of encounters that
were accomplished via telehealth were exam-
inedbecauseoftheincreaseduseoftelehealth
encounters during the coronavirus 2019
(COVID-19) pandemic.](https://image.slidesharecdn.com/msmrvolume28number05508-210702001148/85/DOD-2020-Health-of-the-Force-18-320.jpg)
![MSMR Vol. 28 No. 05 May 2021
Page 20
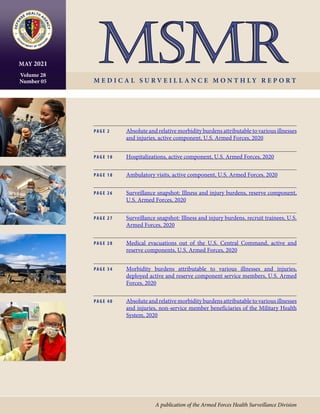
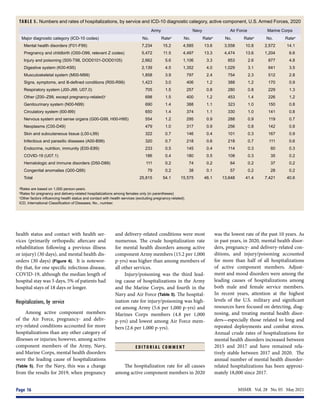
FIGURE 2. Ratesa
of ambulatory visits, by ICD-10 major diagnostic category, age group, and sex, active component, U.S. Armed Forces, 2020
a
Rate per 1,000 person-years; rates are shown on semi-log plots.
b
Other factors influencing health status and contact with health services (excluding pregnancy-related).
ICD, International Classification of Diseases; COVID-19, coronavirus disease 2019.
0.0
50.0
100.0
150.0
200.0
<20 20–29 30–39 40+
Rate
Age group (years)
COVID-19
0.0
1,000.0
2,000.0
3,000.0
4,000.0
<20 20–29 30–39 40+
Rate
Age group (years)
Mental health disorders
Females
Males
0.0
200.0
400.0
600.0
800.0
1,000.0
<20 20–29 30–39 40+
Rate
Age group (years)
Injury/poisoning
0.0
100.0
200.0
300.0
400.0
<20 20–29 30–39 40+
Rate
Age group (years)
Digestive system
0.0
2,000.0
4,000.0
6,000.0
8,000.0
10,000.0
<20 20–29 30–39 40+
Rate
Age group (years)
Musculoskeletal system/connective tissue
0.0
2,000.0
4,000.0
6,000.0
8,000.0
10,000.0
12,000.0
<20 20–29 30–39 40+
Rate
Age group (years)
Other (Z00-Z99, except pregnancy-related)b
0.0
500.0
1000.0
1500.0
2000.0
2500.0
<20 20–29 30–39 40+
Rate
Age group (years)
Signs/symptoms/ill-defined conditions
0.0
100.0
200.0
300.0
400.0
<20 20–29 30–39 40+
Rate
Age group (years)
Circulatory system
0.0
200.0
400.0
600.0
800.0
1,000.0
<20 20–29 30–39 40+
Rate
Age group (years)
Genitourinary system
0.0
200.0
400.0
600.0
800.0
1,000.0
<20 20–29 30–39 40+
Rate
Age group (years)
Respiratory system
0.0
100.0
200.0
300.0
400.0
500.0
<20 20–29 30–39 40+
Rate
Age group (years)
Neoplasms
0.0
1,000.0
2,000.0
3,000.0
4,000.0
<20 20–29 30–39 40+
Rate
Age group (years)
Nervous system and sense organs
0.0
200.0
400.0
600.0
<20 20–29 30–39 40+
Rate
Age group (years)
Skin/subcutaneous tissue
0.0
20.0
40.0
60.0
80.0
100.0
120.0
140.0
<20 20–29 30–39 40+
Rate
Age group (years)
Hematologic and immune disorders
0.0
100.0
200.0
300.0
400.0
500.0
<20 20–29 30–39 40+
Rate
Age group (years)
Endocrine/nutrition/immunity
0.0
100.0
200.0
300.0
400.0
<20 20–29 30–39 40+
Rate
Age group (years)
Infectious/parasitic diseases
injury-related categories were generally
higher among females than males (Figure 2).
Among all illness- and injury-specific
diagnoses, 3 of the 5 diagnoses with the
largest numbers of ambulatory visits were
the same for males and females. However,
the crude rate (per 1,000 p-yrs) was at least
37% higher among females than males for
these 3 common diagnoses: pain in joint
(female: 1,445.2; male: 955.4; female:male
rate ratio [RR]: 1.51); low back pain
(female: 618.9; male: 451.6; RR: 1.37); and
adjustment disorders (female: 688.8; male:
282.6; RR: 2.44) (data not shown). Five other
diagnoses were among the 10 most com-
mon diagnoses for both males and females:
pain in limb, hand, foot, fingers, and toes;
post-traumatic stress disorder (PTSD);
sleep apnea; alcohol dependence; and cer-
vicalgia. Of note, sleep apnea was the 2nd
most frequent illness- or injury-specific
primary diagnosis during ambulatory vis-
its of males, but it ranked as the 8th most
common diagnosis among females. Among
females, the 7th most common diagnosis
was anxiety disorder, unspecified, which
was the 10th most common diagnosis
among males (Tables 2, 3).
Across diagnostic categories, rela-
tionships between age group and ambula-
tory visit rates were broadly similar among
males and females (Figure 2). For example,
among both males and females, ambula-
tory visit rates for neoplasms and circula-
tory disorders among those aged 40 years
or older were 15 or more times the rates](https://image.slidesharecdn.com/msmrvolume28number05508-210702001148/85/DOD-2020-Health-of-the-Force-20-320.jpg)
![MSMR Vol. 28 No. 05 May 2021
Page 22
TABLE 3. Numbers and percentages of the most frequent diagnoses during ambulatory visits, by ICD-10 major diagnostic category,
females, active component, U.S. Armed Forces, 2020
Diagnostic category (ICD-10 codes) No. %a
Infectious and parasitic diseases (A00–B99) 58,274
Viral infection, unspecified 7,632 13.1
Candidiasis of vulva and vagina 7,398 12.7
Chlamydial infection of genitourinary tract, unspecified 3,103 5.3
Viral intestinal infection, unspecified 2,983 5.1
Coronavirus infection, unspecified 2,960 5.1
Neoplasms (C00–D49) 32,002
Leiomyoma of uterus, unspecified 3,510 11.0
Neoplasm of uncertain behavior of skin 2,980 9.3
Malignant neoplasm of breast of unspecified site 2,180 6.8
Melanocytic nevi, unspecified 1,044 3.3
Malignant neoplasm of upper-outer quadrant of breast 982 3.1
Endocrine, nutrition, immunity (E00-E89) 39,737
Hypothyroidism, unspecified 6,294 15.8
Vitamin D deficiency, unspecified 6,192 15.6
Polycystic ovarian syndrome 2,813 7.1
Obesity, unspecified 2,120 5.3
Overweight 1,347 3.4
Hematologic and immune disorders (D50-D89) 15,170
Iron deficiency anemia, unspecified 4,574 30.2
Anemia, unspecified 2,787 18.4
Sickle-cell trait 1,784 11.8
Iron deficiency anemia secondary to blood loss
(chronic)
973 6.4
Other specified disorders of white blood cells 703 4.6
Mental health disorders (F01-F99) 621,092
Adjustment disorders 156,859 25.3
Post-traumatic stress disorder (ptsd) 86,217 13.9
Anxiety disorder, unspecified 42,961 6.9
Alcohol dependence 35,678 5.7
Major depressive disorder, recurrent, moderate 31,676 5.1
Nervous system and sense organs (G00-G99,
H00-H95)
233,479
Sleep apnea 37,412 16.0
Myopia 20,043 8.6
Chronic pain, not elsewhere classified 17,400 7.5
Insomnia 13,383 5.7
Migraine with aura 9,011 3.9
Circulatory system (I00-I99) 20,234
Essential (primary) hypertension 6,638 32.8
Varicose veins of lower extremities with other
complications
880 4.3
Pulmonary embolism without acute cor pulmonale 705 3.5
Venous insufficiency (chronic) (peripheral) 613 3.0
Supraventricular tachycardia 604 3.0
Respiratory system (J00-J99) 134,167
Acute upper respiratory infection, unspecified 28,276 21.1
Acute pharyngitis, unspecified 18,108 13.5
Allergic rhinitis due to pollen 11,338 8.5
Acute nasopharyngitis [common cold] 11,076 8.3
Allergic rhinitis, unspecified 8,678 6.5
Diagnostic category (ICD-10 codes) No. %a
Digestive system (K00–K95) 50,675
Constipation 8,135 16.1
Gastro-esophageal reflux disease without esophagitis 4,936 9.7
Noninfective gastroenteritis and colitis, unspecified 3,079 6.1
Hemorrhage of anus and rectum 1,859 3.7
Unspecified hemorrhoids 1,607 3.2
Genitourinary system (N00-N99) 171,150
Acute vaginitis 20,775 12.1
Urinary tract infection, site not specified 14,268 8.3
Other specified noninflammatory disorders of vagina 9,016 5.3
Abnormal uterine and vaginal bleeding, unspecified 8,693 5.1
Female infertility, unspecified 7,612 4.4
Pregnancy and delivery (O00-O99, relevant Z codes) 343,640
Encounter for care and examination of lactating mother 33,816 9.8
Encounter for supervision of normal first pregnancy 31,534 9.2
Encounter for supervision of other normal pregnancy 24,411 7.1
Encounter for routine postpartum follow-up 19,275 5.6
Other specified diseases and conditions complicating
pregnancy, childbirth and the puerperium
14,682 4.3
Skin and subcutaneous tissue (L00-L99) 89,209
Acne vulgaris 13,626 15.3
Dermatitis, unspecified 5,734 6.4
Acne, unspecified 5,292 5.9
Ingrowing nail 2,650 3.0
Urticaria, unspecified 2,347 2.6
Musculoskeletal system and connective tissue
(M00-M99)
849,544
Pain in joint 329,116 38.7
Low back pain 140,947 16.6
Pain in limb, hand, foot, fingers and toes 64,181 7.6
Cervicalgia 46,825 5.5
Stress fracture 20,984 2.5
Signs, symptoms, and ill-defined conditions
(R00-R99)
355,689
Pelvic and perineal pain 24,130 6.8
Headache 21,174 6.0
Other symptoms and signs involving emotional state 18,491 5.2
Unspecified abdominal pain 17,383 4.9
Cough 16,398 4.6
Injury/poisoning (DOD0101-DOD0105) 122,951
Sprain of ankle 9,557 7.8
Sprain of cruciate ligament of knee 3,736 3.0
Concussion 3,495 2.8
Sprain of hip 2,457 2.0
Physical abuse, confirmed 2,438 2.0
Other (Z00–Z99, except pregnancy-related)b
2,096,939
Encounter for other administrative examinations 487,008 23.2
Encounter for administrative examinations, unspecified 170,854 8.1
Encounter for immunization 138,471 6.6
Other specified counseling 135,860 6.5
Persons encountering health services in other
specified circumstances
67,908 3.2
a
Percentage of the total number of hospitalizations within the diagnostic category.
b
Other factors influencing health status and contact with health services (excluding pregnancy-related).
ICD, International Classification of Diseases; No., number.](https://image.slidesharecdn.com/msmrvolume28number05508-210702001148/85/DOD-2020-Health-of-the-Force-22-320.jpg)
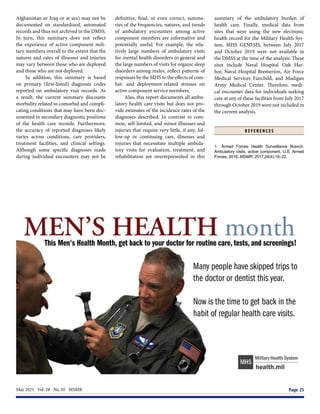
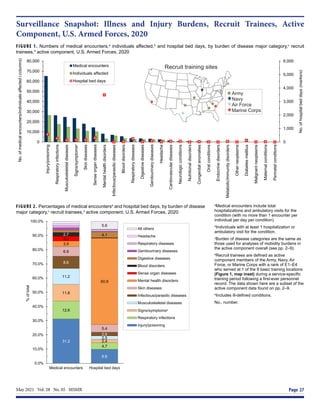
![MSMR Vol. 28 No. 05 May 2021
Page 28
Medical Evacuations out of the U.S. Central Command, Active and Reserve
Components, U.S. Armed Forces, 2020
W H AT A R E T H E N E W F I N D I N G S ?
The numbers of medical evacuations of service
members in 2020 were roughly similar to the
numbers for the previous 4 years. The propor-
tions of evacuations that were due to battle
injuries remained relatively steady during this
period except for a small peak in January 2020.
Evacuations for mental health disorders were
the most common, followed by non-battle injury
and poisoning, and COVID-19.
W H AT I S T H E I M PA C T O N
R E A D I N E S S A N D F O R C E H E A LT H
P R O T E C T I O N ?
Only 1,207 service members were evacu-
ated during 2020, but the process of medical
evacuation of service members to Europe and
CONUS is logistically demanding. The effort
expended to evacuate service members to
sources of definitive, modern health care is a
reassuring investment in the health, welfare,
and importance of the men and women serving
overseas.
A
lthough there have been substan-
tial reductions in combat oper-
ations taking place in the U.S.
Central Command (CENTCOM) area of
responsibility (AOR) in Southwest Asia,1
the number of service members deployed
to the CENTCOM AOR is still significant.
Recent reports indicate that there are about
60–80,000 U.S. troops in the CENTCOM
AOR.2,3
In theaters of operations such as
Afghanistan, most medical care is provided
by deployed military medical personnel;
however, some injuries and illnesses require
medical management outside the opera-
tional theater. In these cases, the affected
individuals are usually transported by air to
a fixed military medical facility in Europe or
the U.S. where the service members receive
the specialized, technically advanced, and/
or prolonged diagnostic, therapeutic, and
rehabilitative care required.
The ongoing pandemic of coronavirus
disease 2019 (COVID-19) has presented
additional challenges to readiness for ser-
vice members stationed in CENTCOM.
According to the May 2020 U.S. CENTCOM
COVID-19 Pandemic Playbook for Opera-
tional Environments, all persons who test
positive for COVID-19 are recommended
to be moved into isolation and prepared for
evacuation out of theater.4
A prior MSMR
report identified 186 air evacuations for
COVID-19 originating from CENTCOM
through the end of September 2020, which
included positive cases and close contacts.5
Medical air transports, or medical evac-
uations, are costly and generally indicative
of serious medical conditions. Some serious
conditions are directly related to partici-
pation in or support of combat operations
(e.g., battle wounds); however, many other
conditions are unrelated to combat and may
be preventable. This report summarizes the
natures, numbers, and trends of conditions
for which male and female military mem-
bers were medically evacuated from CENT-
COM AOR operations during 2020 and
compares them to the previous 4 years.
M E T H O D S
The surveillance period was 1 January
2016 through 31 December 2020. The sur-
veillance population included all members
of the active and reserve components of
the U.S. Army, Navy, Air Force, and Marine
Corps who were deployed to the CENT-
COM AOR during the period. The outcome
of interest in this analysis was medical evac-
uations during the surveillance period from
the CENTCOM AOR (e.g., Afghanistan or
Iraq) to a medical treatment facility out-
side the CENTCOM AOR. Records of all
medical evacuations conducted by the U.S.
Transportation Command (TRANSCOM)
maintained in the TRANSCOM Regulating
and Command & Control Evacuation Sys-
tem (TRAC2ES) were utilized. Evacuations
were included in the analysis if the affected
service member had at least 1 inpatient or
outpatient medical encounter in a perma-
nent military medical facility in the U.S.
or Europe during a time interval extend-
ing from 5 days before to 10 days after the
reported evacuation date.
Medical evacuations included in the
analyses were classified by the causes and
natures of the precipitating medical con-
ditions (based on information reported in
relevant evacuation and medical encoun-
ter records). First, all medical conditions
that resulted in evacuations were classi-
fied as either “battle injuries” or “non-battle
injuries and illnesses” (based on entries in
an indicator field of the TRAC2ES evacua-
tion record). Evacuations due to non-battle
injuries and illnesses were subclassified into
17 illness/injury categories based on Inter-
national Classification of Diseases, 9th and
10th Revisions (ICD-9 and ICD-10, respec-
tively) diagnostic codes reported on the
records of medical encounters after evacua-
tion. In addition, a new category was added
this year for evacuations that resulted in a
diagnosis of COVID-19 (ICD-10: U07.1).
For the purposes of this report, all records of
hospitalizations and ambulatory visits from
5 days before to 10 days after the reported
date of each medical evacuation were identi-
fied. In most cases, the primary (first-listed)
diagnosis for either a hospitalization (if any
occurred) or the earliest ambulatory visit
after evacuation was considered indicative
of the condition responsible for the evacu-
ation. However, if the first-listed diagnos-
tic code specified the external cause (rather
than the nature) of an injury (ICD-9 E-code/
ICD-10 V-, W-, X-, or Y-code) or an encoun-
ter for something other than a current illness
or injury (e.g., observation, medical exam-
ination, or vaccination [ICD-9 V-codes/
ICD-10 Z-codes other than those related to
pregnancy]), then secondary diagnoses that
specified illnesses and injuries (ICD-9: 001–
999/ICD-10: A00–T88) were considered the
likely reasons for the subject evacuations. If
there was no secondary diagnosis or if the
secondary diagnosis also was an external
cause code, the first-listed diagnostic code
of a subsequent encounter was used. To
better understand the reasons for medical](https://image.slidesharecdn.com/msmrvolume28number05508-210702001148/85/DOD-2020-Health-of-the-Force-28-320.jpg)
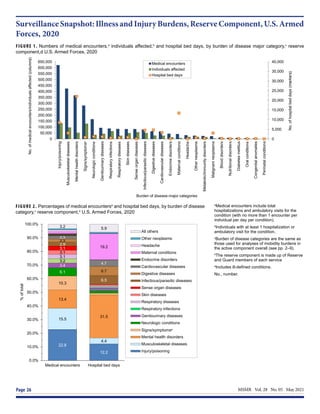
![MSMR Vol. 28 No. 05 May 2021
Page 34
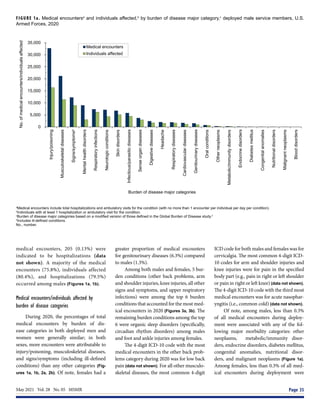
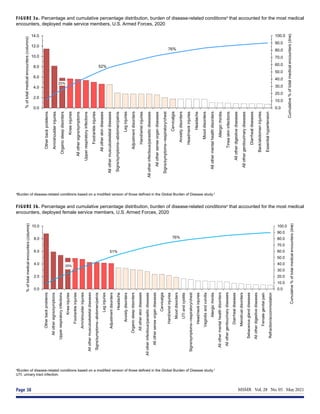
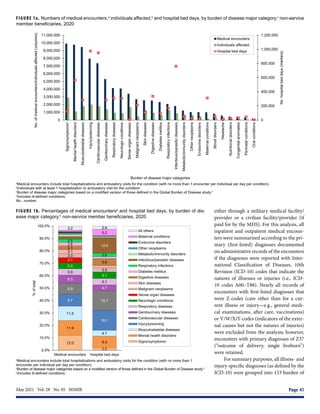
Morbidity Burdens Attributable to Various Illnesses and Injuries, Deployed Active
and Reserve Component Service Members, U.S. Armed Forces, 2020
W H AT A R E T H E N E W F I N D I N G S ?
As in previous years, among service mem-
bers deployed during 2020, injury/poisoning,
musculoskeletal diseases and signs/symp-
toms accounted for more than half of the total
health care burden during deployment. The
percentage of encounters attributable to men-
tal health disorders increased slightly over
that observed in 2019 but remained below lev-
els seen in the period 2008-2014. Compared
to garrison disease burden, deployed service
members had relatively higher proportions of
encounters for respiratory infections, skin dis-
eases, and infectious and parasitic diseases.
W H AT I S T H E I M PA C T O N
R E A D I N E S S A N D F O R C E H E A LT H
P R O T E C T I O N ?
Injuries and musculoskeletal diseases ac-
count for the greatest burden of deployed
medical care and continued focus on sur-
veillance and preventive measures for these
health threats is warranted. While deployed,
readiness may be impacted by conditions
associated with austere environmental and
sanitary conditions.
E
very year, the MSMR estimates ill-
ness- and injury-related morbidity
and health care burdens on the U.S.
Armed Forces and the Military Health
System (MHS) using electronic records
of medical encounters from the Defense
Medical Surveillance System (DMSS).
These records document health care
delivered in the fixed medical facilities
of the MHS and in civilian medical facil-
ities when care is paid for by the MHS.
Health care encounters of deployed ser-
vice members are documented in records
that are maintained in the Theater Medi-
cal Data Store (TMDS), which is incorpo-
rated into the DMSS. This report updates
previous analyses examining the dis-
tributions of illnesses and injuries that
accounted for medical encounters (“mor-
bidity burdens”) of active component
members in deployed settings in the U.S.
Central Command (CENTCOM) and the
U.S. Africa Command (AFRICOM) areas
of operations during the 2020 calendar
year.1
M E T H O D S
The surveillance population included
all individuals who served in the active
or reserve components of the U.S. Army,
Navy, Air Force, or Marine Corps and
who had records of health care encoun-
ters captured in the TMDS during the
surveillance period. The analysis was
restricted to encounters where the the-
ater of care specified was CENTCOM or
AFRICOM or where the name of the the-
ater of operation was missing or null; by
default, this excluded encounters in the
U.S. Northern Command, U.S. European
Command, U.S. Indo-Pacific Command,
or U.S. Southern Command theaters of
operations. In addition, TMDS-recorded
medical encounters where the data source
was identified as Shipboard Automated
Medical System (e.g., SAMS, SAMS8,
SAMS9) or where the military treatment
facility descriptor indicated that care was
provided aboard a ship (e.g., USS George
H.W. Bush or USS Dwight D. Eisen-
hower) were excluded from this analy-
sis. Encounters from aeromedical staging
facilities outside of CENTCOM or AFR-
ICOM (e.g., the 779th Medical Group
Aeromedical Staging Facility or the 86th
Contingency Aeromedical Staging Facil-
ity) were also excluded. Inpatient and
outpatient medical encounters were sum-
marized according to the primary (first-
listed) diagnoses (if reported with an
International Classification of Diseases,
9th Revision [ICD-9] code between 001
and 999 or beginning with V27 or with an
International Classification of Diseases,
10th Revision [ICD-10] code between
A00 and T88 or beginning with Z37).
Primary diagnoses that did not corre-
spond to an ICD-9 or ICD-10 code (e.g.,
1XXXX, 4XXXX) were not reported in
this burden analysis.
In tandem with the methodology
described on pages 2–3 of this issue of
the MSMR, all illness- and injury-spe-
cific diagnoses were grouped into 153
burden of disease-related conditions and
25 major categories based on a modi-
fied version of the classification system
developed for the Global Burden of Dis-
ease (GBD) study.2
The morbidity bur-
dens attributable to various conditions
were estimated on the basis of the total
number of medical encounters attrib-
utable to each condition (i.e., total hos-
pitalizations and ambulatory visits for
the condition with a limit of 1 encoun-
ter per individual per condition per day)
and the numbers of service members
affected by the conditions. In general, the
GBD system groups diagnoses with com-
mon pathophysiologic or etiologic bases
and/or significant international health
policymaking importance. For this analy-
sis, some diagnoses that are grouped into
single categories in the GBD system (e.g.,
mental health disorders) were disaggre-
gated. Also, injuries were categorized by
the affected anatomic sites rather than by
causes because external causes of injuries
are not completely reported in TMDS
records. It is important to note that
because the TMDS has not fully transi-
tioned to ICD-10 codes, some ICD-9
codes appear in this analysis.
R E S U LT S
In 2020, a total of 154,203 medi-
cal encounters occurred among 58,440
individuals while deployed to Southwest
Asia/Middle East and Africa. Of the total](https://image.slidesharecdn.com/msmrvolume28number05508-210702001148/85/DOD-2020-Health-of-the-Force-34-320.jpg)
![May 2021 Vol. 28 No. 05 MSMR Page 39
the injury was suffered as a birth trauma
rather than using a code indicating injury
in an adult) warrant care in the interpreta-
tion of some findings. Although such cod-
ing errors are not common, their presence
serves as a reminder of the extent to which
this study depends on the capture of accu-
rate information in the sometimes austere
deployment environment in which health
care encounters occur.
R E F E R E N C E S
1. Armed Forces Health Surveillance Branch.
Morbidity burdens attributable to various illnesses
and injuries, deployed active and reserve compo-
nent service members, U.S. Armed Forces, 2019.
MSMR. 2020; 27(5): 33–38.
2. Murray CJ and Lopez AD, eds. In: Global
Burden of Disease: A Comprehensive Assess-
ment of Mortality and Disability from Diseases, In-
juries, and Risk Factors in 1990 and Projected to
2020. Cambridge, MA: Harvard University Press;
1996:120–122.
3. Armed Forces Health Surveillance Branch.
Morbidity burdens attributable to various illnesses
and injuries in deployed (per Theater Medical Data
Store [TMDS]) active and reserve component ser-
vice members, U.S. Armed Forces, 2008–2014.
MSMR. 2015;22(8):17–22.
4. Armed Forces Health Surveillance Branch. Ab-
solute and relative morbidity burdens attributable to
various illnesses and injuries, active component,
U.S.Armed Forces, 2020. MSMR. 2021;28(5): 2–9.](https://image.slidesharecdn.com/msmrvolume28number05508-210702001148/85/DOD-2020-Health-of-the-Force-39-320.jpg)
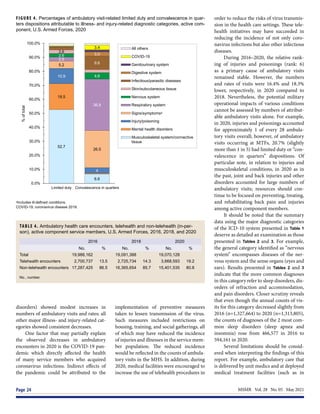
![MSMR Vol. 28 No. 05 May 2021
Page 40
Absolute and Relative Morbidity Burdens Attributable to Various Illnesses and
Injuries, Non-service Member Beneficiaries of the Military Health System, 2020
W H AT A R E T H E N E W F I N D I N G S ?
In 2020, mental health disorders accounted
for the largest proportions of the morbid-
ity and health care burdens that affected the
pediatric and younger adult beneficiary age
groups. Among adults aged 45–64 years,
musculoskeletal diseases accounted for the
most morbidity and health care burdens, and
among adults aged 65 years or older, cardio-
vascular diseases accounted for the most. As
in previous years, the results of this analysis
demonstrate that most health care services
in the Military Health System are delivered to
non-service member beneficiaries rather than
to service members.
W H AT I S T H E I M PA C T O N
R E A D I N E S S A N D F O R C E H E A LT H
P R O T E C T I O N ?
Illness and injury among military family mem-
ber dependents may negatively impact ser-
vice members’ readiness and their focus on
the mission by contributing to stress or by
affecting the mental health status of the ser-
vice member. The provision of health care
services to non-service member beneficiaries
is an important benefit that can improve mili-
tary family readiness and, in turn, improve the
overall readiness of the force.
I
ndividuals who are eligible for care
through the Military Health System
(MHS) (“beneficiaries”) include active
component service members and their eli-
gible family members, activated National
Guard and Reserve service members and
their eligible family members, and retirees
and their eligible family members. In fiscal
year 2019, there were approximately 9.57
million beneficiaries eligible for health care
in the MHS: 1.40 million active duty and
activated reserve component service mem-
bers, 1.66 million active duty family mem-
bers, 190,000 Guard/Reserve members,
810,000 Guard/Reserve family members,
and 5.51 million retirees and their family
members.1
Some beneficiaries of MHS care
do not enroll in the health care plans pro-
vided by the MHS (e.g., they use insurance
through their own employment), and some
of those who are enrolled do not seek care
through the MHS.
MHS beneficiaries may receive care
from resources provided directly by the
Uniformed Services (i.e., military medical
treatment facilities [MTFs]) or from civil-
ian health care resources (i.e., outsourced
[purchased] care) that supplement direct
military medical care.1
In 2020, approxi-
mately 6.28 million non-service member
beneficiaries utilized inpatient or outpa-
tient services provided by the MHS (data
source: the Defense Medical Surveillance
System [DMSS]).
Since 1998, the MSMR has published
annual summaries of the numbers and
rates of hospitalizations and outpatient
medical encounters to assess the health care
burdens of 16 categories of illnesses and
injuries among active component military
members. Beginning in 2001, the MSMR
complemented those summaries with
annual reports on the combined health care
burden of both inpatient and outpatient
care for 25 categories of health care. Since
then, the MSMR’s annual burden issue has
contained a report on hospital care, ambu-
latory care, and the overall burden of care
each for active component service mem-
bers. In 2014, for the first time and using
similar methodology, the MSMR published
a report that quantified the health care bur-
den for illnesses and injuries among non-
service members in calendar year 2013.2
The current report represents an update
and provides a summary of care provided
to non-service members in the MHS dur-
ing calendar year 2020. Health care bur-
den estimates are stratified by direct versus
outsourced care and across 4 age groups of
health care recipients.
M E T H O D S
The surveillance period was 1 Jan-
uary through 31 December 2020. The
surveillance population included all non-
service member beneficiaries of the MHS
who had at least 1 hospitalization or out-
patient medical encounter during 2020
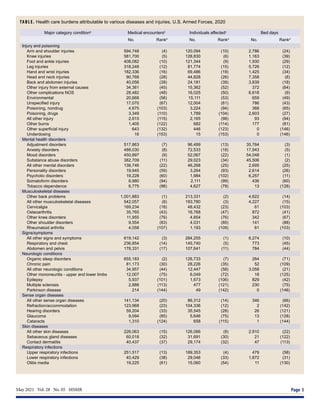
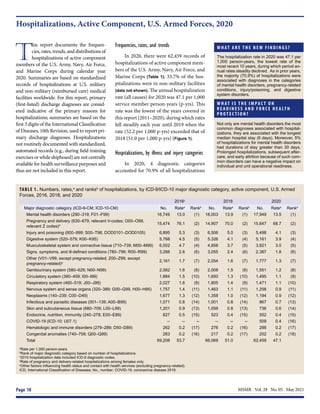
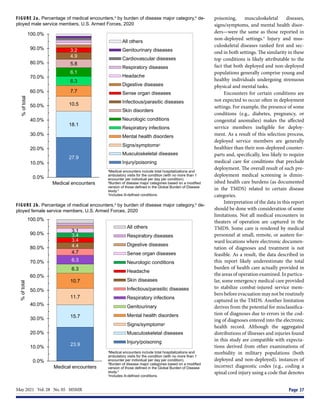
TABLE. Medical encounters,a
individuals affected,b
and hospital bed days, by source and age
group, non-service member beneficiaries, 2020
Medical
encounters
Individuals
affected
Hospital bed
days
Medical
encounters
per
individual
affected
No.
%
total
No.
%
total
No.
%
total
All non-service
member beneficiaries
82,165,960 --- 6,283,982 --- 6,040,345 --- 13.1
Source
Direct care only 8,029,056 9.8 659,160 10.5 406,559 6.7 n/a
Outsourced care only 74,136,904 90.2 4,654,433 74.1 5,633,786 93.3 n/a
Direct and outsourced care n/a n/a 970,389 15.4 n/a n/a n/a
Age groupc
0–17 years 11,236,430 13.7 1,350,529 21.5 448,418 7.4 8.3
18–44 years 12,376,592 15.1 1,416,484 22.5 680,173 11.3 8.7
45–64 years 17,188,968 20.9 1,446,057 23.0 915,790 15.2 11.9
65 years or older 41,363,957 50.3 2,070,901 33.0 3,995,964 66.2 20.0
a
Medical encounters include total hospitalizations and ambulatory visits for the condition (with no more than 1
encounter per individual per day per condition).
b
Individuals with at least 1 hospitalization or ambulatory visit for the condition.
c
Information on age was missing for 11 individuals.](https://image.slidesharecdn.com/msmrvolume28number05508-210702001148/85/DOD-2020-Health-of-the-Force-40-320.jpg)
![MSMR Vol. 28 No. 05 May 2021
Page 42
disease-related conditions and 25 major
categories based on a modified version
of the classification system developed for
the Global Burden of Disease Study.3
The
methodology for summarizing absolute
and relative morbidity burdens is described
on page 2 of this issue of the MSMR.
Results were stratified by source of health
care (direct [military treatment facilities]
vs outsourced [non-military medical facili-
ties]) and by age group (0–17 years, 18–44
years, 45–64 years, and 65 years or older).
For the purposes of the analysis of morbid-
ity burdens within the youngest age group,
developmental disorders were classified as
“mental health” disorders.
R E S U LT S
In the population of non-service mem-
ber MHS care recipients in 2020, there were
more females (56.9%) than males (43.1%);
more infants, children, and adolescents
(those younger than 20 years old: n=1.49
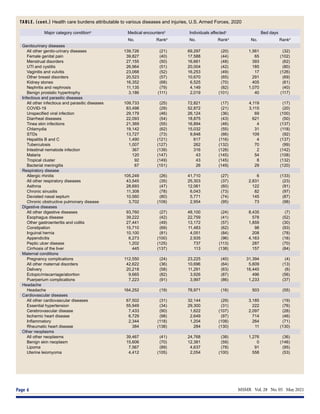
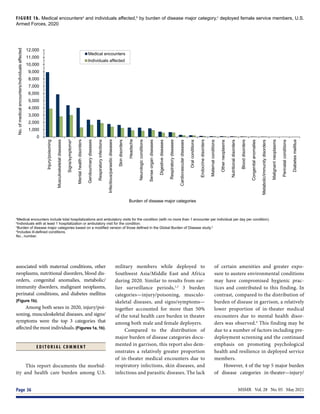
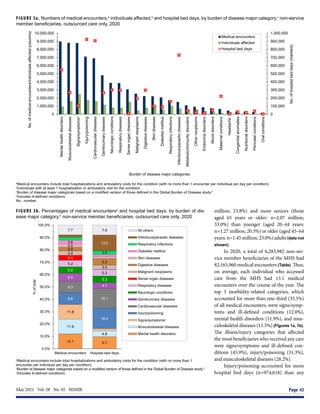
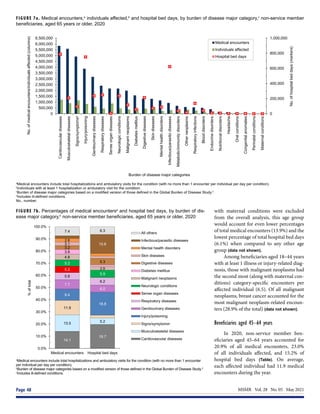
FIGURE 2a. Numbers of medical encounters,a
individuals affected,b
and hospital bed days, by burden of disease major category,c
non-service
member beneficiaries, direct care only, 2020
FIGURE 2b. Percentages of medical encountersa
and hospital bed days, by burden of dis-
ease major category,b
non-service member beneficiaries, direct care only, 2020
0
10,000
20,000
30,000
40,000
50,000
60,000
70,000
80,000
90,000
100,000
0
200,000
400,000
600,000
800,000
1,000,000
1,200,000
Signs/symptomsᵈ
Injury/poisoning
Mental
health
disorders
Musculoskeletal
diseases
Genitourinary
diseases
Cardiovascular
diseases
Skin
diseases
Maternal
conditions
Respiratory
infections
Sense
organ
diseases
Respiratory
diseases
Infectious/parasitic
diseases
Digestive
diseases
Diabetes
mellitus
Neurologic
conditions
Malignant
neoplasms
Endocrine
disorders
Metabolic/immunity
disorders
Headache
Other
neoplasms
Nutritional
disorders
Blood
disorders
Congenital
anomalies
Perinatal
conditions
Oral
conditions
No.
of
hospital
bed
days
(markers)
No.
of
medical
encounters/individuals
affected
(columns)
Burden of disease major categories
Medical encounters
Individuals affected
Hospital bed days
a
Medical encounters include total hospitalizations and ambulatory visits for the condition (with no more than 1 encounter per individual per day per condition).
b
Individuals with at least 1 hospitalization or ambulatory visit for the condition.
c
Burden of disease major categories based on a modified version of those defined in the Global Burden of Disease study.3
d
Includes ill-defined conditions.
No., number.
13.9
4.4
10.6
12.2
9.9
3.7
8.2
4.0
6.4
5.0
5.7
10.8
4.4
4.3
22.1
4.3
4.0
3.7
3.2
3.6
7.6
3.5
9.6
3.2
2.7
3.8
9.6
6.2
0.0%
10.0%
20.0%
30.0%
40.0%
50.0%
60.0%
70.0%
80.0%
90.0%
100.0%
Medical encounters Hospital bed days
%
of
total
All others
Malignant neoplasms
Neurologic conditions
Diabetes mellitus
Digestive diseases
Infectious/parasitic diseases
Respiratory diseases
Sense organ diseases
Respiratory infections
Maternal conditions
Skin diseases
Cardiovascular diseases
Genitourinary diseases
Musculoskeletal diseases
Mental health disorders
Injury/poisoning
Signs/symptomsᶜ
a
Medical encounters include total hospitalizations and ambulatory visits for the condition (with no more than 1
encounter per individual per day per condition).
b
Burden of disease major categories based on a modified version of those defined in the Global Burden of Disease study.3
c
Includes ill-defined conditions.](https://image.slidesharecdn.com/msmrvolume28number05508-210702001148/85/DOD-2020-Health-of-the-Force-42-320.jpg)
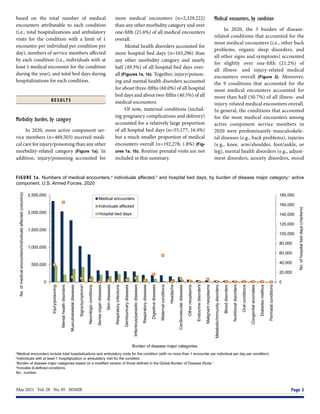
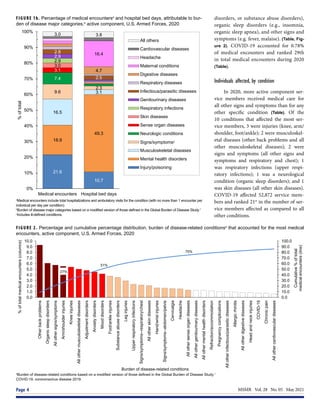
![May 2021 Vol. 28 No. 05 MSMR Page 49
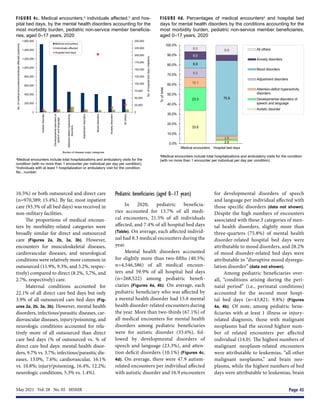
Of all morbidity-related categories,
musculoskeletal diseases accounted for the
most medical encounters (n=2,476,302;
14.4%) among older adult beneficiaries
(Figures 6a, 6b). In addition, in this age
group, back problems accounted for 43.9%
of all musculoskeletal disease-related
encounters (data not shown). Injury/poison-
ing accounted for more hospital bed days
(16.5% of the total) than any other cate-
gory of illnesses or injuries, and other com-
plications not otherwise specified (NOS)
and leg injuries accounted for 44.5% and
18.9%, respectively, of all injury/poisoning-
related bed days (data not shown). Digestive
diseases accounted for a larger percentage
(8.5%) of total hospital bed days among
beneficiaries in this age group compared to
those in the other age groups.
The most medical encounters per
affected individual were associated with
malignant neoplasms (6.5), mental health
disorders (6.2), musculoskeletal diseases
(4.9), neurologic conditions (4.6), injury/
poisoning (4.3), respiratory diseases
(4.3), and maternal conditions (4.2) (Fig-
ures 6a, 6b). Malignant neoplasms (8.1%)
accounted for a larger proportion of total
bed days among beneficiaries aged 45–64
years than among the other age groups of
beneficiaries. Breast cancer accounted for
nearly one quarter (24.1 %) of all malignant
neoplasm-related encounters among older
adult beneficiaries (data not shown).
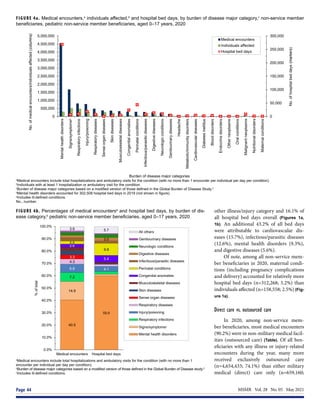
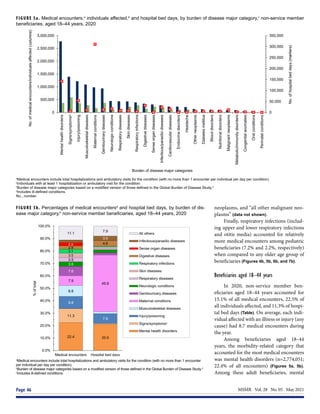
Beneficiaries aged 65 years or older
In 2020, non-service member benefi-
ciaries aged 65 years or older accounted
for approximately half (50.3%) of all medi-
cal encounters, nearly one-third (33.0%) of
all individuals affected, and approximately
two-thirds (66.2%) of hospital bed days
(Table 1). On average, each affected individ-
ual had 20.0 medical encounters during the
year.
Of all morbidity-related categories,
musculoskeletal diseases (n=5,832,066;
14.1%) and cardiovascular diseases
(n=5,579,928; 13.5%) accounted for the
most medical encounters, but cardiovas-
cular diseases accounted for the most
bed days (788,950 days; 19.7%) (Figures
7a, 7b). Back problems accounted for a
little more than one-third (35.8%) of all
musculoskeletal disease-related medi-
cal encounters and 37.0% of hospital bed
days (data not shown). Taken together,
essential hypertension (26.8%), ischemic
heart disease (13.7%), and cerebrovascu-
lar disease (10.0%) accounted for slightly
more than half (50.5%) of all cardiovas-
cular disease-related medical encounters,
and cerebrovascular disease accounted
for over one-third (33.7%) of all cardio-
vascular disease-related bed days (data not
shown).
Among the oldest age group of bene-
ficiaries, the most medical encounters per
affected individual were associated with
musculoskeletal diseases (6.3), malig-
nant neoplasms (5.8), respiratory diseases
(5.8), respiratory diseases (5.6), diseases
of the genitourinary system (5.4), mental
health disorders (5.1), and cardiovascu-
lar diseases (4.9) (Figure 7a). In this age
group, melanomas and other skin cancers
(19.6%); prostate cancer (14.5%); breast
cancer (12.3%); and trachea, bronchus,
and lung cancers (10.1%) accounted for
more than half (56.5%) of all malignant
neoplasm-related encounters (data not
shown). Chronic obstructive pulmonary
disease accounted for nearly one-third of
all medical encounters (32.4%) and 21.4%
of all bed days attributable to respiratory
diseases (data not shown).
Infectious and parasitic diseases
(15.6%) accounted for a larger propor-
tion of total bed days among the oldest age
group compared to the other age groups of
beneficiaries (Figures 7a, 7b). Coronavirus
disease 2019 (COVID-19) accounted for
more than one-quarter (27.4%) of infec-
tious/parasitic-related medical encounters
and 44.9% of hospital bed days (data not
shown). In contrast to infectious/parasitic
diseases, mental health disorders accounted
for smaller percentages of medical encoun-
ters (2.8%) and bed days (2.2%) among the
oldest age group compared to the younger
age groups.
E D I T O R I A L C O M M E N T
This report documents that a large
majority of the health care services for
current illness and injury (excluding
encounters with diagnoses identified by
Z-codes) that are provided through the
MHS to non-service member beneficia-
ries are delivered in non-military medi-
cal facilities (i.e., outsourced [purchased]
care). The report also documents that there
are pronounced differences in the types of
morbidity and the natures of the care pro-
vided for evaluation and treatment across
age groups of beneficiaries. Of particular
note, individuals aged 65 years or older
—33.0% of all non-service member ben-
eficiaries—accounted for approximately
half (50.3%) of all medical encounters and
two-thirds (66.2%) of all hospital bed days
delivered to all such beneficiaries.
In 2020, as in previous years, men-
tal health disorders accounted for the
largest proportions of the morbidity and
health care burdens that affected the pedi-
atric (aged 0–17 years) and younger adult
(aged 18–44 years) beneficiary age groups.
Developmental disorders were a signifi-
cant driver of health care utilization among
pediatric beneficiaries with 67.1% of medi-
cal encounters for mental health disorders
attributable to autistic disorder, devel-
opmental speech/language disorders, or
attention-deficit hyperactivity disorders. Of
particular note, children affected by autis-
tic disorder had, on average, 47.9 autism-
related encounters each during the 1-year
surveillance period.
Although mental health disorders
also accounted for more medical encoun-
ters among young adult (18–44 years) ben-
eficiaries than any other major category of
illnesses or injuries, the proportion of all
encounters attributable to mental health
disorders was markedly lower among
young adult (22.4%) than pediatric (40.5%)
beneficiaries. Also, as expected, the men-
tal health disorders that accounted for the
largest health care burdens among younger
adults (18–44 years)—mood, anxiety, and
adjustment disorders—differed from those
that most affected the pediatric age group.
It is not surprising that the highest
numbers and proportions of hospital bed
days among adults aged 18–44 years were for
maternal conditions because this age group
encompasses nearly all women of childbear-
ing age. Among older adults (aged 45–64
years), musculoskeletal diseases were the
greatest contributors to morbidity and](https://image.slidesharecdn.com/msmrvolume28number05508-210702001148/85/DOD-2020-Health-of-the-Force-49-320.jpg)