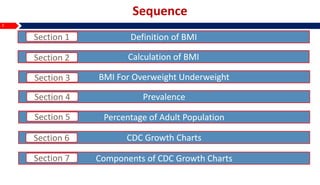
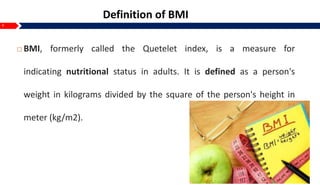
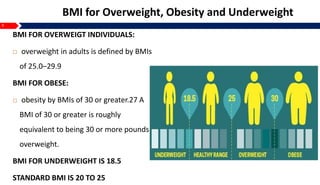
1
BODY MASS INDEX-BMI & CDC CHART
Presented to:
Dr. Aiza
Group Member:
1. DANIAL ROLL NO 47
2. IFRAH ROLL NO 3
3. AROOJ ROLL NO 49
4. AIMAN ROLL NO 39
5. ZAINAB ROLL NO 37
6. SANA ROLL NO 48
2
Sequence
Percentage of Adult PopulationSection 5
PrevalenceSection 4
BMI For Overweight UnderweightSection 3
Definition of BMISection 1
Components of CDC Growth ChartsSection 7
CDC Growth ChartsSection 6
Calculation of BMISection 2
3
BODY MASS INDEX-BMI
4
Definition of BMI
 BMI, formerly called the Quetelet index, is a measure for
indicating nutritional status in adults. It is defined as a person's
weight in kilograms divided by the square of the person's height in
meter (kg/m2).
5
Calculation of BMI
How to Calculate BMI
1. Multiply body weight in pounds by 703
2. Divide that number by height in inches
3. Divide that number by height once more
EXAMPLE:
For example, calculating the BMI for a 5'7" individual weighing 150 lb:
1. 150 lb 703 = 105,450
2. 105,450 divided by 67 inches = 1573.880
3. 1573.880 divided by 67 inches = 23.49 BMI
6
BMI for Overweight, Obesity and Underweight
BMI FOR OVERWEIGT INDIVIDUALS:
 overweight in adults is defined by BMIs
of 25.0–29.9
BMI FOR OBESE:
 obesity by BMIs of 30 or greater.27 A
BMI of 30 or greater is roughly
equivalent to being 30 or more pounds
overweight.
BMI FOR UNDERWEIGHT IS 18.5
STANDARD BMI IS 20 TO 25
7
Prevalence of Obesity
 Obesity rates have increased rapidly in the United States in the last two
decades.
 Nearly one-third of U.S. adults have a BMI or 30 or greater with black
females having the highest rate (49.6%) and males aged 75 and older the
lowest (18.0%).
 No adult population group meets the Healthy People 2010 target of 15%
obesity prevalence.
 Using the criterion of BMI between 18.5–24.9, only 33% of U.S.
 Adults are at a healthy weight, down from 51% in 1960 For gender
differences in overweight, obesity, and healthy weight.
8
Percentage of the adult population (age 20–74) who is at healthy,
OVERWEIGHT obese, by Gender
GENDER OVERWEIGHT OBESE
HEALTHY
WEIGHT
MALE 69% 28% 32%
FEMALE 62% 34%
36%
Prevalence of Obesity:
9
Overweight and Obesity
Factors contributing to the increase include:
Having one or more overweight parents
Having a condition that limits mobility
Inadequate physical activity
Diets high in calories, sugars, & fat
 Environmental Factor
10
Health Implications of Adolescent Overweight
Range of complications associated with being overweight include:
• Hypertension
• Dyslipidemia
• Insulin resistance or type 2 diabetes mellitus
• Sleep apnea
• Hypoventilation disorders
• Self esteem
• Orthopedic problems
• Hepatic disease
• Body image disturbances
11
Primary Care Assessments Based on Adolescent BMI
12
National Guidelines for Weight Management Therapy
Four stages of treatment:
1. Prevention plus
2. Structured weight management
3. Comprehensive multidisciplinary intervention
4. Tertiary care intervention
13
National Guidelines for Weight Management Therapy
1. Prevention plus
BMI >85th but <95th without co-morbidity conditions
Level of treatment builds upon
a. Basic nutrition
b. Physical activity
Goal
a. Promote health
b. Prevent disease
14
2. Structured weight management
Same behaviors as stage 1
More structured
a. Emphasize nutrient-dense foods
b. Minimize energy-dense foods
National Guidelines for Weight Management Therapy
15
3. Comprehensive multidisciplinary intervention
Same behavioral goals as stage 2
More structured eating
More structured physical activity plan
Designed to lead to negative caloric balance
National Guidelines for Weight Management Therapy
16
4. Tertiary care intervention
Appropriate with severely obese youth or those who have significant,
chronic co-morbidity conditions
Level of treatment provided through a tertiary weight management center
Diet and activity counseling with behavior modifications
Treatments may include
i. Meal replacement
ii. A very low energy diet
iii. Medication
iv. Surgery may be implemented
National Guidelines for Weight Management Therapy
17
Overview of Staged Treatment
18
Guidelines for Consideration of Bariatric Surgery
19
Potential Effects of Substance Use on Nutrition Status
20
CDC CHART
21
CDC Growth Charts
 Growth charts consist of a series of percentile curves that illustrate the
distribution of selected body measurements in children. Pediatric growth
charts have been used by pediatricians, nurses, and parents to track
the growth of infants.
22
Components Of CDC Growth Charts
 Weight, stature, length and head circumference are commonly used to
assess size and growth. When any of these measures are combined with
age or length/stature the result is an anthropometric index (for
example, weight-for-age).
23
Normal Growth and Development
Measurement techniques
Growth velocity will slow down during the school-age years
Should continue to monitor growth periodically
Weight and height should be plotted on the appropriate growth chart
24
2000 CDC growth charts
Tools to monitor the growth of a child for the following parameters
Weight-for-age
Stature-for-age
Body mass index (BMI)-for-age
Can be downloaded from CDC website: www.cdc.gov/nchs
Normal Growth and Development
25
2000 CDC growth charts
Based on data from cycles 2 & 3 of the National Health & Examination
Survey (NHES) & the National Health & Nutrition Examination Surveys
(NHANES) I, II, & III
WHO Growth References
Available at www.who.int/childgrowth
Normal Growth and Development
26
Normal Growth and Development
27
Reference
Chapter: 12
Chapter: 15
28

BMI & CDC Chart

  • 1.
    1 BODY MASS INDEX-BMI& CDC CHART Presented to: Dr. Aiza Group Member: 1. DANIAL ROLL NO 47 2. IFRAH ROLL NO 3 3. AROOJ ROLL NO 49 4. AIMAN ROLL NO 39 5. ZAINAB ROLL NO 37 6. SANA ROLL NO 48
  • 2.
    2 Sequence Percentage of AdultPopulationSection 5 PrevalenceSection 4 BMI For Overweight UnderweightSection 3 Definition of BMISection 1 Components of CDC Growth ChartsSection 7 CDC Growth ChartsSection 6 Calculation of BMISection 2
  • 3.
  • 4.
    4 Definition of BMI BMI, formerly called the Quetelet index, is a measure for indicating nutritional status in adults. It is defined as a person's weight in kilograms divided by the square of the person's height in meter (kg/m2).
  • 5.
    5 Calculation of BMI Howto Calculate BMI 1. Multiply body weight in pounds by 703 2. Divide that number by height in inches 3. Divide that number by height once more EXAMPLE: For example, calculating the BMI for a 5'7" individual weighing 150 lb: 1. 150 lb 703 = 105,450 2. 105,450 divided by 67 inches = 1573.880 3. 1573.880 divided by 67 inches = 23.49 BMI
  • 6.
    6 BMI for Overweight,Obesity and Underweight BMI FOR OVERWEIGT INDIVIDUALS:  overweight in adults is defined by BMIs of 25.0–29.9 BMI FOR OBESE:  obesity by BMIs of 30 or greater.27 A BMI of 30 or greater is roughly equivalent to being 30 or more pounds overweight. BMI FOR UNDERWEIGHT IS 18.5 STANDARD BMI IS 20 TO 25
  • 7.
    7 Prevalence of Obesity Obesity rates have increased rapidly in the United States in the last two decades.  Nearly one-third of U.S. adults have a BMI or 30 or greater with black females having the highest rate (49.6%) and males aged 75 and older the lowest (18.0%).  No adult population group meets the Healthy People 2010 target of 15% obesity prevalence.  Using the criterion of BMI between 18.5–24.9, only 33% of U.S.  Adults are at a healthy weight, down from 51% in 1960 For gender differences in overweight, obesity, and healthy weight.
  • 8.
    8 Percentage of theadult population (age 20–74) who is at healthy, OVERWEIGHT obese, by Gender GENDER OVERWEIGHT OBESE HEALTHY WEIGHT MALE 69% 28% 32% FEMALE 62% 34% 36% Prevalence of Obesity:
  • 9.
    9 Overweight and Obesity Factorscontributing to the increase include: Having one or more overweight parents Having a condition that limits mobility Inadequate physical activity Diets high in calories, sugars, & fat  Environmental Factor
  • 10.
    10 Health Implications ofAdolescent Overweight Range of complications associated with being overweight include: • Hypertension • Dyslipidemia • Insulin resistance or type 2 diabetes mellitus • Sleep apnea • Hypoventilation disorders • Self esteem • Orthopedic problems • Hepatic disease • Body image disturbances
  • 11.
    11 Primary Care AssessmentsBased on Adolescent BMI
  • 12.
    12 National Guidelines forWeight Management Therapy Four stages of treatment: 1. Prevention plus 2. Structured weight management 3. Comprehensive multidisciplinary intervention 4. Tertiary care intervention
  • 13.
    13 National Guidelines forWeight Management Therapy 1. Prevention plus BMI >85th but <95th without co-morbidity conditions Level of treatment builds upon a. Basic nutrition b. Physical activity Goal a. Promote health b. Prevent disease
  • 14.
    14 2. Structured weightmanagement Same behaviors as stage 1 More structured a. Emphasize nutrient-dense foods b. Minimize energy-dense foods National Guidelines for Weight Management Therapy
  • 15.
    15 3. Comprehensive multidisciplinaryintervention Same behavioral goals as stage 2 More structured eating More structured physical activity plan Designed to lead to negative caloric balance National Guidelines for Weight Management Therapy
  • 16.
    16 4. Tertiary careintervention Appropriate with severely obese youth or those who have significant, chronic co-morbidity conditions Level of treatment provided through a tertiary weight management center Diet and activity counseling with behavior modifications Treatments may include i. Meal replacement ii. A very low energy diet iii. Medication iv. Surgery may be implemented National Guidelines for Weight Management Therapy
  • 17.
  • 18.
    18 Guidelines for Considerationof Bariatric Surgery
  • 19.
    19 Potential Effects ofSubstance Use on Nutrition Status
  • 20.
  • 21.
    21 CDC Growth Charts Growth charts consist of a series of percentile curves that illustrate the distribution of selected body measurements in children. Pediatric growth charts have been used by pediatricians, nurses, and parents to track the growth of infants.
  • 22.
    22 Components Of CDCGrowth Charts  Weight, stature, length and head circumference are commonly used to assess size and growth. When any of these measures are combined with age or length/stature the result is an anthropometric index (for example, weight-for-age).
  • 23.
    23 Normal Growth andDevelopment Measurement techniques Growth velocity will slow down during the school-age years Should continue to monitor growth periodically Weight and height should be plotted on the appropriate growth chart
  • 24.
    24 2000 CDC growthcharts Tools to monitor the growth of a child for the following parameters Weight-for-age Stature-for-age Body mass index (BMI)-for-age Can be downloaded from CDC website: www.cdc.gov/nchs Normal Growth and Development
  • 25.
    25 2000 CDC growthcharts Based on data from cycles 2 & 3 of the National Health & Examination Survey (NHES) & the National Health & Nutrition Examination Surveys (NHANES) I, II, & III WHO Growth References Available at www.who.int/childgrowth Normal Growth and Development
  • 26.
  • 27.
  • 28.