

![Acknowledgments: Whatcom County Planning & Development Services WA Dept of Ecology WDFW EPA PSP WSDOT More on Birch Bay Action Plan: http://www.co.whatcom.wa.us/pds/naturalresources/specialprojects/birchbaywatershed-actionplan.jsp Questions and Information: Margaret Clancy – ESA Adolfson [email_address]](https://image.slidesharecdn.com/birchbaylanduse-100309003810-phpapp01/85/Birch-Bay-Watershed-Characterization-35-320.jpg)

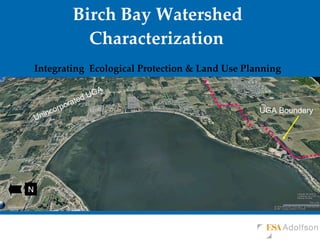
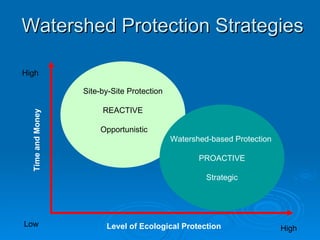
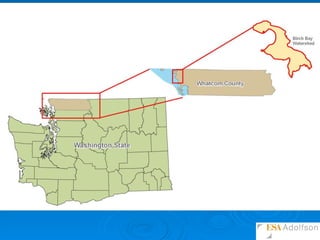
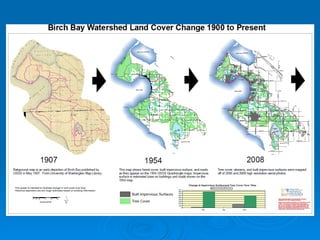
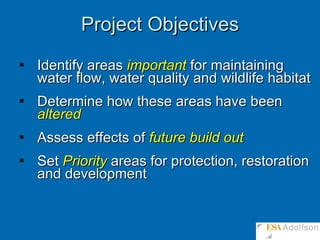
The document outlines the Birch Bay Watershed characterization, focusing on integrating ecological protection with land use planning to support water flow, water quality, and wildlife habitat amid projected population growth. It emphasizes strategic protection and restoration priorities based on hydrology, habitat quality, and future development patterns, while recommending management approaches to mitigate negative impacts. Key stakeholders like Whatcom County and environmental agencies are involved in the planning and implementation process.


