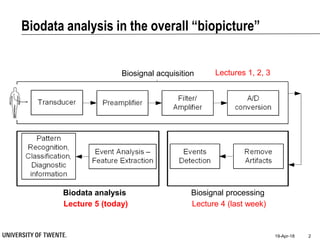
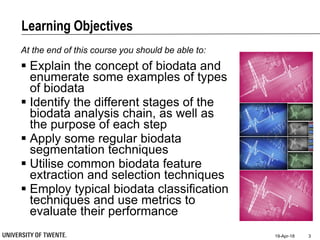
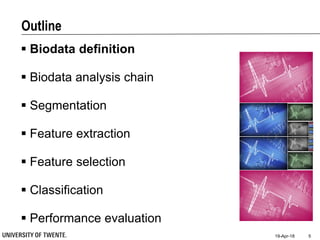
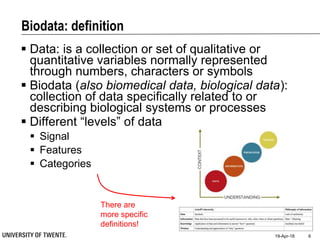
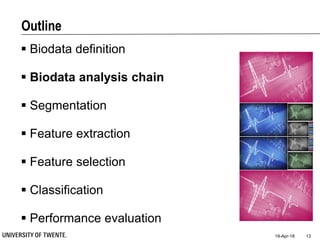
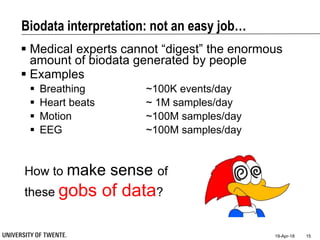
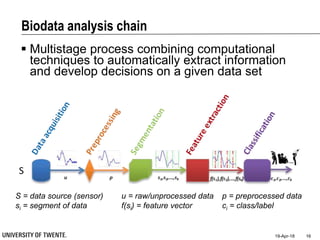
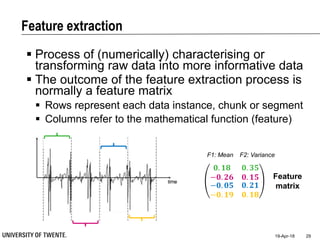
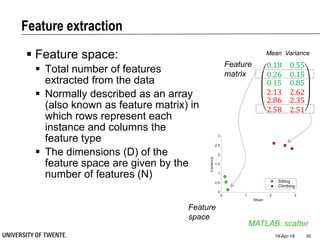
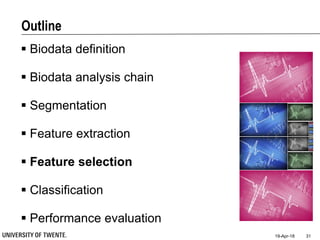
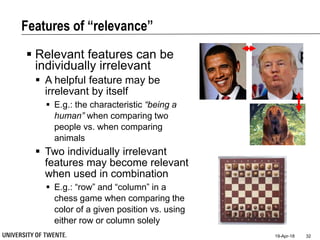
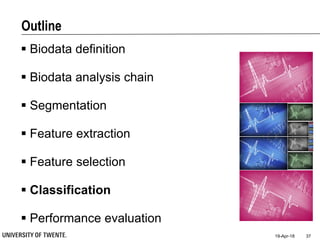
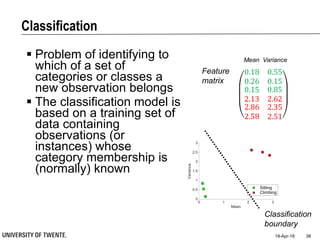
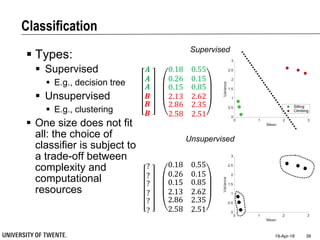
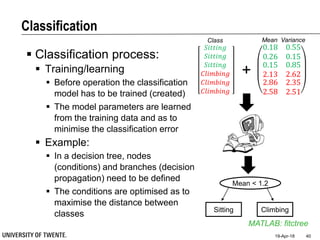
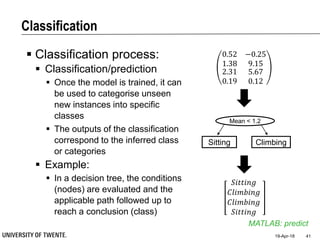
This document provides an overview of biodata analysis techniques for medical applications. It defines biodata as biological data collected from living systems. The biodata analysis chain involves several key steps: segmentation to divide data into windows, feature extraction to characterize the data numerically, feature selection to identify the most relevant features, and classification to assign categories or labels to new data based on a trained model. The document reviews techniques for each step of the analysis chain and provides examples of applying these techniques to motion and other types of medical biodata. The overall aim is to automatically extract useful information from large amounts of biodata to help medical experts with interpretation and decision making.
image denoising technique using disctere wavelet transformalishapb
This document discusses image denoising techniques using discrete wavelet transforms. It begins with an introduction and lists the objectives, goals, and types of noise that affect images. It then describes several denoising techniques including spatial filtering methods like mean, wiener and median filters as well as frequency domain filtering and wavelet domain filtering. The document provides block diagrams of the wavelet denoising process and evaluates performance of various denoising algorithms using metrics like PSNR and SSIM. It was implemented in MATLAB and concluded that wavelet thresholding provides significant improvement in image quality while preserving useful information.
Image segmentation refers to decomposing a scene into components. There is no single correct segmentation. Segmentation techniques include edge-based, region-filling, color-based using color spaces, texture-based, disparity-based, motion-based, and techniques for documents, medical, range, and biometric images. The k-means clustering algorithm is commonly used to group similar pixels into segments via an iterative process of assignment and centroid update.
This document contains mathematical equations and statistical formulas relating to principal component analysis (PCA). PCA is used to reduce the dimensionality of large data sets while retaining most of the variation in the data. The equations define terms such as component scores, eigenvalues, variance explained by each component, and variable importance in projection (VIP) values.
Interconnect Parameter in Digital VLSI DesignVARUN KUMAR
This document discusses key interconnect parameters for VLSI design including capacitance, resistance, and inductance. It notes that as device sizes shrink, wire lengths increase which leads to greater parasitic effects that must be considered. The document outlines how capacitance depends on shape and surroundings and can be modeled as parallel plates. Resistance is defined by resistivity, length and cross-sectional area, with aluminum a common interconnect material. Inductance also becomes important at higher frequencies. Models are simplified by ignoring less dominant effects.
SS - Unit 1- Introduction of signals and standard signalsNimithaSoman
This document provides an introduction to signals and systems. It discusses the classification of signals as continuous-time or discrete-time, periodic or aperiodic, deterministic or random, energy or power signals. It also discusses the classification of systems as continuous-time or discrete-time, linear or nonlinear, time-variant or time-invariant, causal or non-causal, stable or unstable. It then introduces some basic standard signals including step, ramp, impulse, sinusoidal, and exponential signals. It describes the properties and applications of these signals.
This document contains a list of questions related to the topics covered in the VLSI Design course at Chendu College of Engineering & Technology. There are questions from five units: CMOS Technology, Circuit Characterization and Simulation, Digital System Design with Programmable Devices, Testing and Testability, and Verilog HDL. Some of the topics covered include CMOS technology issues, MOSFET operation, circuit modeling and simulation, logic families, ASIC design styles, testing techniques, and Verilog modeling.
Design-for-Test (Testing of VLSI Design)Usha Mehta
This document provides an acknowledgement and thanks to various professors and scientists for their work that contributed to the content in this presentation on emerging technologies in testing. It then provides an overview of topics related to testing quality, economics of testing, testability, design-for-test, and different digital testing techniques including ad-hoc methods, structured methods like scan testing and built-in self-test (BIST).
This document summarizes key concepts in digital and analog communications:
1) It defines source coding, channel encoding/decoding, digital modulation/demodulation, and how digital communication system performance is measured in terms of error probability.
2) Thermal noise in receivers is identified as the dominant source of noise limiting performance in VHF and UHF bands.
3) Storing data on magnetic/optical disks is analogous to transmitting a signal over a radio channel, with similar signal processing used for recovery.
4) Digital processing avoids signal degradation but requires more bandwidth, while analog processing is sensitive to variations but does not lose quality over time.
5) Fourier analysis is used to derive the
The document discusses pass transistor logic circuits. It describes how nMOS pass transistors can transfer logic 1 and 0 signals. Transmission gates are introduced which use both nMOS and pMOS pass transistors to pass strong signals in both directions. Applications of transmission gates include multiplexers, XOR gates, D latches, and D flip-flops. Clock skew management and different pass transistor logic families are also covered.
Machine Learning : Latent variable models for discrete data (Topic model ...)Yukara Ikemiya
Machine Learning, A Probabilistic Perspective
Chapter 27 : Latent variable models for discrete data
topic model, LDA, graph structure, relational data
text analysis
トピックモデル・テキスト分析・
A smart environment is one that is able to identify people, interpret their actions, and react appropriately. Thus, one of the most important building blocks of smart environments is a person identification system. Face recognition devices are ideal for such systems, since they have recently become fast, cheap, unobtrusive, and, when combined with voice-recognition, are very robust against changes in the environment.
The document discusses implementing convolution on an FPGA. It begins by introducing convolution and its applications in image processing. It then discusses the scope and technical approach of implementing discrete linear convolution on FPGA kits in order to perform convolution on images in real-time. The document outlines the structure of FPGAs, including configurable logic blocks and wiring tracks. It also discusses software requirements and provides an organization plan for subsequent chapters on linear convolution, FPGA technology, and a literature survey.
This document discusses principal component analysis (PCA) and its applications in image processing and facial recognition. PCA is a technique used to reduce the dimensionality of data while retaining as much information as possible. It works by transforming a set of correlated variables into a set of linearly uncorrelated variables called principal components. The first principal component accounts for as much of the variability in the data as possible, and each succeeding component accounts for as much of the remaining variability as possible. The document provides an example of applying PCA to a set of facial images to reduce them to their principal components for analysis and recognition.
This document discusses arithmetic coding, an entropy encoding technique. It begins with an introduction comparing arithmetic coding to Huffman coding. The document then provides pseudocode for the basic encoding and decoding algorithms. It describes how scaling techniques like E1 and E2 scaling allow for incremental encoding and decoding as well as achieving infinite precision with finite-precision integers. The document outlines applications of arithmetic coding in areas like JBIG, H.264, and JPEG 2000.
This document discusses different realization structures for causal IIR digital filters, including direct form I and II structures, cascade structures, and parallel form I and II structures. It provides examples of implementing a 3rd order IIR transfer function using each type of structure. Direct form I structures realize the coefficients directly from the transfer function. Cascade structures decompose the transfer function into lower order sections. Parallel forms use partial fraction expansions to decompose into parallel signal flows.
Probabilistic power analysis provides a computationally efficient alternative to traditional power analysis by modeling logic signals as random processes characterized by statistical parameters rather than exact signal values over time. The key parameters used are static probability, which is the probability a signal is at logic 1, and transition density, which is the number of signal transitions per unit time. These parameters can be propagated through a circuit based on Boolean logic to estimate power consumption without simulating every signal transition. While faster, probabilistic analysis loses some accuracy by ignoring signal correlations, glitches, and gate delays.
The document discusses computer memory and its types. It begins by defining computer memory as the storage space where data and instructions are stored to be processed. Memory is divided into small parts called cells, each with a unique address. There are two main types of memory: internal memory like cache and RAM, and external memory like hard disks. Memory hierarchy characteristics include increasing capacity, decreasing cost per bit, and increasing access time as one moves down the hierarchy. RAM is further divided into static RAM and dynamic RAM. The document also discusses different types of ROM and how programmable logic devices like PROM, PAL, PLA, and FPGA work.
Questa presentazione ha come tema l'infografica e la visualizzazione dei dati. prende spunto principalmente dal testo di Alberto Cairo "L'arte funzionale".
The document discusses digital signal processing (DSP) and its applications in biometric systems. It provides an overview of DSP, including its history, components, and key operations such as filtering, spectral analysis, convolution, correlation and digital filtering. DSP involves extracting information from digitized signals and manipulating them. Compared to general purpose processors, DSP processors are specialized for numerically intensive signal processing tasks and have features like multiply-accumulate hardware that improve efficiency. Common applications of DSP include speech recognition, image processing, and biometric systems.
The document discusses decision trees for data mining and artificial intelligence. It describes how decision trees are constructed in a top-down manner by choosing attributes that best split the data at each node. The splitting attribute is selected using an impurity measure like information gain or gain ratio, which evaluate how well each attribute separates the data classes. Pruning techniques are also mentioned to simplify trees and avoid overfitting. Examples of decision tree applications in areas like credit risk assessment and disease diagnosis are provided.
The document is a seminar report submitted for a degree in information technology. It discusses big data, providing an overview of the topic. Some key points:
- Big data refers to large, complex datasets that are difficult to process using traditional data management tools. It is characterized by high volume, velocity, and variety of data.
- The amount of data in the world is growing exponentially as more devices are connected and data is collected from various sources like sensors, social media, etc.
- Big data tools allow organizations to gain insights from large, diverse datasets and make improved decisions. However, challenges include security, access, cleaning, and representation of big data.
- Applications of big data include government
Healthcare expenditure is set to rise over the coming years. Cost will undoubtedly influence patients’ decision-making when it comes to diagnosis and treatment.
For healthcare providers, providing up-front cost estimates improves patient experience, making patients more willing to return (if required) in the future. For patients, having accurate pre-admission estimates allow for informed decisions and adequate preparation, reducing payment challenges after treatment. Ultimately, this case is a first step towards (i) standardization of healthcare cost estimation and (ii) price transparency to build trust between healthcare providers, payers, and patients.
Big Data & Machine Learning - TDC2013 São Paulo - 12/0713Mathieu DESPRIEE
Machine learning and big data technologies enable new types of data analysis. Hadoop is an open-source framework that allows distributed storage and processing of large datasets across clusters of computers. It includes tools for working with structured and unstructured data to power applications in areas like recommendations, customer churn prediction, and more.
The document provides an overview of machine learning. It defines machine learning as algorithms that can learn from data to optimize performance and make predictions. It discusses different types of machine learning including supervised learning (classification and regression), unsupervised learning (clustering), and reinforcement learning. Applications mentioned include speech recognition, autonomous robot control, data mining, playing games, fault detection, and clinical diagnosis. Statistical learning and probabilistic models are also introduced. Examples of machine learning problems and techniques like decision trees and naive Bayes classifiers are provided.
This thesis examines an unsupervised approach to classifying users in online social networks using only simple statistics about users' behavior. The author applies sparse principal component analysis (SPCA) to Twitter data without using text or profile content. Key contributions include:
1. Demonstrating that meaningful user classification is possible using only statistics on network structure and communication patterns.
2. Developing a "semantic robustness" score to evaluate how well classifications retain meaning when reanalyzing subsets of the data.
3. Identifying distinct types of users from the top principal components, including measures of influence, spam detectors, and content providers.
Software defined networks (SDNs) is one of the most emerging field and will cause
revolution in the Information Technology (IT) industry. The flexibility in the SDNs
make it most attractive technology to adopt in all type of networks. This flexibility in
the network made the SDNs more prone to the security issues so it is important to cater
these issues in start from the SDN design up-to the deployment and operations. This
Paper proposed a DNS based approach to prevent SDNs from botnet by applying one
million web database concept without reading packet payload. To do any activity, Bot
need to communicate with CnC and requires DNS to IP resolution. For any request
having destination port 53 (DNS) will be checked. The protocol will get all matching
traffic and will send it to 1Mdb. If URL Exists in 1Mdb then do not respond otherwise
send reply with remove flow and block flow to the controller. This approach will use
Machine learning algorithms to classify the traffic as BOT or normal traffic. Naive
Bayes Classifier is used to classify the data using python programming language. The
selection of dataset is very important task for machine learning based botnet detection
and prevention techniques. The poor selection of dataset possibly lead to biased results.
The real world and publically available dataset is a good choice for evaluation of botnet
detection techniques. To meet these criteria, publicly available CTU-43 botnet dataset
has been used. This dataset provide packet dumps (pcap files) of seven real botnets
(Neris, Rbot, Virut, Murlo, Menti, Sogou, and NSIS). We will use these files to generate
botnet traffic for evaluation and test our model. To generate normal traffic, we selected
ISOT dataset. This dataset provides a single pcap file having normal traffic and traffic
for weladec and zeus botnet.
Big Data & Machine Learning - TDC2013 Sao PauloOCTO Technology
BigData and Machine Learning: Usage and Opportunities for your IT department
Talk presented at The Developer Conference in São Paulo - 12/0713
Mathieu DESPRIEE
Data Science for Internet of Things with Ajit JaokarJessica Willis
The document discusses methodologies for data science and the Internet of Things (IoT). It begins by noting that there is currently no single agreed upon methodology for solving data science problems for IoT (IoT analytics). It then poses some initial questions on whether a distinct IoT data science methodology is needed, and if IoT problems warrant a specific approach. While IoT data science problems are similar to general data science problems, the document notes there are some unique considerations for IoT, such as the use of hardware, high data volumes, and streaming data.
The document discusses methodologies for data science and the Internet of Things (IoT). It begins by noting that there is currently no single agreed upon methodology for solving data science problems for IoT (IoT analytics). It then poses some initial questions on whether a distinct IoT data science methodology is needed, and if IoT problems warrant a specific approach. While IoT analytics problems are typical data science problems, the document notes there are some unique considerations for IoT, such as the use of hardware, high data volumes, and streaming data.
This document is a degree project from KTH Royal Institute of Technology that examines using social media analysis to predict stock prices. Specifically, it collected Twitter data related to Microsoft, Netflix, and Walmart and used machine learning algorithms like artificial neural networks to analyze the relationship between sentiment in tweets and future stock movement. The best model achieved 80% accuracy in predicting the direction of price changes for one of the companies based on Twitter sentiment alone.
Introduction to Datamining Concept and TechniquesSơn Còm Nhom
This document provides an introduction to data mining techniques. It discusses data mining concepts like data preprocessing, analysis, and visualization. For data preprocessing, it describes techniques like similarity measures, down sampling, and dimension reduction. For data analysis, it explains clustering, classification, and regression methods. Specifically, it gives examples of k-means clustering and support vector machine classification. The goal of data mining is to retrieve hidden knowledge and rules from data.
Business Process Analytics: From Insights to PredictionsMarlon Dumas
Keynote talk at the 13th Baltic Conference on Databases and Information Systems, Trakai, Lithuania, 2 July 2018.
Abstract
Business process analytics is a body of methods for analyzing data generated by the execution of business processes in order to extract insights about weaknesses and improvement opportunities, both at the tactical and operational levels. Tactical process analytics methods (also known as process mining) allow us to understand how a given business process is actually executed, if and how its execution deviates with respect to expected or normative pathways, and what factors contribute to poor process performance or undesirable outcomes. Meantime, operational process analytics methods allow us to monitor ongoing executions of a business process in order to predict future states and undesirable outcomes at runtime (predictive process monitoring). Existing methods in this space allow us to predict, for example, which task will be executed next in a case, when, and who will perform it? When will an ongoing case complete? What will its outcome be and how can negative outcomes be avoided? This keynote will present a framework for conceptualizing business process analytics methods and applications. The talk will provide an overview of state-of-art methods and tools in the field and will outline open challenges and research opportunities.
Performance characterization in computer visionpotaters
This document provides a tutorial on evaluating the performance of computer vision algorithms. It explains that properly characterizing performance through statistical analysis is important for advancing the field. The typical process involves running algorithms on test data and tracking true positives, false positives, etc. Performance is usually assessed using tools like ROC curves that account for the tradeoff between correctness and errors. Comparing multiple algorithms requires ensuring statistical significance and using standardized datasets.
This document is a machine learning class assignment submitted by Trushita Redij to their supervisor Abhishek Kaushik at Dublin Business School. The assignment discusses data preprocessing techniques, decision trees, the Chinese Restaurant algorithm, and building supervised learning models. Specifically, linear regression and KNN classification models are implemented on population data from Ireland to predict total population and classify countries.
Machine learning for sensor Data AnalyticsMATLABISRAEL
במצגת זאת נראה כיצד עושים Machine Learning בסביבת MATLAB. נציג מספר יכולות ואפליקציות מובנות ההופכות את תהליך למידת המכונה ליעיל ומהיר יותר – כלים כמו ה-Classification Learner, ה-Regression Learner ו-Bayesian Optimization. בהסתמך על מידע המתקבל מחיישני סמארטפון, נבנה מערכת סיווג המזהה את הפעילות שמבצע המשתמש – הליכה, טיפוס במדרגות, שכיבה, וכו'
Is Machine Learning… a piece of cake? 10 minutes to give you a first taste of Machine Learning.
BeeBryte - Energy Intelligence & Automation
www.beebryte.com
1. The document provides an introduction to data mining, describing what data mining is and the data mining process.
2. It discusses different types of data like transactional data, temporal data, spatial data, and unstructured data. Common data mining tasks are also introduced such as classification, clustering, and frequent pattern mining.
3. The document serves as a high-level overview of key concepts in data mining, the data mining process, different types of data commonly analyzed, and some popular data mining algorithms and tasks.
The document discusses using statistical and machine learning methods to analyze big data from Intel's data centers to classify computing jobs by expected runtime. It summarizes defining the problem, available data on past jobs, exploring the runtime distribution, constructing classes using a mixture model, and estimating model parameters using the EM algorithm. The goal is to optimize job scheduling by separating short and long jobs into different queues.
Measuring human behaviour to inform e-coaching actionsOresti Banos
Having a clear understanding of people’s behaviour is essential to characterise patient progress, make treatment decisions and elicit effective and relevant coaching actions. Hence, a great deal of research has been devoted in recent years to the automatic sensing and analysis of human behaviour.
Sensing options are currently unparalleled due to the number of smart, ubiquitous sensor systems developed and deployed globally. Instrumented devices such as smartphones or wearables enable unobtrusive observation and detection of a wide variety of behaviours as we go about our physical and virtual interactions with the world.
The vast amount of data generated by such sensing infrastructures can be then analysed by powerful machine-learning algorithms, which map the raw data into predictive trajectories of behaviour. The processed data is combined with computerised behaviour change frameworks and domain knowledge to dynamically generate tailored recommendations and guidelines through advanced reasoning.
In view of the above, this keynote explores the recent advances in the automatic sensing and analysis of human behaviour to inform e-coaching actions.
Emotion AI: Concepts, Challenges and OpportunitiesOresti Banos
This presentation performs an in-depth analysis of the rather emerging field of Emotion AI. The presentation aims at covering different aspects of Emotion AI, ranging from emotion elicitation and modelling to sensing and recognition. Special attention is paid to describing the art of the possible with respect to existing technologies for emotion sensing and AI-models for the automatic recognition of human emotions.
This document discusses biosignal processing and covers the following key points in 3 sentences:
It provides an overview of biosignal processing techniques including filtering to remove artifacts, event detection, and compression. It defines biosignals and gives examples like ECG and EMG. The document outlines topics like characterizing biosignals in the time and frequency domains, and techniques for time-frequency analysis like short-time Fourier transform and wavelet transform.
Automatic mapping of motivational text messages into ontological entities for...Oresti Banos
Unwholesome lifestyles can reduce lifespan by several years or even decades. Therefore, raising awareness and promoting healthier behaviors prove essential to revert this dramatic panorama. Virtual coaching systems are at the forefront of digital solutions to educate people and procure a more effective health self-management. Despite their increasing popularity, virtual coaching systems are still regarded as entertainment applications with an arguable efficacy for changing behaviors, since messages can be perceived to be boring, unpersonalized and can become repetitive over time. In fact, messages tend to be quite general, repetitive and rarely tailored to the specific needs, preferences and conditions of each user. In the light of these limitations, this work aims at help building a new generation of methods for automatically generating user-tailored motivational messages. While the creation of messages is addressed in a previous work, in this paper the authors rather present a method to automatically extract the semantics of motivational messages and to create the ontological representation of these messages. The method uses first natural language processing to perform a linguistic analysis of the message. The extracted information is then mapped to the concepts of the motivational messages ontology. The proposed method could boost the quantity and diversity of messages by automat- ically mining and parsing existing messages from the internet or other digitised sources, which can be later tailored according to the specific needs and particularities of each user.
Enabling remote assessment of cognitive behaviour through mobile experience s...Oresti Banos
The document describes a mobile experience sampling tool called MobileCogniTracker that aims to remotely assess cognitive behavior. It integrates cognitive experience sampling methods and passive mobile sensing to measure cognition in daily life. A study evaluated MobileCogniTracker usability in 13 older adult participants. Results found the system easy to use with a usability score over 68. Experts saw tasks like orientation and recall as feasible but had concerns about language tasks and smartphone influences. The tool shows potential but requires more study in cognitively impaired users and minimizing learning effects.
Ontological Modeling of Motivational Messages for Physical Activity CoachingOresti Banos
Smart coaching systems are named to play a central role in both prevention and intervention strategies for behavioral change. While relevant progresses have been made in terms of automatic and continuous monitoring of behavioral aspects, e.g. amount and variety of physical activity, coaching and feedback techniques are still in an infancy stage. Current smart coaching strategies are mostly based on handcrafted messages which hardly personalize to the needs, context and preferences of each user. In order to make these recommendations more realistic, engaging and effective more flexible and sophisticated strategies are needed. This paper presents an ontology-based approach to model personalizable motivational messages for promoting healthy physical activity. The proposed ontology not only models the message intention and its components, e.g. argument, feedback or followup, but also its content, i.e. action, place, time or object required to perform the recommended activity. Through this ontology the messages can also be categorized into multiple classes, e.g. sedentary, mild or vigorous activities, and retrieved based on the preferences, needs and context of the user. Additional information not explicitly present on the messages can be inferred from the ontology by applying reasoning techniques and used to enhance the message retrieval process.
Mobile Health System for Evaluation of Breast Cancer Patients During Treatmen...Oresti Banos
Breast cancer is the most common tumor in western women and statistically 1 out of 8 women will develop breast cancer over their lifetime. Once overcome it, the stage of rehabilitation that the patient should follow is critical to recover from the suffered disease. In this pa- per, a system composed of three applications, one for smartwatches, one for smartphones and a web application, is presented. Applications for handheld devices are directed to the patient who is undergoing rehabilitation and allow to monitor parameters of interest, such as the heart rate, energy expenditure and arm mobility, that will indicate whether the rehabilitation process being followed is improving the health of the patient or not. The web application is directed to a medical expert with the objective of tracking rehabilitation conducted by the patients.
Analysis of the Innovation Outputs in mHealth for Patient MonitoringOresti Banos
In the last decade, mobile health (mHealth) has developed as a natural consequence of the advances in mobile technologies, the growing spread of mobile devices, and their application in the provision of novel health services. mHealth has demonstrated the potential to make the health care sector more efficient and sustainable and to increase the healthcare quality. Considering the boost to the healthcare area which will be provided by mHealth, many organizations and governments have engaged in innovating in this area. In this context, this work investigated the role of innovation in the area of mHealth for patient monitoring in order to determine the trends and the performance of the innovation activities in this domain. Proxy indicators, like intellectual property statistics and scientific publication statistics, were utilized to measure the outputs of innovation during the period of time from 2006 to 2015 in Europe. Two studies were performed to provide quantitative measures for the indicators measuring innovation outputs in the domain of mHealth for patient monitoring and three main conclusions were observed. First, even if there was a lot of research in Europe in mHealth for patient monitoring, the vast majority of the enterprises did not protect their inventions. Second, a strong research collaboration in the area of mHealth for patient monitoring took place between researchers affiliated to institu- tions of different European countries and even with researchers working in Asian or American institutions. Finally, an increasing trend on the number of published articles about mHealth for patient monitoring was identified. Therefore, the findings of the studies demonstrated the great interest that has arisen the field of mHealth and the huge involvement in innovation activities in the area of mHealth for patient monitoring.
First Approach to Automatic Performance Status Evaluation and Physical Activi...Oresti Banos
The evaluation of cancer patients’ recovery is still under the big subjectivity of physicians. Many different systems have been successfully implemented for physical activity evaluation, nonetheless there is still a big leap into Performance Status evaluation with ECOG and Karnofsky’s Performance Status scores. An automatic system for data recovering based on Android smartphone and wearables has been developed. A gamification implementation has been designed for increasing patients’ motivation in their recovery. Furthermore, novel and without-precedent algorithms for Performance Status (PS) and Physical Activity (PA) assessment have been developed to help oncologists in their diagnoses.
First Approach to Automatic Measurement of Frontal Plane Projection Angle Dur...Oresti Banos
Knee alignment measurements are one of the most extended indicators of knee-complex injuries such as anterior cruciate ligament injury and patellofemoral pain syndrome. The Frontal Plane Projection Angle (FPPA) is widely used as a 2-D estimation of knee alignment. How- ever, traditional procedures to measure this angle suffer from practical limitations, which leads to huge time investments when evaluating mul- tiple subjects. This work presents a novel video analysis system aimed at supporting experts in the dynamic measurement of the FPPA in a cost-effective and easy way. The system employs Kinect V2 depth sensor to track reflective markers attached to the patient leg joints to provide an automatic estimation of the angle formed by the hip, knee and ankle joints. Information registered by the sensor is processed and managed by a computer application that simplifies expert’s work and expedites the analysis of the test results.
High-Level Context Inference for Human Behavior IdenticationOresti Banos
This work presents the Mining Minds Context Ontology, an
ontology for the identification of human behavior. This ontology comprehensively models high-level context based on low-level information, including the user activities, locations, and emotions. The Mining Minds Context Ontology is the means to infer high-level context from the low-level information. High-level contexts can be inferred from unclassified contexts by reasoning on the Mining Minds Context Ontology. The Mining Minds Context Ontology is shown to be flexible enough to operate in real life scenarios in which emotion recognition systems may not always be available. Furthermore, it is demonstrated that the activity and the location might not be enough to detect some of the high-level contexts, and that the emotion enables a more accurate high-level context identification. This work paves the path for the future implementation of the high-level context recognition system in the Mining Minds project.
On the Development of A Real-Time Multi-Sensor Activity Recognition SystemOresti Banos
There exist multiple activity recognition solutions offering
good results under controlled conditions. However, little attention has been given to the development of functional systems operating in realistic settings. In that vein, this work aims at presenting the complete process for the design, implementation and evaluation of a real-time activity recognition system. The proposed recognition system consists of three wearable inertial sensors used to register the user body motion, and a mobile application to collect and process the sensory data for the recognition of the user activity. The system not only shows good recognition capabilities after online evaluation but also after analysis at runtime. In view of the obtained results, this system may serve for the recognition
of some of the most frequent daily physical activities.
Facilitating Trunk Endurance Assessment by means of Mobile Health TechnologiesOresti Banos
Trunk endurance tests are widely used in physical medicine to assess the muscle status of people affected by low back pain. Nevertheless, traditional evaluation procedures suffer from practical limitations, which can lead to potential misdiagnoses. This work presents mDurance, a novel mobile health system aimed at supporting specialists in the functional assessment of trunk endurance by using wearable and mobile devices. The system makes use of a wearable inertial sensor to track the patient trunk posture, while portable electromyography sensors are employed to seamlessly measure the electrical activity produced by the trunk muscles. The information registered by the sensors is processed and managed by a mobile application that facilitates the expert normal routine, while reducing the impact of human errors and expediting the analysis of the test results. The reliability and usability of mDurance is proved through a case study, thus demonstrating its potential interest for regular physical therapy routines.
Mining Human Behavior for Health PromotionOresti Banos
The monitoring of human lifestyles has gained much attention in the recent years. This work presents a novel approach to combine multiple context-awareness technologies for the automatic analysis of people’s conduct in a comprehensive and holistic manner. Activity recognition, emotion recognition, location detection, and social analysis techniques are integrated with ontological mechanisms as part of a framework to identify human behavior. Key architectural components, methods and evidences are described in this paper to illustrate the interest of the proposed approach.
Multiwindow Fusion for Wearable Activity RecognitionOresti Banos
The recognition of human activity has been extensively
investigated in the last decades. Typically, wearable sensors are used to register body motion signals that are analyzed by following a set of signal processing and machine learning steps to recognize the activity
performed by the user. One of the most important steps refers to the signal segmentation, which is mainly performed through windowing approaches. In fact, it has been proved that the choice of window size directly conditions the performance of the recognition system. Thus, instead of limiting to a specific window configuration, this work proposes the use of multiple recognition systems operating on multiple window sizes. The suggested model employs a weighted decision fusion mechanism to fairly leverage the potential yielded by each recognition system
based on the target activity set. This novel technique is benchmarked on a well-known activity recognition dataset. The obtained results show a significant improvement in terms of performance with respect to common systems operating on a single window size.
Mining Minds: an innovative framework for personalized health and wellness su...Oresti Banos
The world is witnessing a spectacular shift in the delivery of health and wellness care. The key ingredient of this transformation consists in the use of revolutionary digital
technologies to empower people in their self-management as well as to enhance traditional care procedures. While substantial domain-specific contributions have been provided to that end in the recent years, there is a clear lack of platforms that may orchestrate, and intelligently leverage, all the data, information and knowledge generated through these technologies. This work presents Mining Minds, an innovative framework that builds on the core ideas of the digital health and wellness paradigms to enable the provision of personalized healthcare and wellness support. Mining Minds embraces some of the currently most prominent digital technologies, ranging from Big Data and Cloud Computing to Wearables and Internet of Things, and state-of-the-art concepts and methods, such as Context-Awareness, Knowledge Bases or Analytics, among others. This paper aims at thoroughly describing the efficient and rational combination and interoperation of these modern technologies and methods through Mining Minds, while meeting the essential requirements posed by a framework for personalized health and wellness support.
A Novel Watermarking Scheme for Image Authentication in Social NetworksOresti Banos
This paper presents a novel watermarking scheme for authentication of digital color images in social networks. The procedure consists of the embedding of a binary watermark image, containing the owner information, into the image to be authenticated. In order to minimize the artifacts in the host image the process is carried out in the wavelets domain. Concretely, the watermark embedding is performed in the HL4 and LH4 sub-band coefficients of the red, green and blue channels of the original image, based on an optimal channel selection quantization technique. To ensure a high robustness to tampering and malicious attacks a key-based pixel shuffling mechanism is further used. The reverse process is likewise identified for the extraction of the watermark from the authenticated image. Both embedding and extraction procedures are benchmarked on diverse color images and under the effects of different types of attacks, including geometric, non-geometric, and JPEG compression transformations. The proposed scheme proves to support imperceptible watermarking, while also showing a high resiliency to common image processing operations.
mHealthDroid: a novel framework for agile development of mobile health appli...Oresti Banos
Mobile health is an emerging field which is attracting much
attention. Nevertheless, tools for the development of mobile health applications are lacking. This work presents mHealthDroid, an open source Android implementation of a mHealth Framework designed to facilitate the rapid and easy development of biomedical apps. The framework is devised to leverage the potential of mobile devices like smartphones or tablets, wearable sensors and portable biomedical devices. The framework provides functionalities for resource and communication abstraction, biomedical
data acquisition, health knowledge extraction, persistent data storage, adaptive visualization, system management and value-added services such as intelligent alerts, recommendations and guidelines.
Sistema automático para la estimación de la presión arterial a partir de pará...Oresti Banos
El documento describe un estudio para desarrollar un método no invasivo para estimar la presión arterial de forma continua. Se analizan señales fisiológicas de pacientes hospitalizados para definir modelos de estados hemodinámicos. El documento también discute bases de datos públicas de registros médicos y el preprocesado de señales para eliminar artefactos, incluyendo un filtrado basado en wavelets.
Temple of Asclepius in Thrace. Excavation resultsKrassimira Luka
The temple and the sanctuary around were dedicated to Asklepios Zmidrenus. This name has been known since 1875 when an inscription dedicated to him was discovered in Rome. The inscription is dated in 227 AD and was left by soldiers originating from the city of Philippopolis (modern Plovdiv).
How Barcodes Can Be Leveraged Within Odoo 17Celine George
In this presentation, we will explore how barcodes can be leveraged within Odoo 17 to streamline our manufacturing processes. We will cover the configuration steps, how to utilize barcodes in different manufacturing scenarios, and the overall benefits of implementing this technology.
This presentation was provided by Rebecca Benner, Ph.D., of the American Society of Anesthesiologists, for the second session of NISO's 2024 Training Series "DEIA in the Scholarly Landscape." Session Two: 'Expanding Pathways to Publishing Careers,' was held June 13, 2024.
THE SACRIFICE HOW PRO-PALESTINE PROTESTS STUDENTS ARE SACRIFICING TO CHANGE T...indexPub
The recent surge in pro-Palestine student activism has prompted significant responses from universities, ranging from negotiations and divestment commitments to increased transparency about investments in companies supporting the war on Gaza. This activism has led to the cessation of student encampments but also highlighted the substantial sacrifices made by students, including academic disruptions and personal risks. The primary drivers of these protests are poor university administration, lack of transparency, and inadequate communication between officials and students. This study examines the profound emotional, psychological, and professional impacts on students engaged in pro-Palestine protests, focusing on Generation Z's (Gen-Z) activism dynamics. This paper explores the significant sacrifices made by these students and even the professors supporting the pro-Palestine movement, with a focus on recent global movements. Through an in-depth analysis of printed and electronic media, the study examines the impacts of these sacrifices on the academic and personal lives of those involved. The paper highlights examples from various universities, demonstrating student activism's long-term and short-term effects, including disciplinary actions, social backlash, and career implications. The researchers also explore the broader implications of student sacrifices. The findings reveal that these sacrifices are driven by a profound commitment to justice and human rights, and are influenced by the increasing availability of information, peer interactions, and personal convictions. The study also discusses the broader implications of this activism, comparing it to historical precedents and assessing its potential to influence policy and public opinion. The emotional and psychological toll on student activists is significant, but their sense of purpose and community support mitigates some of these challenges. However, the researchers call for acknowledging the broader Impact of these sacrifices on the future global movement of FreePalestine.
Beyond Degrees - Empowering the Workforce in the Context of Skills-First.pptxEduSkills OECD
Iván Bornacelly, Policy Analyst at the OECD Centre for Skills, OECD, presents at the webinar 'Tackling job market gaps with a skills-first approach' on 12 June 2024
3. Learning Objectives
At the end of this course you should be able to:
Explain the concept of biodata and
enumerate some examples of types
of biodata
Identify the different stages of the
biodata analysis chain, as well as
the purpose of each step
Apply some regular biodata
segmentation techniques
Utilise common biodata feature
extraction and selection techniques
Employ typical biodata classification
techniques and use metrics to
evaluate their performance
19-Apr-18 3
6. Biodata: definition
Data: is a collection or set of qualitative or
quantitative variables normally represented
through numbers, characters or symbols
Biodata (also biomedical data, biological data):
collection of data specifically related to or
describing biological systems or processes
Different “levels” of data
Signal
Features
Categories
19-Apr-18 6
There are
more specific
definitions!
8. Motion data
19-Apr-18 8
Body motion data:
Different sensing technologies to track body movements
Video: Kinect, Vicon
EMG: MYO
Inertial: Xsens, Shimmer, Smartphone/watch
Acceleration:
tridimensional signal (x, y, z)
measures typically range from -2g to 2g (g=9.8m/s2) for
daily activities
sampling frequency around 50Hz
Multiple applications: Health
Abnormal
behavior
detection
Proactive
Assistance
Labour risk
prevention
Wellness
Sports
Gaming
15. Biodata interpretation: not an easy job…
Medical experts cannot “digest” the enormous
amount of biodata generated by people
Examples
Breathing ~100K events/day
Heart beats ~ 1M samples/day
Motion ~100M samples/day
EEG ~100M samples/day
19-Apr-18 15
How to make sense of
these gobs of data?
16. Biodata analysis chain
Multistage process combining computational
techniques to automatically extract information
and develop decisions on a given data set
19-Apr-18 16
S = data source (sensor)
si = segment of data
u = raw/unprocessed data
f(si) = feature vector
p = preprocessed data
ci = class/label
17. Data acquisition and preprocessing
19-Apr-18 17
Data acquisition refers here to the process of
measurement and digitisation of the biological
phenomenon (Lectures 1, 2, 3)
Measurement and transduction
Sampling
Amplification
Analog to digital conversion
Data preprocessing refers here to the preparation
of the biodata for its posterior processing and
analysis (Lectures 4 and 5)
Removal of artifacts
Denoising
Domain transformation
Downsampling (decimation) / upsampling (interpolation)
19. Segmentation
19-Apr-18 19
Process to divide the biosignal or data into
smaller time segments
The segmentation process is frequently called
“windowing” as each segment represents a data
window or frame
In real-time applications, windows are defined
concurrently with data acquisition and processing,
so data streams can be effectively analysed “on-
the-fly”
20. Segmentation
19-Apr-18 20
Sliding window
Signals are split
into windows of a
fixed size and with
no inter-window
gaps
An overlap
between adjacent
windows is
sometimes
tolerated
Most widely used
approach
Window 1 Window 3 Window 5 Window 7
Window 1 Window 2 Window 3 Window 4
Fixed
window size
Window 2 Window 4 Window 6
Non-overlapingOverlaping
21. Segmentation
19-Apr-18 21
Event-defined window
The segment start and
end is defined by a
detected event
Additional processing is
required to identify the
events of interest
Example: toe offs and
heel strikes based on
the differentiation of the
acceleration signal
(derivative)
Data windows (normally)
of variable size
22. Segmentation
19-Apr-18 22
Class-defined window
The window start and
end is defined by a
change in the context
or class (also spotting)
Example: activity
transition detected from
significant variations in
the energy or statistical
properties of the
acceleration signal
(e.g., variance)
Data windows (normally)
of variable size
26. Feature extraction
19-Apr-18 26
Process of (numerically) characterising or
transforming raw data into more descriptive or
informative data
Intended to facilitate the subsequent learning and
generalization steps, and in some cases lead to
better human interpretations
Location=prefrontal,
Size=3cm,
Density=60g/cm3, …
27. Feature extraction
19-Apr-18 27
Time-domain features: statistical values derived
directly from data window
Examples:
Max
Min
Mean
Median
Variance
Skewness
Kurtosis
MATLAB: max, min, mean, median, var, skewness, kurtosis
0 0.5 1 1.5 2 2.5 3 3.5 4
Time (s)
-25
-20
-15
-10
-5
0
5
10
15
Acceleration(m/s2)
X-axis acceleration signal (JUMPING)
0 0.5 1 1.5 2 2.5 3 3.5 4
Time (s)
-9
-8
-7
-6
-5
-4
-3
-2
-1
0
Acceleration(m/s2)
X-axis acceleration signal (WALKING)
0 0.5 1 1.5 2 2.5 3 3.5 4
Time (s)
-3.4
-3.3
-3.2
-3.1
-3
-2.9
-2.8
-2.7
-2.6
Acceleration(m/s2)
X-axis acceleration signal (STANDING)
28. Feature extraction
19-Apr-18 28
Frequency-domain features: derived from a
transformed version of the data window in the
frequency domain
Examples:
Fundamental frequency
N-order harmonics
Mean/Median/Mode frequency
Spectral power/energy
Entropy
Cepstrum coefficients
MATLAB: fft, pwelch, meanfreq, medfreq, rceps
0 5 10 15 20 25
Frequency (Hz)
0
200
400
600
800
1000
1200
1400
FFTMagnitude
X-axis acceleration signal (JUMPING)
0 5 10 15 20 25
Frequency (Hz)
0
20
40
60
80
100
120
140
160
FFTMagnitude
X-axis acceleration signal (STANDING)
0 5 10 15 20 25
Frequency (Hz)
0
20
40
60
80
100
120
140
160
180
200
FFTMagnitude
X-axis acceleration signal (WALKING)
29. Feature extraction
19-Apr-18 29
Process of (numerically) characterising or
transforming raw data into more informative data
The outcome of the feature extraction process is
normally a feature matrix
Rows represent each data instance, chunk or segment
Columns refer to the mathematical function (feature)
𝟎. 𝟏𝟖 𝟎. 𝟑𝟓
−𝟎. 𝟐𝟔 𝟎. 𝟏𝟓
−𝟎. 𝟎𝟓
−𝟎. 𝟏𝟗
𝟎. 𝟐𝟏
𝟎. 𝟏𝟖
Feature
matrix
F1: Mean F2: Variance
30. Feature extraction
19-Apr-18 30
Feature space:
Total number of features
extracted from the data
Normally described as an array
(also known as feature matrix) in
which rows represent each
instance and columns the
feature type
The dimensions (D) of the
feature space are given by the
number of features (N)
MATLAB: scatter
0 1 2 3
Mean
0
0.5
1
1.5
2
2.5
3
Variance
Class A
Class B
0.18 0.55
0.26 0.15
0.15
2.13
2.86
2.58
0.85
2.62
2.35
2.51
Feature
matrix
Mean Variance
0 0.5 1 1.5 2 2.5 3
Mean
0
0.5
1
1.5
2
2.5
3
Variance
Sitting
Climbing
Feature
space
32. Features of “relevance”
19-Apr-18 32
Relevant features can be
individually irrelevant
A helpful feature may be
irrelevant by itself
E.g.: the characteristic “being a
human” when comparing two
people vs. when comparing
animals
Two individually irrelevant
features may become relevant
when used in combination
E.g.: “row” and “column” in a
chess game when comparing the
color of a given position vs. using
either row or column solely
33. Feature selection
19-Apr-18 33
Process to select relevant and
informative features
Different motivations
General data reduction: limit storage
requirements and increase algorithm
speed
Feature set reduction: save resources in
the next round of data collection or
during its utilisation
Performance improvement: gain in
predictive accuracy
Data understanding: acquire knowledge
about the process that generated the
data or simply visualise the data
34. Feature selection
19-Apr-18 34
Visualising the feature space can help determining which
features (or combination thereof) are most discriminative
Hyperdimensional features spaces (#features > 3) need
to be reduced for a proper visualisation (e.g., PCA, ICA)
MATLAB: scatter3, pca, biplot, ica
-1
-0.5
0
0
0.5
-2
1
-2
1.5
Mean(accelerationZ)
2
-4 -3
Feature space representation
Mean (accelerationY)
2.5
-4
3
Mean (accelerationX)
-6
3.5
-5
-8
-6
-10 -7
Standing
Walking
Jumping
Do not trust statistics alone,
visualise your data!
35. Feature selection
19-Apr-18 35
There are several feature ranking and selection methods
MATLAB: rankfeatures
Filter methods:
select variables regardless of the
classification model model (analyses
intrinsic properties of data)
particularly effective in computation time
robust to overfitting (excessive model
complexity, i.e., too many parameters
relative to the number of samples)
Ranking feature selection:
selects a subset of features according to
a statistical separability criteria (e.g., t-
test, ANOVA)
Set of all
features
Selecting
the best
subset
Learning
algorithm
Performance
evaluation
0.4 1 3.3 1
2.3 1 3.2 3
0.4
2.2
2.6
2.2
1
1
1
1
3.1
9.8
9.4
9.7
2
3
1
2
Class “Sitting”
Class “Climbing”
F1 F2 F3 F4
a) F1>F3>F4>F2?
b) F1>F3>F2>F4?
c) F3>F1>F4>F2?
d) F4>F2>F3>F1?
Go to go.voxvote.com
Insert the code PIN: 99020
36. Feature selection
19-Apr-18 36
There are several feature ranking and selection methods
MATLAB: sequentialfs
Wrapper methods:
allow to detect the possible
interactions between features
significant computation time for large
sets of features and prone to
overfitting
Sequential feature selection:
selects a subset of features from the
feature matrix that predict best the
output classes by iteratively selecting
features until there is no improvement in
prediction
Set of all
features
Selecting the best subset
Learning
algorithm
Performance
evaluation
Generate
a subset
0.4 1 3.3 1
2.3 1 3.2 3
0.4
2.2
2.6
2.2
1
1
1
1
3.1
9.8
9.4
9.7
2
3
1
2
Class “Sitting”
Class “Climbing”
F1 F2 F3 F4
a) F1>F2>F3>F4?
b) F2>F3>F1>F4?
c) F3>F1>F4>F2?
d) F4>F2>F3>F1?
Go to go.voxvote.com
Insert the code PIN: 99020
38. Classification
19-Apr-18 38
Problem of identifying to
which of a set of
categories or classes a
new observation belongs
The classification model is
based on a training set of
data containing
observations (or
instances) whose
category membership is
(normally) known
0 1 2 3
Mean
0
0.5
1
1.5
2
2.5
3
Variance Class A
Class B
0.18 0.55
0.26 0.15
0.15
2.13
2.86
2.58
0.85
2.62
2.35
2.51
Feature
matrix
Mean Variance
Classification
boundary
0 0.5 1 1.5 2 2.5 3
Mean
0
0.5
1
1.5
2
2.5
3
Variance
Sitting
Climbing
39. Classification
19-Apr-18 39
Types:
Supervised
E.g., decision tree
Unsupervised
E.g., clustering
One size does not fit
all: the choice of
classifier is subject to
a trade-off between
complexity and
computational
resources
0 1 2 3
Mean
0
0.5
1
1.5
2
2.5
3
Variance
Class A
Class B
0.18 0.55
0.26 0.15
0.15
2.13
2.86
2.58
0.85
2.62
2.35
2.51
0 1 2 3
Mean
0
0.5
1
1.5
2
2.5
3
Variance
Class A
Class B
0.18 0.55
0.26 0.15
0.15
2.13
2.86
2.58
0.85
2.62
2.35
2.51
𝑨
𝑨
𝑨
𝑩
𝑩
𝑩
?
?
?
?
?
?
Supervised
Unsupervised
0 0.5 1 1.5 2 2.5 3
Mean
0
0.5
1
1.5
2
2.5
3
Variance
Sitting
Climbing
40. Classification
19-Apr-18 40
Classification process:
Training/learning
Before operation the classification
model has to be trained (created)
The model parameters are learned
from the training data and as to
minimise the classification error
Example:
In a decision tree, nodes
(conditions) and branches (decision
propagation) need to be defined
The conditions are optimised as to
maximise the distance between
classes
0.18 0.55
0.26 0.15
0.15
2.13
2.86
2.58
0.85
2.62
2.35
2.51
𝑆𝑖𝑡𝑡𝑖𝑛𝑔
𝑆𝑖𝑡𝑡𝑖𝑛𝑔
𝑆𝑖𝑡𝑡𝑖𝑛𝑔
𝐶𝑙𝑖𝑚𝑏𝑖𝑛𝑔
𝐶𝑙𝑖𝑚𝑏𝑖𝑛𝑔
𝐶𝑙𝑖𝑚𝑏𝑖𝑛𝑔
+
Mean Variance
Mean < 1.2
Sitting Climbing
Class
MATLAB: fitctree
41. Classification
19-Apr-18 41
Classification process:
Classification/prediction
Once the model is trained, it can
be used to categorise unseen
new instances into specific
classes
The outputs of the classification
correspond to the inferred class
or categories
Example:
In a decision tree, the conditions
(nodes) are evaluated and the
applicable path followed up to
reach a conclusion (class)
0.52 −0.25
1.38 9.15
2.31
0.19
5.67
0.12
𝑆𝑖𝑡𝑡𝑖𝑛𝑔
𝐶𝑙𝑖𝑚𝑏𝑖𝑛𝑔
𝐶𝑙𝑖𝑚𝑏𝑖𝑛𝑔
𝑆𝑖𝑡𝑡𝑖𝑛𝑔
Mean < 1.2
Sitting Climbing
MATLAB: predict
43. Performance evaluation
19-Apr-18 43
Evaluating the performance of the classifier
(generally, the complete analysis chain) is
crucial to estimate the categorisation
capabilities of the system
The performance evaluation
is normally conducted
during the design phase
Classification performance
depends greatly on the
characteristics of the data to
be classified
There is no single classifier
that works best on all given
problems
44. Performance evaluation
19-Apr-18 44
Performance metrics
Decision table (confusion matrix)
Table layout that allows visualization
of the performance of a given
algorithm or classification model
Each column of the matrix represents
the instances in a predicted class
while each row represents the
instances in an actual class
MATLAB: confusionmat, plotconfusion
𝑆𝑖𝑡𝑡𝑖𝑛𝑔
𝐶𝑙𝑖𝑚𝑏𝑖𝑛𝑔
𝑆𝑖𝑡𝑡𝑖𝑛𝑔
𝑆𝑖𝑡𝑡𝑖𝑛𝑔
Actual
class
Classified
class
Sitting Climbing
Sitting 2 1
Climbing 0 1
Classified class
Actualclass
45. Performance evaluation
19-Apr-18 45
Performance metrics
Accuracy (acc)
Proportion of correct classifications
with respect to the total number of
classified instances or observations
MATLAB: classperf
𝑆𝑖𝑡𝑡𝑖𝑛𝑔
𝐶𝑙𝑖𝑚𝑏𝑖𝑛𝑔
𝑆𝑖𝑡𝑡𝑖𝑛𝑔
𝑆𝑖𝑡𝑡𝑖𝑛𝑔
Actual
class
Classified
class
𝒂𝒄𝒄 =
𝟏 + 𝟏 + 𝟎 + 𝟏
𝟒
= 𝟎. 𝟕𝟓 75%
Sitting Climbing
Sitting 2 1
Climbing 0 1
Classified class
Actualclass
46. Performance evaluation
19-Apr-18 46
Experimental data is normally scarce and gives
insight on a sole scenario/situation
Cross-validation: technique for assessing how
the results of a statistical classifier will generalize
to an independent data set (observations)
MATLAB: crossvalind, cvpartition, crossval
Leave-one-out cross-validation (LOOCV)
One observation is left out for validation
and remaining ones are used for training
𝟎. 𝟓𝟐 𝟎. 𝟐𝟓
𝟏. 𝟑𝟖 𝟗. 𝟏𝟓
𝟐. 𝟑𝟏
𝟎. 𝟏𝟗
𝟓. 𝟔𝟕
𝟎. 𝟏𝟐
Round 1
0.52 0.25
1.38 9.15
2.31
0.19
5.67
0.12
Round 2
0.52 0.25
1.38 9.15
2.31
0.19
5.67
0.12
Round 3
0.52 0.25
1.38 9.15
2.31
0.19
5.67
0.12
Round 4
0.52 0.25
1.38 9.15
2.31
0.19
5.67
0.12
Experimental
data
Validation set
Training set
acc1
Validation
accuracy
acc2 acc3 acc4
Final accuracy = average(acc_i) ∀ i
47. Performance evaluation
19-Apr-18 47
Experimental data is normally scarce and gives
insight on a sole scenario/situation
Cross-validation: technique for assessing how
the results of a statistical classifier will generalize
to an independent data set (observations)
MATLAB: crossvalind, cvpartition, crossval
K-fold cross-validation (K-fold CV)
Experimental data set is split into K folds
K-1 folds are used for training
The remaining fold is used for testing
The process is repeated K times for each split
𝟎. 𝟓𝟐 𝟎. 𝟐𝟓
𝟏. 𝟑𝟖 𝟗. 𝟏𝟓
𝟐. 𝟑𝟏
𝟎. 𝟏𝟗
𝟓. 𝟔𝟕
𝟎. 𝟏𝟐
Experimental
data
Validation set
Training set
Round 2
0.52 0.25
1.38 9.15
2.31
0.19
5.67
0.12
Round 1
0.52 0.25
1.38 9.15
2.31
0.19
5.67
0.12
2-fold CV
75% 100%Validation
accuracy
Final accuracy = (75%+100%)/2 = 87.5%
48. References
Biomedical Signal Processing and Analysis:
Principal references:
Mitchell, T. M., Machine Learning. McGraw-Hill, 1997 (Chapter 3)
Rangayyan, R. M. Biomedical Signal Analysis: A Case-Study Approach. New
York: IEEE Press, 2002 (Chapters 8-9)
Preece, Stephen J., Goulermas, John Y., Kenney, Laurence P. J., Howard, Dave,
Meijer, K., Crompton, R., et al. (2009). Activity identification using body-mounted
sensors – a review of classification techniques. Physiological Measurement,
30(4), R1–R33
Other references:
Bishop, C. M., Pattern Recognition and Machine Learning. Springer, 2006
Bulling, A.; Blanke, U.; Schiele, B. A Tutorial on Human Activity Recognition Using
Body-worn Inertial Sensors. ACM Comput. Surv. 2014, 46, 1–33.
19-Apr-18 48
NOTES:
Signal acquisition: Erik already introduced a little bit of it, and it will be explored in more detailed during the 5th and 6th lecture
Signal processing: this is what we will see today
Signal analysis (or data analysis): we will see this part next week
Signal conditioning refers to acquisition, amplification, levelling
Electrical biosignal conditioning will be explored in depth in Lecture 5 (Amplifiers in Electrophysiological Measurements) and Lecture 6 (Noise in Electrophysiological Measurements)
ADDITIONAL TEXT:
The signals reflect properties of their associated underlying biological systems, and their decoding has been found very helpful in explaining and identifying various pathological conditions. The decoding process is sometimes straightforward and may only involve very limited, manual effort such as visual inspection of the sig- nal on a paper print-out or computer screen. However, the complexity of a signal is often quite considerable, and, therefore, biomedical signal pro- cessing has become an indispensable tool for extracting clinically significant information hidden in the signal.
NOTES:
ADDITIONAL TEXT:
NOTES:
ADDITIONAL TEXT:
NOTES:
ADDITIONAL TEXT:
NOTES:
Biodata has been traditionally used for describing biographical data, for example, a résumé
Are signals different than data? No, signals are just a subcategory of what could be considered data.
Example: ECG
Data: ECG electrical signal
Information: Heart rate (number of contractions per minute)
Knowledge: Heart rate > 180 bpm determines an abnormal situation
Knowledge: Heart rate > 100 bpm while resting determines an abnormal situation
Wisdom: if Heart rate > 100 bpm while resting call an ambulance
The boundaries between data, information, knowledge, wisdom are not always clear: What is data to one person is information to someone else. http://searchdatamanagement.techtarget.com/feature/Defining-data-information-and-knowledge
ADDITIONAL TEXT:
http://www.ncbi.nlm.nih.gov/pmc/articles/PMC2814957/
NOTES:
Genomic data: information embedded into your genes, one of the fundations of the personalised medicine (i.e., you know that drugs are made to work for the population in general but they show different effects for each person; the idea is to create person-centric medicines so the drug works best and with minimum adverse effects)
Emotional data: identification of emotional and mental states, for example, anger, fear, depression, stress
Cognitive data: attention, memory and working memory, judgment
ADDITIONAL TEXT:
NOTES:
Vicon: reflective markers (tiny spots)
EMG: more on a local/muscular level (intended for determining gestures)
Many others: inclinometer, goniometers, skin temperature, galvanic skin response, GPS, etc.
Health and wellness care but also in many other areas:
Industry, Films,…
ADDITIONAL TEXT:
NOTES:
ADDITIONAL TEXT:
NOTES:
ADDITIONAL TEXT:
NOTES:
ADDITIONAL TEXT:
NOTES:
Photographic evidence could provide your doctor with vital information they might otherwise miss.
Stacey Yepes (2014), a Canadian woman who used her mobile phone to capture an episode of symptoms that included slurred speech and facial paralysis, which ultimately lead to a diagnosis of a stroke. In this case, the medical selfie led to an accurate diagnosis that could well have saved a life
ADDITIONAL TEXT:
NOTES:
ADDITIONAL TEXT:
NOTES:
ADDITIONAL TEXT:
NOTES:
And you have to multiply this by the number of channels (e.g., in motion data – 3 for an accelerometer –; in EEG – 10 to 20, depending upon the number of scalp electrodes –)
Imagine you use 10 channels and 8bits to encode this information, how many bytes would this result in?
EEG 10x100MB --> 1GB per day! (This seems not that much, but imagine inspecting/reviewing such amount of data manually)
ADDITIONAL TEXT:
NOTES:
Computational techniques
ADDITIONAL TEXT:
NOTES:
ADDITIONAL TEXT:
NOTES:
ADDITIONAL TEXT:
NOTES:
- Segmenting or partitioning things is something that you do more or less every day right, e.g., when you prepare a sandwich, but also when you divide your tasks or homework in blocks
ADDITIONAL TEXT:
NOTES:
The signals are split into windows of a fixed size and with no inter-window gaps. An overlap between adjacent windows is tolerated for certain applications; however, this is less frequently used
ADDITIONAL TEXT:
NOTES:
The signals are split into windows of a variable size
The event detection could be based on time-domain changes but also on frequency-domain changes (remember the event detection section that you saw last week)
ADDITIONAL TEXT:
NOTES:
The signals are split into windows of a variable size
For the class-defined window think of an audio: each word or character could refer to a given context/category (sometimes in order to automatically identify the start and end what we focus on is the energy of that part, or some statistical properties that hold during the period the context takes place)
ADDITIONAL TEXT:
NOTES:
ADDITIONAL TEXT:
NOTES:
Question:
How do you think you can differentiate these two guys (apart from the obvious)? Otherwise, what do you think happens in your brain when you see these two picture? Some features are measurable: skin color, eyes, haircut, age, some others are more subjective: craziness for example
ADDITIONAL TEXT:
NOTES:
- is one of the key steps in the data analysis process, largely conditioning the success of any subsequent statistics or machine learning endeavor
We have already seen some means for extracting features, e.g., RR distance is a feature, the HR is also a feature
Density, size, location of a tumor (CT scan)
Genetic/proteomic features (boolean, either it is activated or not)
ADDITIONAL TEXT:
NOTES:
- MOD4 you took a full course on statistics, right?
Skewness: measure of the asymmetry of the probability distribution of a real-valuedrandom variable about its mean
Kurtosis: is a measure of the "tailedness" of the probability distribution of a real-valued random variable
- Mean can be used to determine the orientation of an accelerometer during a resting state (based on the basic acceleration)
ADDITIONAL TEXT:
NOTES:
Fundamental frequency: often referred to as simply as the fundamental, is defined as the lowest frequency of a periodic waveform
Mean/Median/Mode frequency: statistics computed over the power spectrum of a time-domain signal
Spectral power/energy: distribution of the signal energy
Entropy: measurement of the amount of information in a given signal
Cepstrum: the Inverse Fourier transform (IFT) of the logarithm of the estimated spectrum of a signal – rate of change in the different spectrum bands (used for voice identification, pitch detection)
Some of these features are typically use in voice or speech recognition;
ADDITIONAL TEXT:
NOTES:
- is one of the key steps in the data analysis process, largely conditioning the success of any subsequent statistics or machine learn- ing endeavor
We have already seen some means for extracting features, e.g., RR distance is a feature, the HR is also a feature
Density, size, location of a tumor (CT scan)
Genetic/proteomic features (boolean, either it is activated or not)
ADDITIONAL TEXT:
NOTES:
Problem of dimensionality: leads to the need of feature selection, not only for visualisation of the features but also for the posterior machine learning
Well in some cases turns to be difficult to find a proper feature
ADDITIONAL TEXT:
NOTES:
ADDITIONAL TEXT:
NOTES:
Well in some cases turns to be difficult to find a proper feature
ADDITIONAL TEXT:
NOTES:
- the good, if brief, is twice as good
ADDITIONAL TEXT:
NOTES:
Question:
the good, if brief, is twice as good
Which feature do you think would be preferably selected here? c
ADDITIONAL TEXT:
NOTES:
the good, if brief, is twice as good
Which feature do you think would be preferably selected here? c
ADDITIONAL TEXT:
NOTES:
the good, if brief, is twice as good
Which feature do you think would be preferably selected here? c
ADDITIONAL TEXT:
NOTES:
ADDITIONAL TEXT:
NOTES:
ADDITIONAL TEXT:
- BSPCNA Ch1.4
NOTES:
- There is a third category called semi-supervised in which part of the data is labelled (e.g., reinforcement learning)
ADDITIONAL TEXT:
- BSPCNA Ch1.4
NOTES:
Each path translates into a given rule
Question:
What would be the visual representation for this decision tree? See figure
ADDITIONAL TEXT:
- BSPCNA Ch1.4
NOTES:
- There is a third category called semi-supervised in which part of the data is labelled (e.g., reinforcement learning)
ADDITIONAL TEXT:
- BSPCNA Ch1.4
NOTES:
ADDITIONAL TEXT:
NOTES:
ADDITIONAL TEXT:
NOTES:
A.k.a, Contingency table, Error matrix
- Include a description of the Precision and Recall
ADDITIONAL TEXT:
NOTES:
A.k.a, Contingency table, Error matrix
- Include a description of the Precision and Recall
ADDITIONAL TEXT: