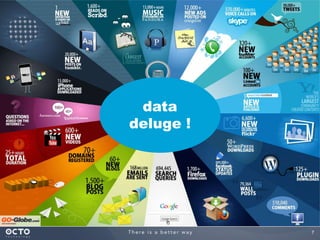
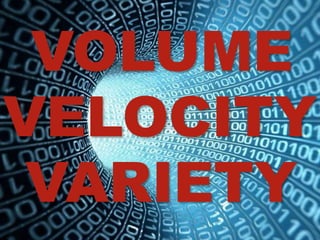
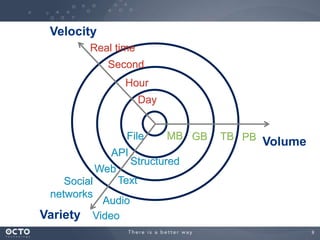
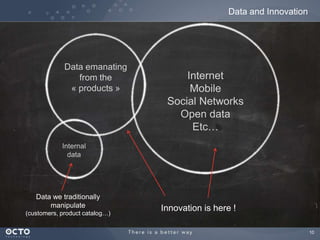
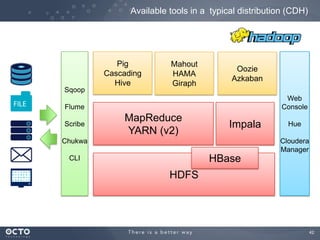
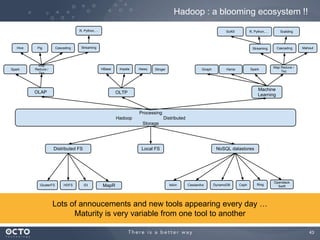
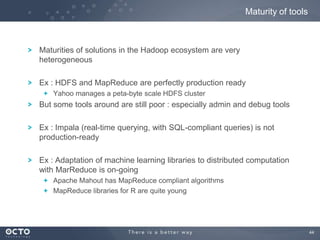
1© OCTO 2013
Big Data and Machine Learning
Mathieu DESPRIEE
mde@octo.com
twitter : @mdeocto
2
3
What a buzzword !!!
Google trends on “big data”
Gartner hype cycle
2012
4
WEB
Google, Amazon,
Facebook, Twitter,
…
IT Vendors
IBM, Teradata,
Vmware, EMC,
…
Management
McKinsey, BCG,
Gartner, …
Web giants gave some reality to a concept anticipated by Gartner.
This software evolution didn’t come from traditional software vendors
(which is quite unusual)
Origins of Big Data
Web giants implement BigData
solutions for their owns needs
Vendors are followers in
this movement. They try to
take a hold on this very
promising business
Consulting firms predicted a
big economic change, and
Big Data is part of it
5
Origins of Big Data
6
There’s no clear definition of Big Data
It is altogether a business ambition and many technological opportunities
Is there a clear definition ?
Super
datawarehouse?
Low cost storage
?
NoSQL?
Cloud?
Internet
Intelligence?
Real-time
analysis ?
Unstructured
data?
Open Data?
Big
databases?
7
data
deluge !
8
VOLUME
VELOCITY
VARIETY
9
Volume
Variety
Velocity
Day
Hour
Second
Real time
MB TBGB PBFile
Structured
Social
networks
API
Text
Video
Web
Audio
10
Data we traditionally
manipulate
(customers, product catalog…)
Innovation is here !
Data and Innovation
11
NEW
USAGES
NEW
SERVICES
NEW
IT SYSTEMS
12
Big Data aims at getting an
economical advantage
from the quantitative analysis of
internal and external data
Big Data : proposed definition
13
Some real use-cases
studied with OCTO
Telecom
• Analyze behavior of
customers (calls to service
center, opinion about the
brand on social networks
…) to identify a risk of
churn
• Analyze the huge amount
of data quality metrics from
network infrastructure in
real-time to proactively
inform the call-center about
network quality of service
Insurance
• Crawl the web (especially
forums) to identify
correlation between
damages, and center of
interests in communities
(health, household
insurance, car
insurance…)
• Improve datamining
models, and risk models
e-Commerce
• Analyze weblogs and
customer reviews to
improve product
recommendation
• Analyze data from call-
center (calls, emails) to
improve customer loyalty
14
15
Machine
Learning
16
« Machine Learning » is not new. A first definition of it was given in 1959 :
Field of study that gives computers the ability to
learn without being explicitly programmed
Arthur Samuel
1959
A computer program is said to learn from
experience E with respect to some class of
tasks T and performance measure P, if its
performance at tasks in T, as measured by P,
improves with experience ETom Mitchell
1998
Machine Learning : a definition
We prefer this definition, more recent, and more precise :
17
A computer program
is said to learn from
experience E with
respect to some
class of tasks T and
performance
measure P, if its
performance at
tasks in T, as
measured by P,
improves with
experience E
Example with a SPAM classifier
I tag some of my emails
into ‘spam’ or not
Ratio of emails correctly classified
automatically
The classifier put incoming emails
in ‘spam’ or not
SPAM Classifier
18
A Machine Learning approach works only if 3 conditions are fulfilled
What’s new with Big Data in Machine Learning ?
Some « pattern » exist in data
You have a lot of data. A LOT.
(millions of samples)
There’s no analytical model to describe it
(= it’s a probabilistic problem)
A Big Data approach allows us to collect and manipulate much more data.
Machine Learning is a fundamental tool to leverage this huge amount of information
1
2
3
Machine Learning algorithms exist
since many years to address these
In the past, performance of ML models
was often limited by the lack of
available data.
Now we can collect and manipulate
much more
19
Let’s imagine we want to predict if a customer of a telecom operator will churn
(go to a concurrent)
We will build a classifier, and start by building a learning set
For each customer, we collect a finite number of data, named attributes
Customer offer / plan
Customer data (region, age, sex, …)
Last 12 bills amount
Number of calls to call-center last 6 months
Amount of local calls of last 12 months
Amount of international calls of last 12 months
Amount of downloaded data
etc.
And for each customer in the training set, we know if the customer churned or
not. It’s the tag.
Machine Learning example : classification
20
Logistic regression classifier
45.72
34.21
23.55
46.12
12.45
45.90
41.79
39.80
17.59
9.45
…
84.23
21.43
50.64
32.76
5.42
32.11
21.43
50.64
32.76
4.13
81.23
19.71
13.83
5.44
…
4.21
19.24
32.34
56.16
1
0
0
2
0
0
0
5
0
0
…
0
2
0
0
380
412
310
365
367
450
515
290
340
420
…
410
504
554
650
404
491
148
323
385
581
649
434
219
439
…
283
425
535
701
0
1
0
1
0
0
0
1
0
0
…
0
0
0
1
Bill 1 Bill 2 Bill k Calls to
call-center
Avg
Data
Xn
X θ1
θ2
θ3
θ4
θ5
θ6
θ7
θ8
θ9
θ10
…
θm-1
θm
θ Y
…
…
Sex
M
M
M
F
M
F
F
F
M
M
…
F
F
F
M
…
…
learning
samples :
customers
learning
samples :
TAG
“churn” or not
n attributes per
customer
parameters of
the model
to compute
=
learning output
fn()
sigmoïd function
to have a binary
output
21
The θ vector is computed during the training phase
When the θ vector is computed, our classification model is ready
Then we test this model against other values for X (the test set), and we check if
our model is good at predicting the output value y. We talk about robustness of
the model = its capacity to generalize the prediction.
The challenge is to get a reasonable error ratio, and not to “overfit” the algorithm to the
training sample (it will predict nothing)
In general, 80% of your whole data set are used for training, and 20% for testing
Machine Learning example : classification
* C’est souvent 60%/20%/20% pour effectuer une
étape de validation du modèle
22
Supervised learning
Data is tagged : we know if the customer is a churner or not for the training phase
Positives (churners) are abundant enough in sample to identify the typical churner
For some use-cases, the tagging may require the help of an expert to prepare the
training set. Expertise is needed before machine learning.
The challenge is about the generalization of the model
Unsupervised learning
We don’t know output values (the Y vector). We don’t know the number of tags, nor
their nature
Some of the attributes are not homogeneous amongst all the samples in X
The algorithm will group inputs xi by similarities (creating clusters)
The expertise is needed after machine learning, to interpret the results, and name the
discovered categories
The challenge is about understanding the output classification
Different strategies in categorisation
??
23
Draw a line (hyperplane) that divide points in space, into 2 classes
Find a line with the best margin (good distance from points to the line)
Try to minimize the error (points on the bad side)
Example of supervised algorithm : Support Vector Machine
If distribution is fundamentaly non-
linearly separable, algorithms exist to
transform the data to higher
dimension, and make it linearly
separable.
24
Example of unsupervised algorithm : K-Means clustering
Choose k points randomly in space
(the seeds)
Until convergence
Assign each input point to nearest seed to
form clusters
Compute the center of gravity of clusters,
and use these points as new seeds
25
Dimensionality reduction
Example : product recommendation engine
N customers x P products
(ci, pj) = 1 if customer i bought product j
Very big and sparse matrix
Each customer is a point in a space having a
big number of dimensions
Idea : find a way to group products and
reduce dimensions of this space
Others algorithms
0
0
0
0
1
0
0
…
0
0
1
0
0
1 M products
10Mcustomers
P1 P2 Pn
…
…
0
1
0
0
0
0
0
…
0
0
0
0
0
0
0
0
0
0
0
1
…
0
0
0
0
0
Quantity prediction
Linear regression : The oldest and most known algorithm
26
Many algorithms to use, depending on the situation !
27
© OCTO 2013© OCTO 2012© OCTO 2013
TECHNOLOGY
28
1956 : 50 k$ for a 5 MB IBM hard-drive… today : 20 € for a 8 GB microSD !
29
Exponential growth of capacities
CPU, memory, network bandwith, storage … all of them followed the Moore’s law
Source :
http://strata.oreilly.com/2011/08/building-data-startups.html
30
The old strategy : Scale-up
0.01
0.10
1.00
10.00
100.00
1,000.00
10,000.00
100,000.00
1,000,000.00
1965 1970 1975 1980 1985 1990 1995 2000 2005 2010 2015
100k $/GB
0,10 $/GB
HDD
RAM
The old way :
If you have too much data, just wait a few months that the cost decrease,
and then scale-up your infrastructure
Source :
http://www.mkomo.com/cost-per-gigabyte
31
© OCTO 2013
BUT…
32
0
10
20
30
40
50
60
70
MB/s
1990 2010
64 MB/s
0,7 MB/s
Seagate
Barracuda
7200.10
Seagate
Barracuda
ATA IV
IBM DTTA
35010
x 100’000 x 91
Storage capacity Throughtput
We can store 100’000 times more data, but it takes 1000 times longer to read it !
33
Limitations of traditional architectures
Over 10 Tb, « classical »
architectures requires huge
software and hardware
adaptations.
Over 1 000 transactions /
second, « classical »
architectures requires huge
software and hardware
adaptations.
Over 10 threads/Core CPU,
sequential programming reach
its limits (IO).
Over 1 000 events / second,
« classical » architectures
requires huge software and
hardware adaptations.
Distributed
storage
Share
nothing
XTP
Parallel
processing
Event Stream
Processing
« Traditional »
architectures
RDBMS,
Application server,
ETL, ESB
Event flow oriented
application
(streaming)
Transaction oriented
applications
(TPS)
Storage oriented
applications
(IO bound)
Computation
oriented applications
(CPU bound)
34
Big Data = explosion of volumes :
data to store online
processing to parallelize
number of transactions per second to handle
number of messages per second to process
+
New constraints
New types of data (unstructured, semi-structured…)
Distribution of storage and processing
Cost reduction
Need of elasticity
=
New technologies
Horizontal scalability and clustering
Data partitioning / sharding
Parallel processing
In-memory processing
New Architectures
35
Some emerging solutions
Event flow oriented
application
(streaming)
Transaction oriented
applications
(TPS)
Storage oriented
applications
(IO bound)
Computation
oriented applications
(CPU bound)
Cassandra, Mong
oDB, CouchDB
HDFS
SQLFire
Teradata
Hana
Grid Computing
Giga Spaces
Map Reduce
GPU
Voldemort
Exadata
HBase
Esper
Quartet
ActivePivot
Sqoop
RabbitMQ,
Zero MQ
Ultra Low
latency
Hama
Igraph
MapR
EMC
Redis
ExalyticsIn memory
Distributed
« Traditional »
architectures
RDBMS,
Application server,
ETL, ESB
36
Event flow oriented
application
(streaming)
Transaction oriented
applications
(TPS)
Storage oriented
applications
(IO bound)
Computation
oriented applications
(CPU bound)
NoSQL
NewSQL
NoSQL : ditributed non-
relational stores,
NewSQL : SQL compliant
distributed stores
Streaming
CEP - Complex Event Processing,
ESP - Event Stream Processing
Grid -
GPU
Grid computing on
CPU, or on GPU
In-memory analytics solutions
distribute the data in the
memory of several nodes to
obtain a low processing time.
In-memory
analytics
Hadoop
The Hadoop ecosystem offers
a distributed storage, but also
distributed computing using
MapReduce.
Emerging families
37
38
Hadoop : a reference in the Big Data landscape
• Apache Hadoop
Open Source
• Cloudera CDH
• Hortonworks
• MapR
• DataStax (Brisk)
Main distributions
• Greenplum (EMC)
• IBM InfoSphere BigInsights (CDH)
• Oracle Big data appliance (CDH)
• NetApp Analytics (CDH)
• …
Commercial
• Amazon EMR (MapR)
• VirtualScale (CDH)
Cloud
39
Key principles
File storage more voluminous than a single disk
Data distributed on several nodes
Data replication to ensure « fail-over », with « rack awareness »
Use of commodity disk instead of SAN
Hadoop Distributed File System (HDFS)
40
Key principles
Parallelise and distribute processing
Quicker processing of smaller data volumes (unitary)
Co-location of processing and data
Hadoop distributed processing : Map Reduce
41
Overview of Hadoop architecture
Distributed Storage
Distributed Processing
Querying
Advanced
processing
Orchestration
Integrationw/
InformationSystem
MonitoringandManagement
42
Available tools in a typical distribution (CDH)
HDFS
MapReduce
YARN (v2)
Pig
Cascading
Hive
Oozie
Azkaban
Mahout
HAMA
Giraph
Sqoop
Flume
Scribe
Chukwa
CLI
Web
Console
Hue
Cloudera
Manager
HBase
Impala
43
Hadoop : a blooming ecosystem !!
Processing
Hadoop Distributed
Storage
Distributed FS Local FS NoSQL datastores
GlusterFS HDFS S3 CephCassandra RingDynamoDB
OLAP OLTP
Machine
Learning
HBase Impala Hawq Map Reduce /
Tez
Map
Reduce /
Tez
R, Python,…
MahoutStreaming Cascading
R, Python,…
Hive Pig StreamingCascading
Spark Spark
Openstack
SwiftIsilon
Scalding
Giraph Hama
SciKit
Stinger
MapR
Lots of annoucements and new tools appearing every day …
Maturity is very variable from one tool to another
44
Maturities of solutions in the Hadoop ecosystem are very
heterogeneous
Ex : HDFS and MapReduce are perfectly production ready
Yahoo manages a peta-byte scale HDFS cluster
But some tools around are still poor : especially admin and debug tools
Ex : Impala (real-time querying, with SQL-compliant queries) is not
production-ready
Ex : Adaptation of machine learning libraries to distributed computation
with MarReduce is on-going
Apache Mahout has MapReduce compliant algorithms
MapReduce libraries for R are quite young
Maturity of tools
45
Hadoop is a rich and quite new technology, difficult to master
Get trained, bring experts in your project !
46
WRAP-UP
47
Big Data aims at getting an
economical advantage
from the quantitative analysis of
internal and external data
48
Data we traditionally
manipulate
(customers, product catalog…)
Innovation is here !
49
Since many years, we use Machine Learning algorithms to find patterns in data
Big Data technologies now allow us to manipulate much more data, and get
more value with Machine Learning techniques
Machine Learning + Big Data
Linear regression
Neural network
50
Hadoop : a reference in the Big Data technology landscap
But with a very effervescent ecosystem.
It’s hard to follow all the trends and evolutions without a dedicated RnD team.
Don’t do this alone, get trained, and bring experts in your project
Hadoop
51
Mathieu DESPRIEE
mde@octo.com
twitter : @mdeocto

Big Data & Machine Learning - TDC2013 Sao Paulo

  • 1.
    1© OCTO 2013 BigData and Machine Learning Mathieu DESPRIEE mde@octo.com twitter : @mdeocto
  • 2.
  • 3.
    3 What a buzzword!!! Google trends on “big data” Gartner hype cycle 2012
  • 4.
    4 WEB Google, Amazon, Facebook, Twitter, … ITVendors IBM, Teradata, Vmware, EMC, … Management McKinsey, BCG, Gartner, … Web giants gave some reality to a concept anticipated by Gartner. This software evolution didn’t come from traditional software vendors (which is quite unusual) Origins of Big Data Web giants implement BigData solutions for their owns needs Vendors are followers in this movement. They try to take a hold on this very promising business Consulting firms predicted a big economic change, and Big Data is part of it
  • 5.
  • 6.
    6 There’s no cleardefinition of Big Data It is altogether a business ambition and many technological opportunities Is there a clear definition ? Super datawarehouse? Low cost storage ? NoSQL? Cloud? Internet Intelligence? Real-time analysis ? Unstructured data? Open Data? Big databases?
  • 7.
  • 8.
  • 9.
    9 Volume Variety Velocity Day Hour Second Real time MB TBGBPBFile Structured Social networks API Text Video Web Audio
  • 10.
    10 Data we traditionally manipulate (customers,product catalog…) Innovation is here ! Data and Innovation
  • 11.
  • 12.
    12 Big Data aimsat getting an economical advantage from the quantitative analysis of internal and external data Big Data : proposed definition
  • 13.
    13 Some real use-cases studiedwith OCTO Telecom • Analyze behavior of customers (calls to service center, opinion about the brand on social networks …) to identify a risk of churn • Analyze the huge amount of data quality metrics from network infrastructure in real-time to proactively inform the call-center about network quality of service Insurance • Crawl the web (especially forums) to identify correlation between damages, and center of interests in communities (health, household insurance, car insurance…) • Improve datamining models, and risk models e-Commerce • Analyze weblogs and customer reviews to improve product recommendation • Analyze data from call- center (calls, emails) to improve customer loyalty
  • 14.
  • 15.
  • 16.
    16 « Machine Learning» is not new. A first definition of it was given in 1959 : Field of study that gives computers the ability to learn without being explicitly programmed Arthur Samuel 1959 A computer program is said to learn from experience E with respect to some class of tasks T and performance measure P, if its performance at tasks in T, as measured by P, improves with experience ETom Mitchell 1998 Machine Learning : a definition We prefer this definition, more recent, and more precise :
  • 17.
    17 A computer program issaid to learn from experience E with respect to some class of tasks T and performance measure P, if its performance at tasks in T, as measured by P, improves with experience E Example with a SPAM classifier I tag some of my emails into ‘spam’ or not Ratio of emails correctly classified automatically The classifier put incoming emails in ‘spam’ or not SPAM Classifier
  • 18.
    18 A Machine Learningapproach works only if 3 conditions are fulfilled What’s new with Big Data in Machine Learning ? Some « pattern » exist in data You have a lot of data. A LOT. (millions of samples) There’s no analytical model to describe it (= it’s a probabilistic problem) A Big Data approach allows us to collect and manipulate much more data. Machine Learning is a fundamental tool to leverage this huge amount of information 1 2 3 Machine Learning algorithms exist since many years to address these In the past, performance of ML models was often limited by the lack of available data. Now we can collect and manipulate much more
  • 19.
    19 Let’s imagine wewant to predict if a customer of a telecom operator will churn (go to a concurrent) We will build a classifier, and start by building a learning set For each customer, we collect a finite number of data, named attributes Customer offer / plan Customer data (region, age, sex, …) Last 12 bills amount Number of calls to call-center last 6 months Amount of local calls of last 12 months Amount of international calls of last 12 months Amount of downloaded data etc. And for each customer in the training set, we know if the customer churned or not. It’s the tag. Machine Learning example : classification
  • 20.
    20 Logistic regression classifier 45.72 34.21 23.55 46.12 12.45 45.90 41.79 39.80 17.59 9.45 … 84.23 21.43 50.64 32.76 5.42 32.11 21.43 50.64 32.76 4.13 81.23 19.71 13.83 5.44 … 4.21 19.24 32.34 56.16 1 0 0 2 0 0 0 5 0 0 … 0 2 0 0 380 412 310 365 367 450 515 290 340 420 … 410 504 554 650 404 491 148 323 385 581 649 434 219 439 … 283 425 535 701 0 1 0 1 0 0 0 1 0 0 … 0 0 0 1 Bill1 Bill 2 Bill k Calls to call-center Avg Data Xn X θ1 θ2 θ3 θ4 θ5 θ6 θ7 θ8 θ9 θ10 … θm-1 θm θ Y … … Sex M M M F M F F F M M … F F F M … … learning samples : customers learning samples : TAG “churn” or not n attributes per customer parameters of the model to compute = learning output fn() sigmoïd function to have a binary output
  • 21.
    21 The θ vectoris computed during the training phase When the θ vector is computed, our classification model is ready Then we test this model against other values for X (the test set), and we check if our model is good at predicting the output value y. We talk about robustness of the model = its capacity to generalize the prediction. The challenge is to get a reasonable error ratio, and not to “overfit” the algorithm to the training sample (it will predict nothing) In general, 80% of your whole data set are used for training, and 20% for testing Machine Learning example : classification * C’est souvent 60%/20%/20% pour effectuer une étape de validation du modèle
  • 22.
    22 Supervised learning Data istagged : we know if the customer is a churner or not for the training phase Positives (churners) are abundant enough in sample to identify the typical churner For some use-cases, the tagging may require the help of an expert to prepare the training set. Expertise is needed before machine learning. The challenge is about the generalization of the model Unsupervised learning We don’t know output values (the Y vector). We don’t know the number of tags, nor their nature Some of the attributes are not homogeneous amongst all the samples in X The algorithm will group inputs xi by similarities (creating clusters) The expertise is needed after machine learning, to interpret the results, and name the discovered categories The challenge is about understanding the output classification Different strategies in categorisation ??
  • 23.
    23 Draw a line(hyperplane) that divide points in space, into 2 classes Find a line with the best margin (good distance from points to the line) Try to minimize the error (points on the bad side) Example of supervised algorithm : Support Vector Machine If distribution is fundamentaly non- linearly separable, algorithms exist to transform the data to higher dimension, and make it linearly separable.
  • 24.
    24 Example of unsupervisedalgorithm : K-Means clustering Choose k points randomly in space (the seeds) Until convergence Assign each input point to nearest seed to form clusters Compute the center of gravity of clusters, and use these points as new seeds
  • 25.
    25 Dimensionality reduction Example :product recommendation engine N customers x P products (ci, pj) = 1 if customer i bought product j Very big and sparse matrix Each customer is a point in a space having a big number of dimensions Idea : find a way to group products and reduce dimensions of this space Others algorithms 0 0 0 0 1 0 0 … 0 0 1 0 0 1 M products 10Mcustomers P1 P2 Pn … … 0 1 0 0 0 0 0 … 0 0 0 0 0 0 0 0 0 0 0 1 … 0 0 0 0 0 Quantity prediction Linear regression : The oldest and most known algorithm
  • 26.
    26 Many algorithms touse, depending on the situation !
  • 27.
    27 © OCTO 2013©OCTO 2012© OCTO 2013 TECHNOLOGY
  • 28.
    28 1956 : 50k$ for a 5 MB IBM hard-drive… today : 20 € for a 8 GB microSD !
  • 29.
    29 Exponential growth ofcapacities CPU, memory, network bandwith, storage … all of them followed the Moore’s law Source : http://strata.oreilly.com/2011/08/building-data-startups.html
  • 30.
    30 The old strategy: Scale-up 0.01 0.10 1.00 10.00 100.00 1,000.00 10,000.00 100,000.00 1,000,000.00 1965 1970 1975 1980 1985 1990 1995 2000 2005 2010 2015 100k $/GB 0,10 $/GB HDD RAM The old way : If you have too much data, just wait a few months that the cost decrease, and then scale-up your infrastructure Source : http://www.mkomo.com/cost-per-gigabyte
  • 31.
  • 32.
    32 0 10 20 30 40 50 60 70 MB/s 1990 2010 64 MB/s 0,7MB/s Seagate Barracuda 7200.10 Seagate Barracuda ATA IV IBM DTTA 35010 x 100’000 x 91 Storage capacity Throughtput We can store 100’000 times more data, but it takes 1000 times longer to read it !
  • 33.
    33 Limitations of traditionalarchitectures Over 10 Tb, « classical » architectures requires huge software and hardware adaptations. Over 1 000 transactions / second, « classical » architectures requires huge software and hardware adaptations. Over 10 threads/Core CPU, sequential programming reach its limits (IO). Over 1 000 events / second, « classical » architectures requires huge software and hardware adaptations. Distributed storage Share nothing XTP Parallel processing Event Stream Processing « Traditional » architectures RDBMS, Application server, ETL, ESB Event flow oriented application (streaming) Transaction oriented applications (TPS) Storage oriented applications (IO bound) Computation oriented applications (CPU bound)
  • 34.
    34 Big Data =explosion of volumes : data to store online processing to parallelize number of transactions per second to handle number of messages per second to process + New constraints New types of data (unstructured, semi-structured…) Distribution of storage and processing Cost reduction Need of elasticity = New technologies Horizontal scalability and clustering Data partitioning / sharding Parallel processing In-memory processing New Architectures
  • 35.
    35 Some emerging solutions Eventflow oriented application (streaming) Transaction oriented applications (TPS) Storage oriented applications (IO bound) Computation oriented applications (CPU bound) Cassandra, Mong oDB, CouchDB HDFS SQLFire Teradata Hana Grid Computing Giga Spaces Map Reduce GPU Voldemort Exadata HBase Esper Quartet ActivePivot Sqoop RabbitMQ, Zero MQ Ultra Low latency Hama Igraph MapR EMC Redis ExalyticsIn memory Distributed « Traditional » architectures RDBMS, Application server, ETL, ESB
  • 36.
    36 Event flow oriented application (streaming) Transactionoriented applications (TPS) Storage oriented applications (IO bound) Computation oriented applications (CPU bound) NoSQL NewSQL NoSQL : ditributed non- relational stores, NewSQL : SQL compliant distributed stores Streaming CEP - Complex Event Processing, ESP - Event Stream Processing Grid - GPU Grid computing on CPU, or on GPU In-memory analytics solutions distribute the data in the memory of several nodes to obtain a low processing time. In-memory analytics Hadoop The Hadoop ecosystem offers a distributed storage, but also distributed computing using MapReduce. Emerging families
  • 37.
  • 38.
    38 Hadoop : areference in the Big Data landscape • Apache Hadoop Open Source • Cloudera CDH • Hortonworks • MapR • DataStax (Brisk) Main distributions • Greenplum (EMC) • IBM InfoSphere BigInsights (CDH) • Oracle Big data appliance (CDH) • NetApp Analytics (CDH) • … Commercial • Amazon EMR (MapR) • VirtualScale (CDH) Cloud
  • 39.
    39 Key principles File storagemore voluminous than a single disk Data distributed on several nodes Data replication to ensure « fail-over », with « rack awareness » Use of commodity disk instead of SAN Hadoop Distributed File System (HDFS)
  • 40.
    40 Key principles Parallelise anddistribute processing Quicker processing of smaller data volumes (unitary) Co-location of processing and data Hadoop distributed processing : Map Reduce
  • 41.
    41 Overview of Hadooparchitecture Distributed Storage Distributed Processing Querying Advanced processing Orchestration Integrationw/ InformationSystem MonitoringandManagement
  • 42.
    42 Available tools ina typical distribution (CDH) HDFS MapReduce YARN (v2) Pig Cascading Hive Oozie Azkaban Mahout HAMA Giraph Sqoop Flume Scribe Chukwa CLI Web Console Hue Cloudera Manager HBase Impala
  • 43.
    43 Hadoop : ablooming ecosystem !! Processing Hadoop Distributed Storage Distributed FS Local FS NoSQL datastores GlusterFS HDFS S3 CephCassandra RingDynamoDB OLAP OLTP Machine Learning HBase Impala Hawq Map Reduce / Tez Map Reduce / Tez R, Python,… MahoutStreaming Cascading R, Python,… Hive Pig StreamingCascading Spark Spark Openstack SwiftIsilon Scalding Giraph Hama SciKit Stinger MapR Lots of annoucements and new tools appearing every day … Maturity is very variable from one tool to another
  • 44.
    44 Maturities of solutionsin the Hadoop ecosystem are very heterogeneous Ex : HDFS and MapReduce are perfectly production ready Yahoo manages a peta-byte scale HDFS cluster But some tools around are still poor : especially admin and debug tools Ex : Impala (real-time querying, with SQL-compliant queries) is not production-ready Ex : Adaptation of machine learning libraries to distributed computation with MarReduce is on-going Apache Mahout has MapReduce compliant algorithms MapReduce libraries for R are quite young Maturity of tools
  • 45.
    45 Hadoop is arich and quite new technology, difficult to master Get trained, bring experts in your project !
  • 46.
  • 47.
    47 Big Data aimsat getting an economical advantage from the quantitative analysis of internal and external data
  • 48.
    48 Data we traditionally manipulate (customers,product catalog…) Innovation is here !
  • 49.
    49 Since many years,we use Machine Learning algorithms to find patterns in data Big Data technologies now allow us to manipulate much more data, and get more value with Machine Learning techniques Machine Learning + Big Data Linear regression Neural network
  • 50.
    50 Hadoop : areference in the Big Data technology landscap But with a very effervescent ecosystem. It’s hard to follow all the trends and evolutions without a dedicated RnD team. Don’t do this alone, get trained, and bring experts in your project Hadoop
  • 51.