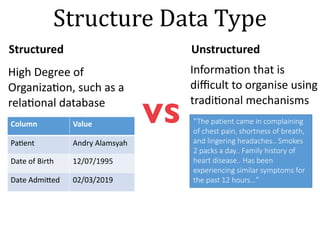
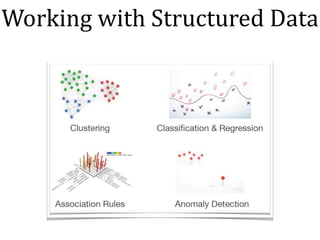
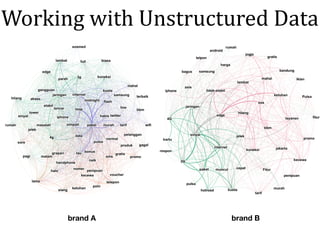
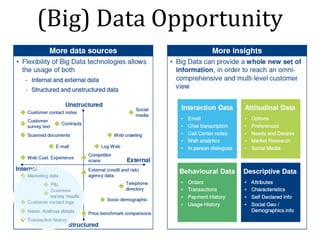
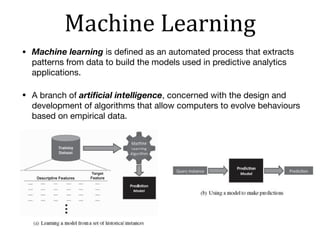
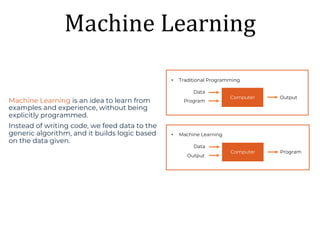
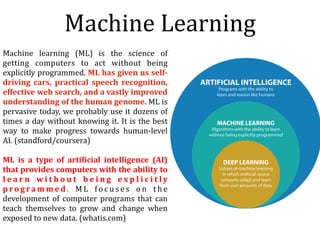
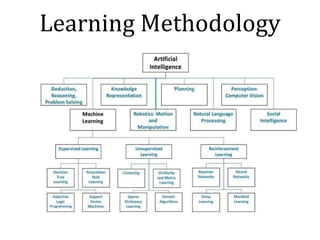
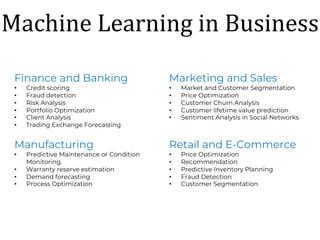
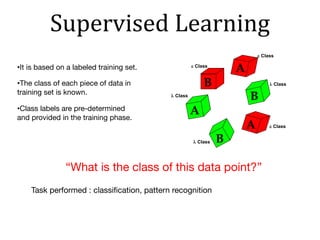
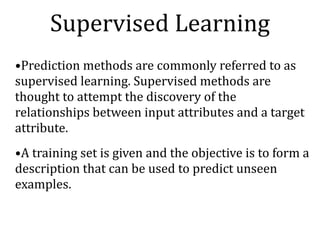
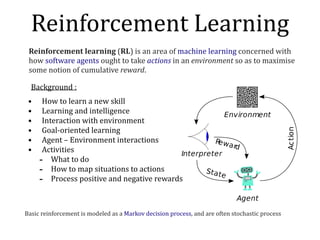
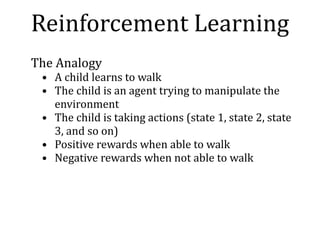
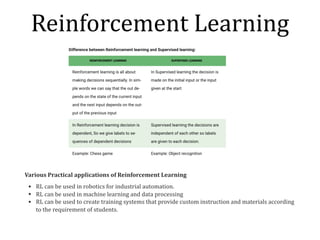
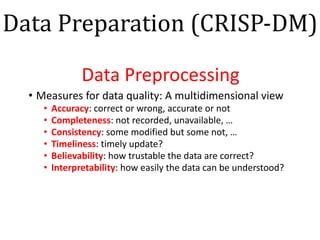
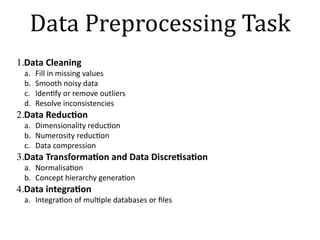
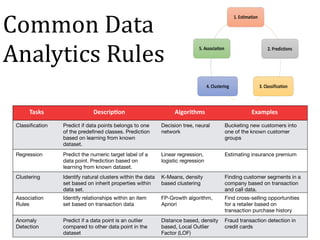
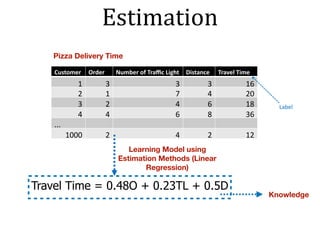
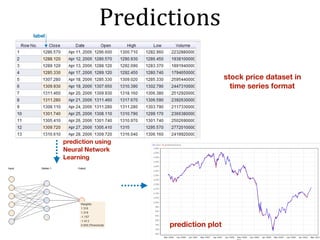
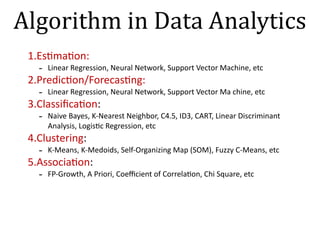
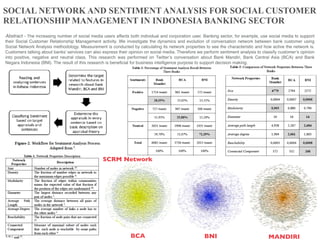
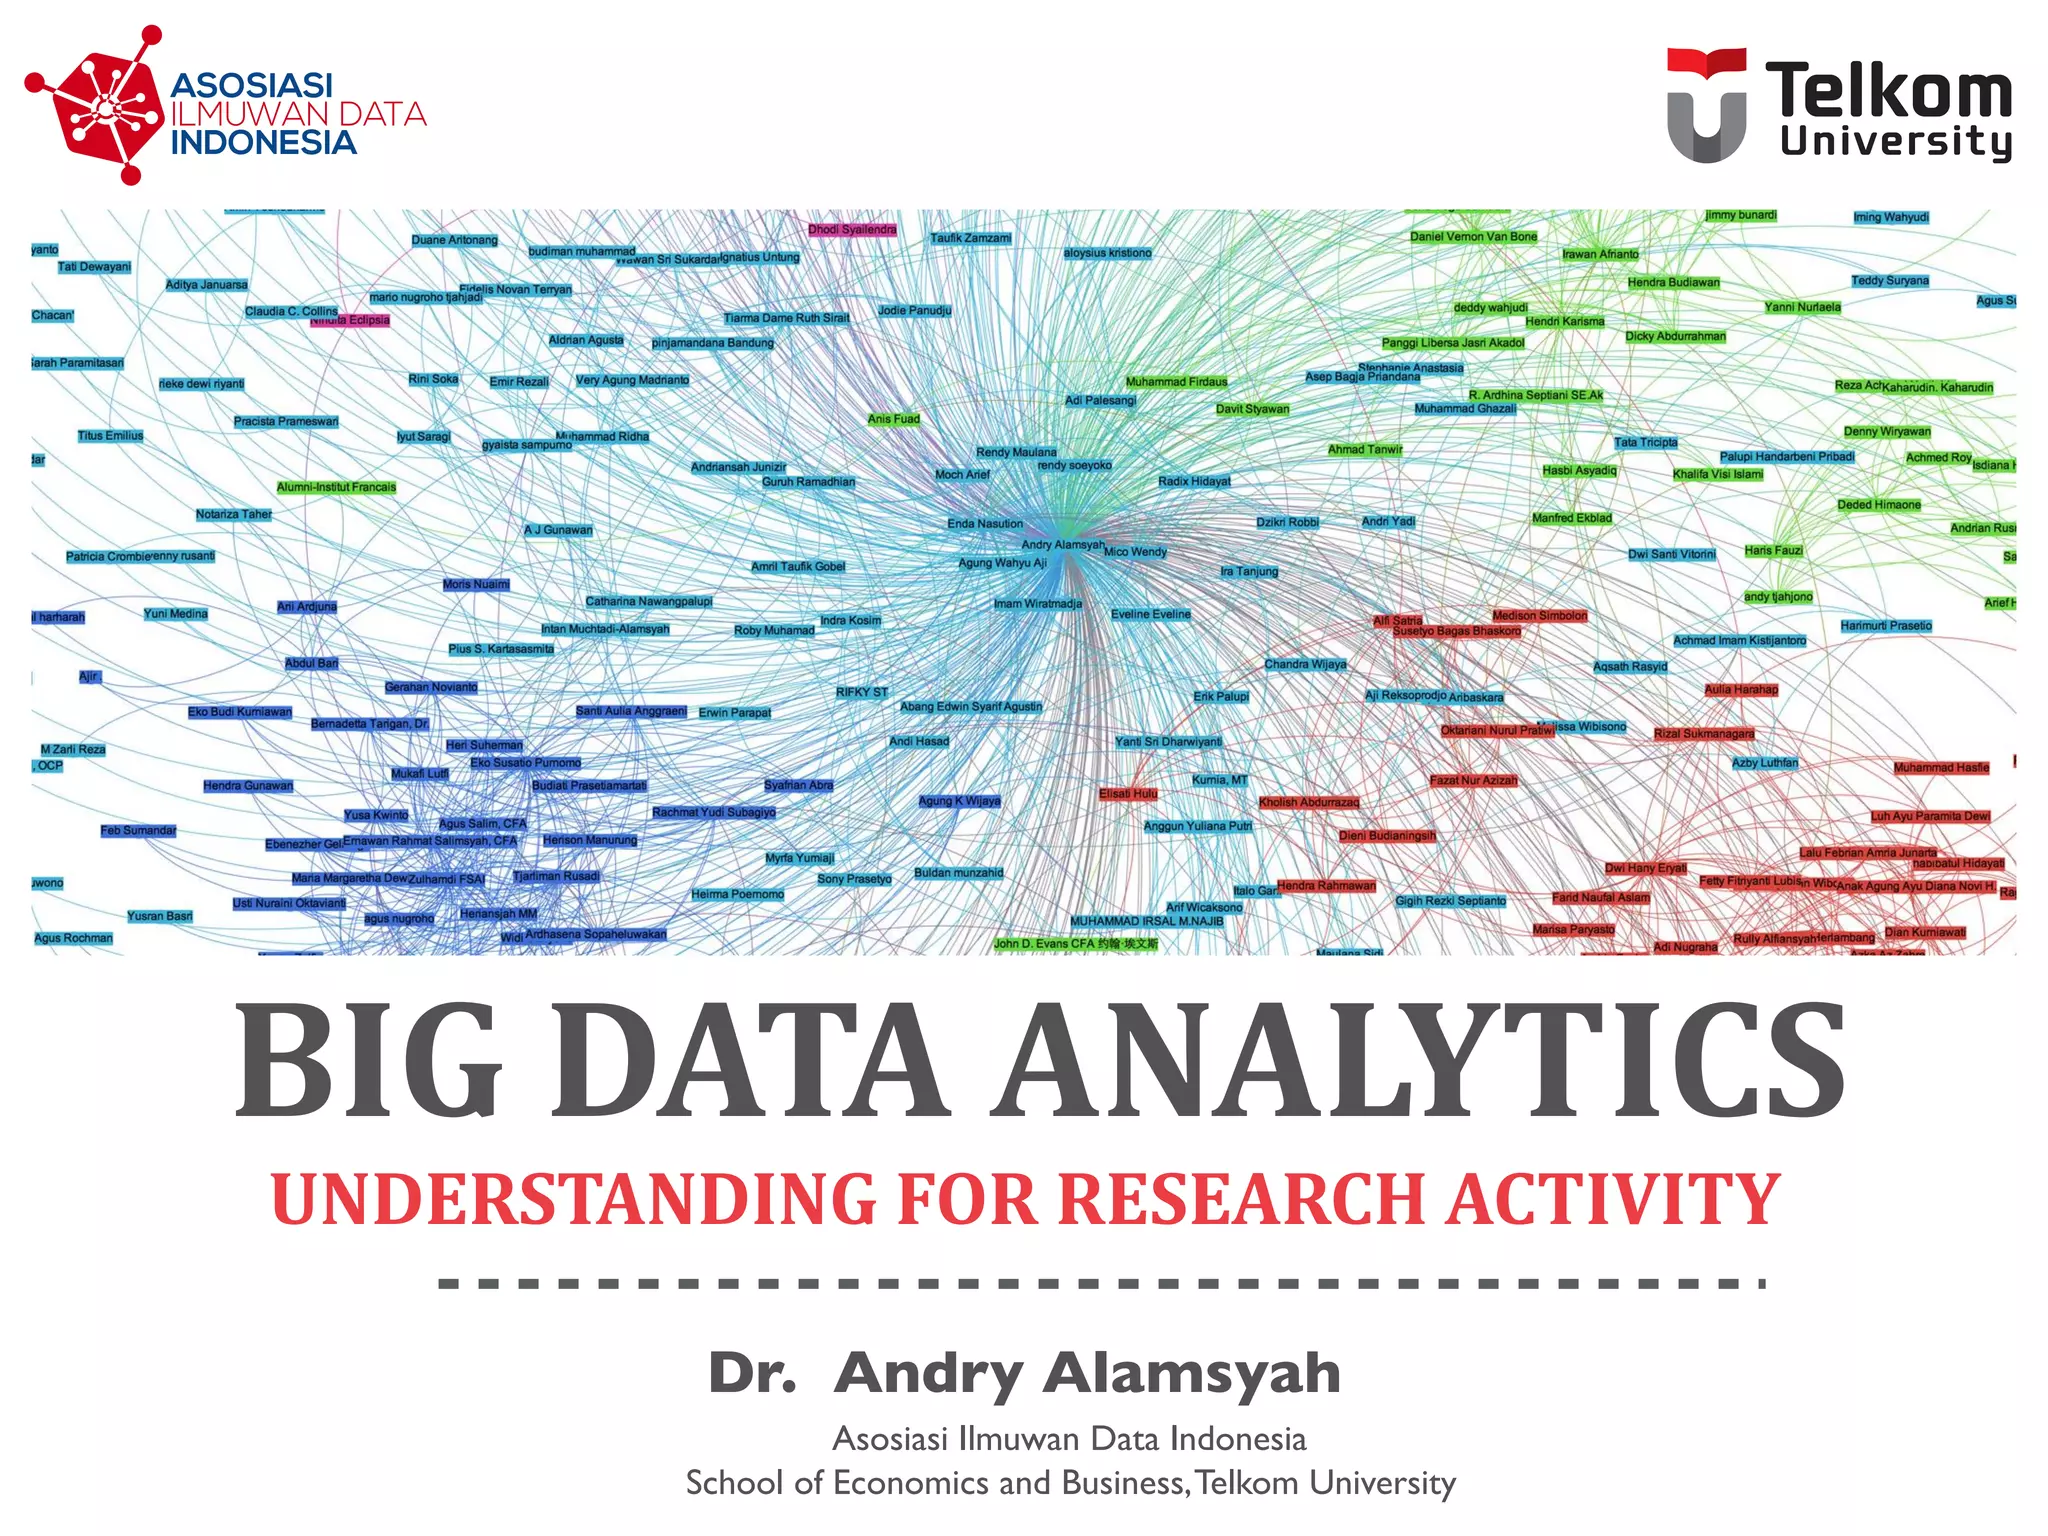
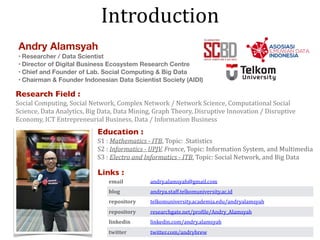
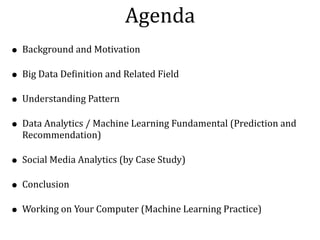
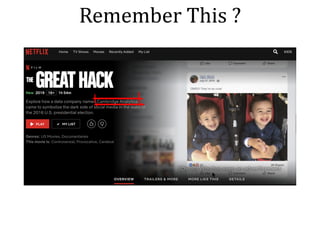
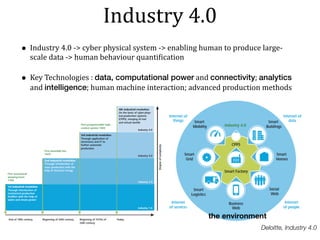
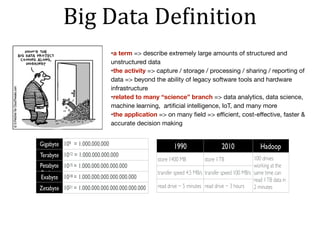
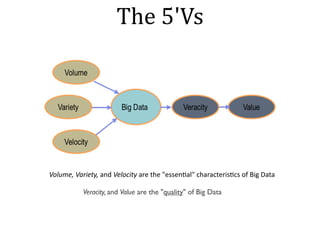
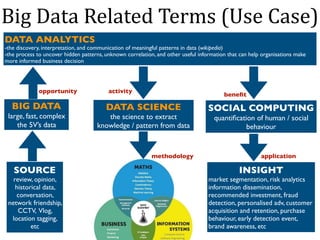
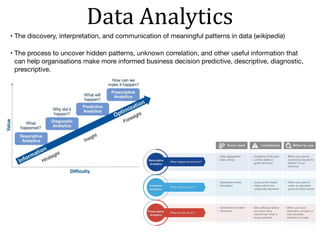
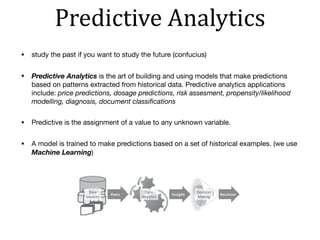
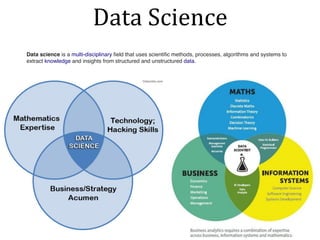
This document provides an overview of big data analytics and understanding for research activity presented by Dr. Andry Alamsyah. It discusses key concepts related to big data including definitions, characteristics, related fields, and opportunities. It also covers machine learning fundamentals and methodologies including supervised learning, unsupervised learning, and reinforcement learning. Examples of applications in areas like predictive analytics, recommendation systems, and social media analytics are also mentioned. Finally, it discusses data preparation techniques and common data analytics tasks.
Gather the required information from the data and predict future outcomes and trends. Use content-ready Predictive Analysis PowerPoint Presentation Slides to forecast future probabilities. Majorly applied in the business field, predictive analysis PPT templates will help you evaluate current data and historical facts to understand customers, products, services, partners, and to identify potential risks and opportunities for an organization. This deck comprises of templates such as research methodology, consumer insights consumption, need for consumer insights, key stats, data collection and processing, consumer insight capabilities, These templates are completely customizable. You can edit the templates as per your need. Change color, text, icon and font size as per your requirement. Add or remove the content, if needed. Get access to the predictive analysis PowerPoint presentation slideshow to predict future outcomes for various business topics such as customer relationship management, health care, collection analytics, fraud detection, risk management, direct marketing, industry applications, etc. Get access to the professionally designed ready-made predictive analysis PowerPoint presentation slides for your business to interpret big data for your benefit. Maintain your demeanour with our Predictive Analysis Powerpoint Presentation Slides. They will help you keep your cool. https://bit.ly/2WktT53
A look back at how the practice of data science has evolved over the years, modern trends, and where it might be headed in the future. Starting from before anyone had the title "data scientist" on their resume, to the dawn of the cloud and big data, and the new tools and companies trying to push the state of the art forward. Finally, some wild speculation on where data science might be headed.
Presentation given to Seattle Data Science Meetup on Friday July 24th 2015.
Big Data Characteristics And Process PowerPoint Presentation SlidesSlideTeam
We present you content-ready big data characteristics and process PowerPoint presentation that can be used to present content management techniques. It can be presented by IT consulting and analytics firms to their clients or company’s management. This relational database management PPT design comprises of 53 slides including introduction, facts, how big is big data, market forecast, sources, 3Vs and 5Vs small Vs big data, objective, technologies, workflow, four phases, types, information analytics process, impact, benefits, future, opportunities and challenges etc. Our data transformation PowerPoint templates are apt to present various topics such as information management concepts and technologies, transforming facts with intelligence, data analysis framework, data mining, technology platforms, data transfer and visualization, content management, Internet of things, data storage and analysis, information infrastructure, datasets, technology and cloud computing. Download big data characteristics and process PPT graphics to make an impressive presentation. Develop greater goodwill with our Big Data Characteristics And Process PowerPoint Presentation Slides. Folks feel friendlier towards you.
This presentation is about basics of Big data Analytics along with Characteristics,Challenges,Structures,Differences between Traditional and Big data,How Big data is getting benefited in Healthcare Industry,Big data in Real time
This presentation briefly explains the following topics:
Why is Data Analytics important?
What is Data Analytics?
Top Data Analytics Tools
How to Become a Data Analyst?
The 8 Best Examples Of Real-Time Data AnalyticsBernard Marr
Real-time analytics are already being used in a wide range of business applications, including cracking down on fake news and helping police make cities safer. Find out more amazing examples of how companies today are using streaming analytics in real life.
This presentation is an Introduction to the importance of Data Analytics in Product Management. During this talk Etugo Nwokah, former Chief Product Officer for WellMatch, covered how to define Data Analytics why it should be a first class citizen in any software organization
This presentation introduces big data and explains how to generate actionable insights using analytics techniques. The deck explains general steps involved in a typical analytics project and provides a brief overview of the most commonly used predictive analytics methods and their business applications.
Vijay Adamapure is a Data Science Enthusiast with extensive experience in the field of data mining, predictive modeling and machine learning. He has worked on numerous analytics projects ranging from healthcare, business analytics, renewable energy to IoT.
Vijay presented these slides during the Internet of Everything Meetup event 'Predictive Analytics - An Overview' that took place on Jan. 9, 2015 in Mumbai. To join the Meetup group, register here: http://bit.ly/1A7T0A1
What is big data ? | Big Data ApplicationsShilpaKrishna6
Big data is similar to ‘small data’ but bigger in size. It is a term that describes the large volume of data both structured and unstructured. Big data generates value from the storage and processing of very large quantities of digital information that cannot be analyzed with traditional computing techniques
Hot technology trends for 2020 and beyond: A preview of Deloitte’s annual Tec...Deloitte United States
Get an early preview of Deloitte's 11th annual Tech Trends report, and subscribe to receive it as soon as it's published in early 2020: https://www2.deloitte.com/us/en/pages/technology/articles/technology-consulting-tech-trends-subscribe.html
Deloitte's 11th annual Tech Trends report, releasing early 2020, will build upon the nine macro technology forces that form the backbone of business strategy and transformation: experience, analytics, cloud, core modernization, risk, the business of technology, digital reality, cognitive, and blockchain. To prepare for 2020, we explore the latest technology advancements that companies are harnessing to help launch completely new products and business models in record time—from human-technology interaction and the pursuit of brand trust to elevation of systems architecture, IT and finance innovating at the speed of agile, and digital twin applications that bridge the digital and physical.
The growth in the use of technology has led organizations to generate data for which they need Data Analytics to analyze the data to make business decisions.
The presentation includes the following topics:
- Introduction to Data Analytics
- Data Analytics Process
- Data Analytics Skills
- Certifications Information for Data Analytics
Big data Analytics is a process to extract meaningful insight from big such as hidden patterns, unknown correlations, market trends and customer preferences
Data science has grown in popularity as a result of the rise of programming languages such as Python and techniques for collecting, analyzing, and interpreting data.
Making sense of data, on the other hand, has a long history and has been a source of contention for scientists, statisticians, librarians, computer scientists, and others for many years. This infographic portrays the evolution of the phrase "Data Science" over time, as well as attempts to define it and related terms. For more details visit:- https://www.careerera.com/blog/history-of-data-science
The right architecture is key for any IT project. This is especially the case for big data projects, where there are no standard architectures which have proven their suitability over years. This session discusses the different Big Data Architectures which have evolved over time, including traditional Big Data Architecture, Streaming Analytics architecture as well as Lambda and Kappa architecture and presents the mapping of components from both Open Source as well as the Oracle stack onto these architectures.
Applying Data Science and Analytics in MarketingData Con LA
Data Con LA 2020
Description
The importance of leveraging data science and analytics to analyze and measure the effectiveness of marketing campaigns to maximize profitability and better optimization on Return of Investment (ROI) in the era of 4th industrial revolution. Marketing campaign optimization involves the application data analysis and machine learning algorithms to build solutions and models that provides valuable insights that increases efficiencies and simplifies KPI metrics monitoring and tracking. Core benefits of applying data science and analytics in marketing includes; mitigating risk of wasteful investment, Increasing ROI, increasing operation efficiencies by monitoring KPI metrics from a centralized platform, identifying and forecasting future trends and patterns.
*Introduction to Marketing Mix Channels, marketing campaigns implementation and the application of data science and analytics across all channels to increase efficiency.
*Data collection from disparate marketing data sources, software and databases.
*Building holistic 360 view of analytics marketing solutions from consumer's interaction with marketing campaigns to engagement on the website towards goal consideration to customer acquisition.
*Data Analytics solutions and models development workflow and use cases of data science in marketing. (Attribution model, predictive model and marketing mix model).
*Data-driven Marketing optimization strategies (A/b testing, customer segmentation and personalized messages/retargeting)
Speaker
Tochukwu Matthias, Molina Healthcare, Data & Analytics Manager
INTRODUCTION TO DATA SCIENCE -CONCEPTS.pptxMadhumitha N
This ppt says the introduction to data science and all the basic concepts of data science like data mining and Eda and cycle of data science and analytics
"In 'Unleashing the Power of AI,' we delve into the transformative potential of artificial intelligence (AI) across industries and its profound impact on society. From revolutionizing healthcare with personalized medicine to optimizing transportation with autonomous vehicles, AI is reshaping how we live, work, and interact with technology. Join us as we explore the latest advancements, real-world applications, and ethical considerations driving the AI revolution forward, unlocking new opportunities and shaping the future of innovation."
About
Evolution of Data, Data Science , Business Analytics, Applications, AI, ML, DL, Data science – Relationship, Tools for Data Science, Life cycle of data science with case study,
Algorithms for Data Science, Data Science Research Areas,
Future of Data Science.
Understanding Data Science: Unveiling the Basics
What is Data Science?
Data science is an interdisciplinary field that combines techniques from statistics, mathematics, computer science, and domain knowledge to extract insights and knowledge from data. It involves collecting, processing, analyzing, and interpreting large and complex datasets to solve real-world problems.
Importance of Data Science
In today's data-driven world, organizations are inundated with data from various sources. Data science allows them to convert this raw data into actionable insights, enabling informed decision-making, improved efficiency, and innovation.
Intersection of Data Science, Statistics, and Computer Science
Data science borrows heavily from statistics and computer science. Statistical methods help in understanding data patterns, while computer science provides the tools to process and analyze large datasets efficiently.
Key Components of Data Science
Data Collection and Storage
The first step in data science is gathering relevant data from various sources. This data is then stored in databases or data warehouses for further processing.
Data Cleaning and Preprocessing
Raw data is often messy and inconsistent. Data cleaning involves removing errors, duplicates, and irrelevant information. Preprocessing includes transforming data into a usable format.
Exploratory Data Analysis (EDA)
EDA involves visualizing and summarizing data to uncover patterns, trends, and anomalies. It helps in forming hypotheses and guiding further analysis.
Machine Learning and Predictive Modeling
Machine learning algorithms are used to build predictive models from data. These models can make predictions and decisions based on new, unseen data.
Data Visualization
Visual representations of data, such as graphs and charts, help in understanding complex information quickly. Data visualization aids in conveying insights effectively.
The Data Science Process
Problem Definition
The data science process begins with understanding the problem you want to solve and defining clear objectives.
Data Collection and Understanding
Collect relevant data and understand its context. This step is crucial as the quality of the analysis depends on the quality of the data.
Data Preparation
Clean, preprocess, and transform the data into a suitable format for analysis. This step ensures that the data is accurate and ready for modeling.
Model Building
Select appropriate algorithms and build predictive models using machine learning techniques. This step involves training and fine-tuning the models.
Model Evaluation and Deployment
Evaluate the model's performance using metrics and test datasets. If the model performs well, deploy it for making predictions on new data.
Technologies Driving Data Science
Programming Languages
Languages like Python and R are widely used in data science due to their extensive libraries and versatility.
Machine Learning Libraries
Libraries like Scikit-Learn and TensorFlow prov
Data Science - An emerging Stream of Science with its Spreading Reach & ImpactDr. Sunil Kr. Pandey
This is my presentation on the Topic "Data Science - An emerging Stream of Science with its Spreading Reach & Impact". I have compiled and collected different statistics and data from different sources. This may be useful for students and those who might be interested in this field of Study.
Fundamental Areas Of Study In Data Science.pdfBPBOnline
Data Science is a broad term that encompasses multiple disciplines. It is a rapidly growing field of study that uses scientific methods to extract meaningful insights from given input data. The rapid growth in the field of data science has opened the eyes of researchers interested in this field to explore more into the multiple disciplines that encompass data science.
Let's see a few of these broad areas that are fundamental aspects to be covered for mastering Data science.
The slide has details on below points:
1. Introduction to Machine Learning
2. What are the challenges in acceptance of Machine Learning in Banks
3. How to overcome the challenges in adoption of Machine Learning in Banks
4. How to find new use cases of Machine Learning
5. Few current interesting use cases of Machine Learning
Please contact me (shekup@gmail.com) or connect with me on LinkedIn (https://www.linkedin.com/in/shekup/) for more explanation on ML and how it may help your business.
The slides are inspired by:
Survey & interviews done by me with Bankers & Technology Professionals
Presentation from Google NEXT 2017
Presentation by DATUM on Youtube
Royal Society Machine Learning
Big Data & Social Analytics Course from MIT & GetSmarter
Introduction to Data Science: Unveiling Insights Hidden in Datahemayadav41
Embark on a journey into the fascinating field of Data Science and uncover the valuable insights concealed within vast datasets. In this article, we explore the fundamental concepts of Data Science and its applications. Discover how a Data science Training Institute in Jaipur, Lucknow, Indore, Mumbai, Delhi, Noida, Gurgaon and other cities in India can equip you with the knowledge and skills to analyze, interpret, and extract meaningful information from data. Explore topics such as data preprocessing, statistical analysis, machine learning, and data visualization. Join us on this enlightening exploration of the world of Data Science.
Similar to Big Data Analytics : Understanding for Research Activity (20)
Open Data Analytical Model for Human Development Index to Support Government ...Andry Alamsyah
The transparency nature of Open Data is beneficial for citizens to evaluate government work performance. In Indonesia, each government bodies or ministry have their own standard operation procedure on data treatment resulting in incoherent information between agent and likely to miss valuable insight. Therefore, our motivation is to show the advantage of Open Data movement to support unified government decision making. We use dataset from data.go.id which publish official data from each government bodies. The idea is by using those official but limited data, we can find important pattern. The case study is on Human Development Index value prediction and its clustered nature. We explore the data pattern using two important data analytics methods classification and clustering procedure. Data analytics is the collection of activities to reveal unknown data pattern. Specifically, we use Artificial Neural Network classification and K-means clustering. The classification objective is to categorize different level of Human Development Index of cities or region in Indonesia based on Gross Domestic Product, Number of Population in Poverty, Number of Internet User, Number of Labors and Number of Population indicators data. We determined which city belongs to four categories of Human Development stated by UNDP standard. The clustering objective is to find the group characteristics between Human Development Index and Gross Domestic Product.
Hybrid sentiment and network analysis of social opinion polarization icoictAndry Alamsyah
The rapid growth of social media and user generated contents (UGC) has provided a rich source of potentially relevant data. The problems arise on how to summarize those data to understand and transforming it into information. Twitter as one of the most popular social networking and micro-blogging service can be analyzed in terms of content produced with sentiment analysis. On the other hand, some types of networks can also be constructed to analyze the social network structure and network properties. This research intended to combine those content and structural approaches into hybrid approach for identifies social opinion polarization, this is in the form of conversation network. Sentiment analysis used to determine public sentiment, and social network analysis used to analyze the structure of the network, detecting communities and influential actors in the network. Using this hybrid approach, we have comprehensive understanding about social opinion polarization. As case study, we present real social opinion polarization about reclamation issue in Indonesia.
Explore our most comprehensive guide on lookback analysis at SafePaaS, covering access governance and how it can transform modern ERP audits. Browse now!
Premium MEAN Stack Development Solutions for Modern BusinessesSynapseIndia
Stay ahead of the curve with our premium MEAN Stack Development Solutions. Our expert developers utilize MongoDB, Express.js, AngularJS, and Node.js to create modern and responsive web applications. Trust us for cutting-edge solutions that drive your business growth and success.
Know more: https://www.synapseindia.com/technology/mean-stack-development-company.html
Enterprise Excellence is Inclusive Excellence.pdfKaiNexus
Enterprise excellence and inclusive excellence are closely linked, and real-world challenges have shown that both are essential to the success of any organization. To achieve enterprise excellence, organizations must focus on improving their operations and processes while creating an inclusive environment that engages everyone. In this interactive session, the facilitator will highlight commonly established business practices and how they limit our ability to engage everyone every day. More importantly, though, participants will likely gain increased awareness of what we can do differently to maximize enterprise excellence through deliberate inclusion.
What is Enterprise Excellence?
Enterprise Excellence is a holistic approach that's aimed at achieving world-class performance across all aspects of the organization.
What might I learn?
A way to engage all in creating Inclusive Excellence. Lessons from the US military and their parallels to the story of Harry Potter. How belt systems and CI teams can destroy inclusive practices. How leadership language invites people to the party. There are three things leaders can do to engage everyone every day: maximizing psychological safety to create environments where folks learn, contribute, and challenge the status quo.
Who might benefit? Anyone and everyone leading folks from the shop floor to top floor.
Dr. William Harvey is a seasoned Operations Leader with extensive experience in chemical processing, manufacturing, and operations management. At Michelman, he currently oversees multiple sites, leading teams in strategic planning and coaching/practicing continuous improvement. William is set to start his eighth year of teaching at the University of Cincinnati where he teaches marketing, finance, and management. William holds various certifications in change management, quality, leadership, operational excellence, team building, and DiSC, among others.
RMD24 | Debunking the non-endemic revenue myth Marvin Vacquier Droop | First ...BBPMedia1
Marvin neemt je in deze presentatie mee in de voordelen van non-endemic advertising op retail media netwerken. Hij brengt ook de uitdagingen in beeld die de markt op dit moment heeft op het gebied van retail media voor niet-leveranciers.
Retail media wordt gezien als het nieuwe advertising-medium en ook mediabureaus richten massaal retail media-afdelingen op. Merken die niet in de betreffende winkel liggen staan ook nog niet in de rij om op de retail media netwerken te adverteren. Marvin belicht de uitdagingen die er zijn om echt aansluiting te vinden op die markt van non-endemic advertising.
Discover the innovative and creative projects that highlight my journey throu...dylandmeas
Discover the innovative and creative projects that highlight my journey through Full Sail University. Below, you’ll find a collection of my work showcasing my skills and expertise in digital marketing, event planning, and media production.
Skye Residences | Extended Stay Residences Near Toronto Airportmarketingjdass
Experience unparalleled EXTENDED STAY and comfort at Skye Residences located just minutes from Toronto Airport. Discover sophisticated accommodations tailored for discerning travelers.
Website Link :
https://skyeresidences.com/
https://skyeresidences.com/about-us/
https://skyeresidences.com/gallery/
https://skyeresidences.com/rooms/
https://skyeresidences.com/near-by-attractions/
https://skyeresidences.com/commute/
https://skyeresidences.com/contact/
https://skyeresidences.com/queen-suite-with-sofa-bed/
https://skyeresidences.com/queen-suite-with-sofa-bed-and-balcony/
https://skyeresidences.com/queen-suite-with-sofa-bed-accessible/
https://skyeresidences.com/2-bedroom-deluxe-queen-suite-with-sofa-bed/
https://skyeresidences.com/2-bedroom-deluxe-king-queen-suite-with-sofa-bed/
https://skyeresidences.com/2-bedroom-deluxe-queen-suite-with-sofa-bed-accessible/
#Skye Residences Etobicoke, #Skye Residences Near Toronto Airport, #Skye Residences Toronto, #Skye Hotel Toronto, #Skye Hotel Near Toronto Airport, #Hotel Near Toronto Airport, #Near Toronto Airport Accommodation, #Suites Near Toronto Airport, #Etobicoke Suites Near Airport, #Hotel Near Toronto Pearson International Airport, #Toronto Airport Suite Rentals, #Pearson Airport Hotel Suites
What are the main advantages of using HR recruiter services.pdfHumanResourceDimensi1
HR recruiter services offer top talents to companies according to their specific needs. They handle all recruitment tasks from job posting to onboarding and help companies concentrate on their business growth. With their expertise and years of experience, they streamline the hiring process and save time and resources for the company.
Memorandum Of Association Constitution of Company.pptseri bangash
www.seribangash.com
A Memorandum of Association (MOA) is a legal document that outlines the fundamental principles and objectives upon which a company operates. It serves as the company's charter or constitution and defines the scope of its activities. Here's a detailed note on the MOA:
Contents of Memorandum of Association:
Name Clause: This clause states the name of the company, which should end with words like "Limited" or "Ltd." for a public limited company and "Private Limited" or "Pvt. Ltd." for a private limited company.
https://seribangash.com/article-of-association-is-legal-doc-of-company/
Registered Office Clause: It specifies the location where the company's registered office is situated. This office is where all official communications and notices are sent.
Objective Clause: This clause delineates the main objectives for which the company is formed. It's important to define these objectives clearly, as the company cannot undertake activities beyond those mentioned in this clause.
www.seribangash.com
Liability Clause: It outlines the extent of liability of the company's members. In the case of companies limited by shares, the liability of members is limited to the amount unpaid on their shares. For companies limited by guarantee, members' liability is limited to the amount they undertake to contribute if the company is wound up.
https://seribangash.com/promotors-is-person-conceived-formation-company/
Capital Clause: This clause specifies the authorized capital of the company, i.e., the maximum amount of share capital the company is authorized to issue. It also mentions the division of this capital into shares and their respective nominal value.
Association Clause: It simply states that the subscribers wish to form a company and agree to become members of it, in accordance with the terms of the MOA.
Importance of Memorandum of Association:
Legal Requirement: The MOA is a legal requirement for the formation of a company. It must be filed with the Registrar of Companies during the incorporation process.
Constitutional Document: It serves as the company's constitutional document, defining its scope, powers, and limitations.
Protection of Members: It protects the interests of the company's members by clearly defining the objectives and limiting their liability.
External Communication: It provides clarity to external parties, such as investors, creditors, and regulatory authorities, regarding the company's objectives and powers.
https://seribangash.com/difference-public-and-private-company-law/
Binding Authority: The company and its members are bound by the provisions of the MOA. Any action taken beyond its scope may be considered ultra vires (beyond the powers) of the company and therefore void.
Amendment of MOA:
While the MOA lays down the company's fundamental principles, it is not entirely immutable. It can be amended, but only under specific circumstances and in compliance with legal procedures. Amendments typically require shareholder
Personal Brand Statement:
As an Army veteran dedicated to lifelong learning, I bring a disciplined, strategic mindset to my pursuits. I am constantly expanding my knowledge to innovate and lead effectively. My journey is driven by a commitment to excellence, and to make a meaningful impact in the world.
The world of search engine optimization (SEO) is buzzing with discussions after Google confirmed that around 2,500 leaked internal documents related to its Search feature are indeed authentic. The revelation has sparked significant concerns within the SEO community. The leaked documents were initially reported by SEO experts Rand Fishkin and Mike King, igniting widespread analysis and discourse. For More Info:- https://news.arihantwebtech.com/search-disrupted-googles-leaked-documents-rock-the-seo-world/
As a business owner in Delaware, staying on top of your tax obligations is paramount, especially with the annual deadline for Delaware Franchise Tax looming on March 1. One such obligation is the annual Delaware Franchise Tax, which serves as a crucial requirement for maintaining your company’s legal standing within the state. While the prospect of handling tax matters may seem daunting, rest assured that the process can be straightforward with the right guidance. In this comprehensive guide, we’ll walk you through the steps of filing your Delaware Franchise Tax and provide insights to help you navigate the process effectively.
Business Valuation Principles for EntrepreneursBen Wann
This insightful presentation is designed to equip entrepreneurs with the essential knowledge and tools needed to accurately value their businesses. Understanding business valuation is crucial for making informed decisions, whether you're seeking investment, planning to sell, or simply want to gauge your company's worth.
3. • Background and Motivation
• Big Data DeNinition and Related Field
• Understanding Pattern
• Data Analytics / Machine Learning Fundamental (Prediction and
Recommendation)
• Social Media Analytics (by Case Study)
• Conclusion
• Working on Your Computer (Machine Learning Practice)
Agenda
11. Cheap Change Everything
efficient economy
new value proposition
• cutting through the BIG DATA hype
• cheap means everywhere
• cheap creates value
• from cheap to strategy
complex
human behaviour
market uncertainty
business
sustainability
disruptive economic
coopetitive, cooperative,
competitive
business ecosystem
/ platform
programmable economy
event driven
API economy
toward large-scale and massive
socio-economic impact
Industry 4.0
13. Big Data DeNinition
•a term => describe extremely large amounts of structured and
unstructured data
•the activity => capture / storage / processing / sharing / reporting of
data => beyond the ability of legacy software tools and hardware
infrastructure
•related to many “science” branch => data analytics, data science,
machine learning, artificial intelligence, IoT, and many more
•the application => on many field => efficient, cost-effective, faster &
accurate decision making
Gigabyte 109 = 1.000.000.000
Terabyte 1012 = 1.000.000.000.000
Petabyte
Exabyte
1015 = 1.000.000.000.000.000
Exabyte 1018 = 1.000.000.000.000.000.000
Zetabyte 1021 = 1.000.000.000.000.000.000.000
1990 2010 Hadoop
store 1400 MB store 1TB 100 drives
working at the
same time can
read 1TB data in
2 minutes
transfer speed 4.5 MB/s transfer speed 100 MB/s
read drive ~ 5 minutes read drive ~ 3 hours
15. DATA ANALYTICS
-the discovery, interpretation, and communication of meaningful patterns in data (wikipedia)
-the process to uncover hidden patterns, unknown correlation, and other useful information that can help organisations make
more informed business decision
SOURCE
review, opinion,
historical data,
conversation,
network friendship,
CCTV, Vlog,
location tagging,
etc
BIG DATA
large, fast, complex
the 5V’s data
DATA SCIENCE
the science to extract
knowledge / pattern from data
SOCIAL COMPUTING
quantification of human / social
behaviour
INSIGHT
market segmentation, risk analytics
information dissemination,
recommended investment, fraud
detection, personalised adv, customer
acquisition and retention, purchase
behaviour, early detection event,
brand awareness, etc
opportunity activity
methodology
benefit
application
Big Data Related Terms (Use Case)
16. Data Analytics
• The discovery, interpretation, and communication of meaningful patterns in data (wikipedia)
• The process to uncover hidden patterns, unknown correlation, and other useful information that
can help organisations make more informed business decision predictive, descriptive, diagnostic,
prescriptive.
17. Predictive Analytics
• study the past if you want to study the future (confucius)
• Predictive Analytics is the art of building and using models that make predictions
based on patterns extracted from historical data. Predictive analytics applications
include: price predictions, dosage predictions, risk assesment, propensity/likelihood
modelling, diagnosis, document classifications
• Predictive is the assignment of a value to any unknown variable.
• A model is trained to make predictions based on a set of historical examples. (we use
Machine Learning)
21. CRISP-DM
CRISP-DM -> Cross -Industry Standard Process for Data Mining is an open standard process model that
describes common approaches used by data mining experts. It is the most widely-used analytics model.[2]
22. Structure Data Type
Column Value
Pa+ent Andry Alamsyah
Date of Birth 12/07/1995
Date Admi?ed 02/03/2019
“The patient came in complaining
of chest pain, shortness of breath,
and lingering headaches.. Smokes
2 packs a day.. Family history of
heart disease.. Has been
experiencing similar symptoms for
the past 12 hours…”
High Degree of
Organiza+on, such as a
rela+onal database
Informa+on that is
difficult to organise using
tradi+onal mechanisms
VS
Structured Unstructured
32. How Can (Big) Data Analytics Helps?
by describing the phenomenon,
by predicting the value,
by estimating the future outcome,
by optimising the resources and the
decision,
by simulating all the possible scenarios ..
34. • Machine learning is defined as an automated process that extracts
patterns from data to build the models used in predictive analytics
applications.
• A branch of artificial intelligence, concerned with the design and
development of algorithms that allow computers to evolve behaviours
based on empirical data.
Machine Learning
35. Machine Learning
Machine Learning is an idea to learn from
examples and experience, without being
explicitly programmed.
Instead of writing code, we feed data to the
generic algorithm, and it builds logic based
on the data given.
Computer Output
Program
Data
• Traditional Programming
Computer Program
Output
Data
• Machine Learning
36. Machine Learning
Machine learning (ML) is the science of
getting computers to act without being
explicitly programmed. ML has given us self-
driving cars, practical speech recognition,
effective web search, and a vastly improved
understanding of the human genome. ML is
pervasive today, we probably use it dozens of
times a day without knowing it. It is the best
way to make progress towards human-level
AI. (standford/coursera)
ML is a type of artiNicial intelligence (AI)
that provides computers with the ability to
l e a r n w i t h o u t b e i n g e x p l i c i t l y
p r o g r a m m e d . M L f o c u s e s o n t h e
development of computer programs that can
teach themselves to grow and change when
exposed to new data. (whatis.com)
41. •It is based on a labeled training set.
•The class of each piece of data in
training set is known.
•Class labels are pre-determined
and provided in the training phase.
Supervised Learning
A
B
A
B
A
B
e Class
l Class
l Class
l Class
e Class
e Class
“What is the class of this data point?”
Task performed : classification, pattern recognition
47. Unsupervised Learning
Problems :
• Clustering
• Association Rules
• Pattern Mining
• It is adopted as a more general term than frequent pattern mining or
association mining
• Outlier Detection
• It is the process of Ninding data which have very different behaviour
from the expectation (outliers or anomalies)
50. Background :
• How to learn a new skill
• Learning and intelligence
• Interaction with environment
• Goal-oriented learning
• Agent – Environment interactions
• Activities
- What to do
- How to map situations to actions
- Process positive and negative rewards
Reinforcement Learning
Reinforcement learning (RL) is an area of machine learning concerned with
how software agents ought to take actions in an environment so as to maximise
some notion of cumulative reward.
Basic reinforcement is modeled as a Markov decision process, and are often stochastic process
53. Data Preparation (CRISP-DM)
Data Preprocessing
• Measures for data quality: A multidimensional view
• Accuracy: correct or wrong, accurate or not
• Completeness: not recorded, unavailable, …
• Consistency: some modified but some not, …
• Timeliness: timely update?
• Believability: how trustable the data are correct?
• Interpretability: how easily the data can be understood?
54. 1.Data Cleaning
a. Fill in missing values
b. Smooth noisy data
c. Iden+fy or remove outliers
d. Resolve inconsistencies
2.Data Reduc6on
a. Dimensionality reduc+on
b. Numerosity reduc+on
c. Data compression
3.Data Transforma6on and Data Discre6sa6on
a. Normalisa+on
b. Concept hierarchy genera+on
4.Data integra6on
a. Integra+on of mul+ple databases or files
Data Preprocessing Task
55. Common Data
Analytics Rules
Tasks Descrip6on Algorithms Examples
Classification Predict if data points belongs to one
of the predefined classes. Prediction
based on learning from known
dataset.
Decision tree, neural
network
Bucketing new customers into
one of the known customer
groups
Regression Predict the numeric target label of a
data point. Prediction based on
learning from known dataset.
Linear regression,
logistic regression
Estimating insurance premium
Clustering Identify natural clusters within the data
set based on inherit properties within
data set.
K-Means, density
based clustering
Finding customer segments in a
company based on transaction
and call data.
Association
Rules
Identify relationships within an item
set based on transaction data
FP-Growth algorithm,
Apriori
Find cross-selling opportunities
for a retailer based on
transaction purchase history
Anomaly
Detection
Predict if a data point is an outlier
compared to other data point in the
dataset
Distance based, density
based, Local Outlier
Factor (LOF)
Fraud transaction detection in
credit cards
56. Estimation
Customer Order Number of Traffic Light Distance Travel Time
1 3 3 3 16
2 1 7 4 20
3 2 4 6 18
4 4 6 8 36
...
1000 2 4 2 12
Label
Learning Model using
Estimation Methods (Linear
Regression)
Travel Time = 0.48O + 0.23TL + 0.5D
Knowledge
Pizza Delivery Time
58. ClassiNication
NIM Gender Nilai UN Asal Sekolah IPS1 IPS2 IPS3 IPS 4 ... Lulus Tepat
10001 L 28 SMAN 2 3.3 3.6 2.89 2.9 Ya
10002 P 27 SMA DK 4.0 3.2 3.8 3.7 Tidak
10003 P 24 SMAN 1 2.7 3.4 4.0 3.5 Tidak
10004 L 26.4 SMAN 3 3.2 2.7 3.6 3.4 Ya
...
...
11000 L 23.4 SMAN 5 3.3 2.8 3.1 3.2 Ya
label
learning using C4.5
classification methods
59. input : golf playing recommendation
output (rules) :
If outlook = sunny and humidity = high then play = no
If outlook = rainy and windy = true then play = no
If outlook = overcast then play = yes
If humidity = normal then play = yes
If none of the above then play = yes
output (tree) :
ClassiNication
68. learning and evaluation process confusion matrix
PREDICTED CLASS
ACTUAL
CLASS
Class=Yes Class=No
Class=Yes a b
Class=No c d
a: TP (true positive)
b: FN (false negative)
c: FP (false positive)
d: TN (true negative)
FNFPTNTP
TNTP
dcba
da
+++
+
=
+++
+
=Accuracy
cba
a
pr
rp
ba
a
ca
a
++
=
+
=
+
=
+
=
2
22
(F)measure-F
(r)Recall
(p)Precision
Model Evaluation
evaluation metric
77. First Topic
Identified
Topic Modelling
•Topic modelling is a type of statistical modelling for discovering the abstract
“topics” that occur in a collection of documents..
•LDA (Latent Dirichlet Allocation) is the most popular (and typically most effective)
topic modelling technique
78. TOP BRAND ALTERNATIVE MEASUREMENT BASED ON
CONSUMER NETWORK ACTIVITY
Abstract:
In Business Intelligence effort, the legacy methodology to
measure product brand awareness use technique such as
surveys, interviews, and questionnaires. This methodology
requires expensive effort to collect data from respondent and
takes considerably time to accomplish. The availability of Big
Data in the form of social media interaction can benefit us.
The conversation and user generated content from social
media certainly can be used to measure brand awareness
through consumer activity. We use Social Network Analysis
methodology to measure the dynamic and evolution of brand
conversations in social media. By comparing the network
properties, we propose new alternative measurement
methods of product brand awareness. Our proposed
methodology is better adapted to large-scale conversational
data in social media.This measurement will also enhance the
current methodology by viewing consumer opinions as a
whole network and not as separated individual. This study
conducted via social networking conversations on Twitter using
two industry case studies, they are mobile operators and
mobile phone brands in Indonesia
mobile phone rank
mobile operator rank
79. A COMPARISON OF INDONESIA E-COMMERCE SENTIMENT ANALYSIS FOR
MARKETING INTELLIGENCE EFFORT
CASE STUDY : BUKALAPAK, TOKOPEDIA, ELEVENIA
Abstract:The rapid growth of e-commerce market in Indonesia, making various e-commerce companies
appear and there has been high competition among them. Marketing intelligence is important activity to
measure competitive position. One element of marketing intelligence is to assess customer satisfaction.
Many Indonesian customers express their sense of satisfaction or dissatisfaction towards the company
through social media. Hence, using social media data, it provides a new practical way to measure
marketing intelligent effort.This research performs sentiment analysis using naive bayes classifier
classification method withTF-IDF weighting.We compare the sentiments towards of top-3 e-commerce
sites visited companies, they are Bukalapak,Tokopedia and Elevenia.We useTwitter data for sentiment
analysis because it's faster, cheaper and easier from both the customer and the researcher side.The
purpose of this research is to find out how to process the huge customer sentimentTwitter to become
useful information for the e-commerce company, and which of those top-3 e-commerce companies has
the highest level of customer satisfaction. From the experiment results, it shows the method can be used
to classify customer sentiments in social mediaTwitter automatically and Elevenia is the highest e-
commerce with customer satisfaction
COMPARABLE RESULT
AMONG THREE CASE STUDY
80. NETWORK TEXT ANALYSIS TO SUMMARISE ONLINE CONVERSATIONS FOR
MARKETING INTELLIGENCE EFFORTS IN TELECOMMUNICATION
INDUSTRY
Abstract - Market tight competition put pressure the companies to employ a new and faster way to support their
marketing intelligence effort.The need of marketing intelligence includes gathering and analysing data for confident
decision making about market and its competition.Today, the abundant large scale data from online social network
services has made possible to extract valuable information such as user opinions and sentiment from the
conversations in the market.As the competition arise, new challenge emerged, which include faster data
summarisation.The common practice of summarise contents is using wordcloud or weighted list of appearance words.
This approach is lack of sense and contextual relations between words in questions, because the words has no
connection with other words that might construct an important phrase.With the help of graph formulation, we
propose a methodology of network text analysis to summarise large conversation in online social network services.
This proposed methodology capture complex relations between words, while still maintain fast summarisation. In this
paper, we compare three major telecommunication provider in Indonesia, which is Telkomsel, XL and Indosat.The
conversations about those brands in online social network services Twitter is collected, Network text about each
brands are constructed and analysed.
81. NETWORK MARKET ANALYSIS USING LARGE SCALE SOCIAL
NETWORK CONVERSATION OF INDONESIA FAST FOOD INDUSTRY
Abstract - The high competitiveness of the Indonesia Fast Food market has forced the industry to find the new way to understand market behaviour. The new challenge
should include faster data collection and analytical process, preferably time delivery needed close to real-time. The common practice of gathering market data using
questionnaires and interviews are considered expensive and time-consuming process compared to mining online conversation with brand community respected. With the
availability of large-scale data from online social network services (oSNS), we can extract valuable information represent dynamic behaviour of the market. Many brands have
their presence in oSNS as a part of their customer relationship management (CRM) effort. The social interactions formed in oSNS can be modeled using Social Network
Analysis (SNA) methodology. In this paper, we compare two brand communities of head to head competitive product in the fast food industry, they are McDonald’s and Burger
King. The SNA model constructs large-scale network, its size, reaching close to a million of nodes and edges. The result will give us insight about what is important in
understanding the dynamic market beside the market size represented by the community conversations.
82. SOCIAL NETWORK AND SENTIMENT ANALYSIS FOR SOCIAL CUSTOMER
RELATIONSHIP MANAGEMENT IN INDONESIA BANKING SECTOR
SCRM Network
BCA BNI MANDIRI
Abstract - The increasing number of social media users affects both individual and corporation user. Banking sector, for example, use social media to support
their Social Customer Relationship Management activity. We investigate the dynamics and evolution of conversation network between bank customer using
Social Network Analysis methodology. Measurement is conducted by calculating its network properties to see the characteristic and how active the network is.
Customers talking about banks’ services can also express their opinion on social media. Therefore we perform sentiment analysis to classify customer’s opinion
into positive, negative and neutral class. This research was performed on Twitter’s conversation about Bank Mandiri, Bank Central Asia (BCA) and Bank
Negara Indonesia (BNI). The result of this research is beneficial for business intelligence purpose to support decision making.
83. MEASURING MARKETING COMMUNICATIONS MIX EFFORT USING
MAGNITUDE OF INFLUENCE AND INFLUENCE RANK METRIC
Abstract: In the context of modern marke:ng, Twi>er is considered as a communica:on pla@orm to spread informa:on. Many companies create and acquire several Twi>er
accounts to support and perform varie:es of marke:ng mix ac:vi:es. Ini:ally, each accounts used to capture specific market profile. Together, the accounts create network of
informa:on that provide consumer to the informa:on they need depends on their contextual u:lisa:on. From many accounts available, we have the fundamental ques:on on
how to measure influence of each account in the market based not only their rela:ons, but also the effects of their pos:ngs. Magnitude of Influence (MOI) metric is adapted
together with Influence Rank (IR) measurement of accounts in their social network neighbourhood. We use social network analysis approach to analyse 65 accounts in the social
network of an Indonesian mobile phone network operator, Telkomsel which involved in marke:ng communica:ons mix ac:vi:es through series of related tweets. Using social
network provide the idea of the ac:vity in building and maintaining rela:onships with the target audience. This paper shows the results of the most poten:al accounts based on
the network structure and engagement. Based on this research, the more number of followers one account has, the more responsibility it has to generate the interac:on from
their followers in order to achieve the expected effec:veness. The focus of this paper is to determine the most poten:al accounts in the applica:on of marke:ng communica:ons
mix in Twi>er.
ratio of affection
magnitude of influence
LCRT function
influence rank (based on pagerank)
84. MAPPING ONLINE TRANSPORTATION SERVICE QUALITY AND MULTI-CLASS
CLASSIFICATION PROBLEM SOLVING PRIORITIES
CASE STUDY : GOJEK AND GRAB
Abstract. Online transportation service is known for its accessibility, transparency, and tariff affordability. These points make online transportation have
advantages over the existing conventional transportation service. Online transportation service is an example of disruptive technology that change the
relationship between customers and companies. In Indonesia, there are high competition among online transportation provider, hence the companies must
maintain and monitor their service level. To understand their position, we apply both sentiment analysis and multiclass classification to understand customer
opinions. From negative sentiments, we can identify problems and establish problem-solving priorities. As a case study, we use the most popular online
transportation provider in Indonesia: Gojek and Grab. Since many customers are actively give compliment and complain about company’s service level on
Twitter, therefore we collect 61,721 tweets in Bahasa during one month observations. We apply Naive Bayes and Support Vector Machine methods to see which
model perform best for our data. The result reveal Gojek has better service quality with 19.76% positive and 80.23% negative sentiments than Grab with 9.2%
positive and 90.8% negative. The Gojek highest problem-solving priority is regarding application problems, while Grab is about unusable promos. The overall
result shows general problems of both case study are related to accessibility dimension which indicate lack of capability to provide good digital access to the end
users.
85. HYBRID SENTIMENT AND NETWORK ANALYSIS OF SOCIAL
OPINION POLARIZATION
Abstract: The rapid growth of social media and user generated contents (UGC)
has provided a rich source of poten:ally relevant data. The problems arise on
how to summarise those data to understand and transforming it into
informa:on. Twi>er as one of the most popular social networking and micro-
blogging service can be analysed in terms of content produced with sen:ment
analysis. On the other hand, some types of networks can also be constructed to
analyse the social network structure and network proper:es. This research
intended to combine those content and structural approaches into hybrid
approach for iden:fies social opinion polarisa:on, this is in the form of
conversa:on network. Sen:ment analysis used to determine public sen:ment,
and social network analysis used to analyse the structure of the network,
detec:ng communi:es and influen:al actors in the network. Using this hybrid
approach, we have comprehensive understanding about social opinion
polarisa:on. As case study, we present real social opinion polarisa:on about
reclama:on issue in Indonesia.
86. DYNAMIC LARGE SCALE DATA ON TWITTER USING
SENTIMENT ANALYSIS AND TOPIC MODELLING
Case Study: Uber
Digital flows now exert a larger impact, the world is now more connected than
ever, the amount of cross-border bandwidth that used has grown 45 times larger
since 2005. With the massive amount of data spreading in the net, including
social media, speed is one most essential factor in business. companies can
take advantage of social media as a source to analyse and extract the
customer’s opinion, and therefore the company can have quick response
towards the condition.
The main purpose of this research is content analysis, to obtain the goal, we
need to extract the information as well as summarise the topic inside it.
However, in order to analyse the content quickly, there are varies choice of tools
with its specific output that creates challenges in the process. We use Naïve
Bayes Sentiment Analysis based on time-series, specifically on daily basis and
topic modeling based on Latent Dirichlet Allocation (LDA) to evaluate the
sentiment of the topic as well as the model of the topics discussed.
The purpose of this research is to help both companies and individuals to map
the public opinion towards certain topic by analyzing the sentiment of the text
and create a topic model. Therefore, a real-time information for determining the
consumer opinion become a crucial part. Twitter can serve the purpose as one
source of real-time information from user-generated content. We pick Uber as
the case study, viewed as one of the most favored transportation methods in
most part of the world. Data collection period is from 10th February 2017 until
28th February 2017 with 1.048.576 tweets collected.
87. ANALYSING EMPLOYEE VOICE USING REAL-TIME FEEDBACK
Abstract People nowadays tend to use social media as a platform to share their
reviews, emotions, and opinions, including about their jobs. Thus, a lot of data is
available on the web. Therefore, a rapid response is needed to analyse and interpret
the data. Unfortunately, many organisations still use annual surveys to assess
satisfaction, engagement, and culture in the workplace. Compared to other
conventional datasets such as company survey and questionnaire, decision-makers
could make decision effectively and efficiently by using the interpreted data. This
may be done with the help of sentiment analysis method.
In this research, we classify the feedback based on its category and sentiment.
Several classification algorithms are used in opinion mining, two of them are Naive
Bayes Classifier (NBC) and Support Vector Machine (SVM). This paper aims to
classify feedback based on sentiments using NBC and SVM.
*ICST, 2018
88. MONTE CARLO SIMULATION AND CLUSTERING FOR
CUSTOMER SEGMENTATION IN BUSINESS ORGANISATION
Abstract: U:lising data for segmenta:on analysis can bring a streamlined way to get poten:al insight as of decision making support in a business organisa:on. Using
appropriate data analy:cal technique help the organisa:ons in profiling their customer segments accurately. The result brings an effec:ve marke:ng strategy. However, there
are :mes in doing data analy:c, the organisa:on needs another variable of data where the value is unavailable, for example: customer’s income data which mostly hard to
collect. By using Monte Carlo simula:on, the value of customer’s income can be generated and then compared with customer spending to construct customer segmenta:on
model. An unsupervised learning for customer segmenta:on model using K-Means clustering enables us to see the grouping pa>erns of customer’s income towards their
spending. Clusters of the dataset might be interpreted as a group of customers that having a similar character. This paper shows us how to generate customer’s income data
and create data cluster to op:mising customer poten:al by u:lising data. Furthermore, the result brings us insight into which group off the customer might unserved properly
considering their average income with their spending behaviour.
89. MAPPING ORGANISATION KNOWLEDGE NETWORK AND
SOCIAL MEDIA BASED REPUTATION MANAGEMENT
Abstract—Knowledge management and reputation are important aspects in an
organization, especially in ICT industry. Controlling knowledge management and
modeling personal reputation through social media is essentials for the organization
because we can see how employee build their relationship around their peer
networks or clients virtually and how knowledge network can support organization
performance. The purpose of this research is to map knowledge network and
reputation formulation in order to fully understand how knowledge flow in an
organization and whether employee reputation have higher degree of influence in
organization knowledge network. We particularly develop formulas to measure
knowledge network and personal reputation based on their social media activities.
As case study, we pick an Indonesian ICT company which actively build their
business around their employee peer knowledge outside the company. For
knowledge network, we perform data collection by conducting interviews. For
reputation management, we crawl data from several popular social media. We base
our work on Social Network Analysis methodology. The result shows that employees
knowledge is directly proportional with their reputation, but there are different
reputations level on different social media observed in this research.
reputation formula for twitter, instagram and linkedin
90. PREDICTION MODELS BASED ON FLIGHT TICKETS AND HOTEL ROOMS DATA
SALES FOR RECOMMENDATION SYSTEM IN ONLINE TRAVELAGENT BUSINESS
Abstract - Indonesia as one of the favorite vacation destinations of domestic and foreign travelers made the value of investment in the tourism industry continued to
grow significantly. This was created more Online Travel Agent business in recent years. However, it made a lot of business travel and Umrah travel in Indonesia is
threatened with bankruptcy, after the online travel business activity is rampant in conventional business market ticket sales and travel tours. The research case
study is different from the Online Travel Agent business in general, because it worked in real-time analytic using flight tickets and hotel rooms sales data to create
prediction or recommendation model. Data mining, extraction of hidden predictive information from large databases, was a powerful technique with great potential
to help companies focus on the most important information in their data warehouse. By using classification method in data mining, the objectives of this paper is to
create predictive models from flight tickets and hotel rooms sales data using the decision tree classification approach. The result of this paper is beneficial for
business that can be used as basic algorithm for programming in Online Travel Agent recommendation feature.
91. EFFECTIVE KNOWLEDGE MANAGEMENT USING
BIG DATAAND SOCIAL NETWORK ANALYSIS
Vizualisa+on of hierarchical structure organiza+on and knowledge
flow of informal organiza+on
Abstract: Knowledge management consists of iden+fying, crea+ng, represen+ng, distribu+ng, and
enabling adop+on of insights and experiences in an organiza+on. One approach of modeling knowledge
management is using network model. Big Data is one of important ICT technological roadmap, which
main func+on is modelling behaviour and helping organiza+on decision support. Social Network
Analysis is a micro version of Big Data where we can model and establish social network quan+fica+on.
In this paper we will show how Social Network Analysis can help organiza+on applying Knowledge
Management strategies and prac+ces by experiment using real-world large dataset contains 360000+
email exchanges between 36000+ employees inside in an organiza+on
business case resolved using SNA methodology
map of full network emaile xchange between employes in Enron
92. INDONESIA INFRASTRUCTURE AND CONSUMER STOCK PORTFOLIO
PREDICTION USING ARTIFICIAL NEURAL NETWORK BACKPROPAGATION
*ICOICT, 2017
Abstract: Ar:ficial Neural Network (ANN) method is increasingly popular to build predic:ve
model that generated small error predic:on. To have a good model, ANN needs large dataset as an
input. ANN backpropaga:on is a gradient decrease method to minimize the output error squared.
Stock price movements are suitable with ANN requirement : it is a large data set because stock price
is recorded up to every seconds, usually called high frequency data. The implementa:onof stock
price predic:on using ANN approach is quite new. The predic:ve model help investor in building
stock por@olio and their decision making process. Buying some stocks in por@olio decrease
diversified risk and increases the chance of higherreturn.In this paper, we show how to generate
predic:on model using ar:ficial neural network backpropaga:on of stock price and forming
por@olio with predicted price that bring predic:on of the por@olio with the smallest error. The data
set we use is historical stock price data from ten different company stocks of infrastructure and
consumer sector Indonesia Stock Exchage. The results is for lower risk condi:on, ANN predic:ve
model gives higher expected return than the return from real condi:on, while for higher risk, the
return from the real condi:on is higherthan the ANN predic:ve model.
93. THE DYNAMIC OF BANKING NETWORK TOPOLOGY
Case Study: Indonesian Presidential Election Event
ABSTRACT - Information and communication technologies have brought major changes in data storage and processing. Various types and high volume of
data has been digitalised and support mining-based data processing to provide knowledge in a modern and efficient way. Banking transaction data has been
stored digitally and suitable for the mining process especially in network science model.Understanding transaction system risk requires fundamental study on
payments flow and bank behaviour in various situations. Lehman Brother’s failure spread contagion impact in a short time indicates that financial markets
have interdependent properties and connected to each other in a large network. Thus, overall system network approach becomes more important than a single
bank. Political conditions greatly affect economic stability including the banking and financial sectors. Presidential election is a major political event for a
nation. This affected on community sentiment and financial market. However, the linkage between political events and topological changes is poorly
understood.This research presents an insight of the event driven dynamic network topology with banking transaction as a case study. We search for the
banking transaction network topology dynamic driven by 2014 Indonesian presidential election event. We discover that banks are more engaged to others in
larger value 3 days before the end of campaign period and less engaged to others in smaller value in the end of campaign period. Unique transaction activity
between banks remain stable with low declination in the end of campaign period. This scenario provides the possibility to learn the banking transaction
pattern and support the financial system stability supervision.
94. A COMPARATIVE STUDY OF EMPLOYEE CHURN PREDICTION
MODEL
Abstract - Churn phenomenon commonly occurs in customer loyalty towards
brand product or services. They becomes critical issue that any industry
would make best effort to avoid. Churn problem may arise within the
organisation, called employee churn. Employee churn creates myriad and
adverse effects to the organisation as it correlates with unfairly workload
distribution, great deal of money lost and also extra time needed to find a
replace, which may result in the rise of customer dissatisfaction rate. The
purpose of this study is to find the best model to predict employee churn. A
successful prediction model for employee churn is significantly needed in
order to avert various negative impacts for the organisation. There are three
popular classification models for prediction, namely naïve bayes, decision
tree, and random forest. This study compares performance of the
aforementioned models by using Human Resource Information System
(HRIS) from one of Indonesia’s renowned telecommunication company. The
data collected for the study spans for 2 years period, started from 2015 until
2017. The findings from the study suggest that the best classification model is
random forest due to its immense accuracy of 97.5%. The second-best
method is naïve bayes with 96.6%, and the lowest accuracy of classification
model is decision tree with 88.7%. The study concludes that the most reliable
and accurate classification model to predict employee churn is random forest
96. STATISTICS DATA ANALYTICS
Confirmative Explorative
Small Data Set Larga Data Set
Small Number of Variable Large Number of Variable
Deductive (no predictions) Inductive
Numeric Data Numeric and Non-Numeric Data
Clean Data Data Cleaning
Complimentary Methods
97. • big data provide granular, micro data
• big data provide relatively fast and cheap process
• research opportunity on data science methods, implementation and evaluation
maturity
• data scientist helps big data initiatives towards future and sustainable economic
activities
• uncovering hidden truths, democratisation by data, are primary objective of data
scientist
• hard to Nind data scientist talent
• high cost to maintain data scientist talent ..
• big data often populations study, so no sampling error => methods familiarity
• beneNit > data quality + costs + security
• ML result credibility (different algorithm, different conclusion)
CHALLENGES
Opportunities
Challenges