Data science involves extracting meaningful insights from raw data through scientific methods and algorithms. It is an interdisciplinary field that focuses on analyzing large datasets using skills from computer science, mathematics, and statistics. Python is a commonly used programming language for data science due to its powerful libraries for tasks like data analysis, machine learning, and visualization. Key Python libraries include NumPy, Pandas, Matplotlib, Scikit-learn, and SciPy. The document then discusses tools, applications, and basic concepts in data science and Python.
If you’re learning data science, you’re probably on the lookout for cool data science projects. Look no further! We have a wide variety of guided projects that’ll get you working with real data in real-world scenarios while also helping you learn and apply new data science skills.
The projects in the list below are also designed to help you get a job! Each project was designed by a data scientist on our content team, and they’re representative examples of the real projects working data analysts and data scientists do every day. They’re designed to guide you through the process while also challenging your skills, and they’re open-ended so that you can put your own twist on each project and use it for your data science portfolio.
You can complete each project right in your browser, or you can download the data set to your computer and work locally! If you work on our site, you’ll also be able to download your code at any time so that you can continue locally, or upload your project to GitHub.
The sky is the limit here and what you decide to look into further is completely up to you and your imagination!
1. Learning by Doing
Learning by doing refers to a theory of education expounded by American philosopher John Dewey. It is a hands-on approach to learning, meaning students must interact with their environment in order to adapt and learn. This way of learning sharpen your current skills and knowledge and also helps in gaining new skills that could only be acquired by doing.
Car driving is a perfect example of this, you can read as much as you would like about the theory of driving and the rules, and this is very important, and the more you understand the theory the better you get in the practical part. But you will only be able to drive better by applying this knowledge on the real road. In addition to that, there are some skills and knowledge that will be only gained by actually driving.
Data science is the same as driving. It is very important to have solid theoretical knowledge and to regularly increase them to be able to get better while working on a project. However, you should always apply this theoretical knowledge to projects. By this, you will deepen your understanding of these concepts and Knowledge, have a better point of view of how they work in a real-life, and will also show others that you have strong theoretical knowledge and are able to put them into practice.
There are different types of guided projects. One of them is a guided project for
There are a lot of benefits for it:
It removes the barriers between you and doing projects
Saves you much time thinking about the project and preparing the data.
It allows you to apply the theoretical knowledge without getting distracted by obstacles.
Practical tips that can save your effort and time in the future.
#datasciencefree
#rohitdubey
#teachtechtoe
#linkedin.com/in/therohitdubey
Data science involves extracting insights from vast amounts of data using scientific methods and algorithms. It includes concepts like statistics, visualization, machine learning, and deep learning. The data science process includes steps like data discovery, preparation, modeling, and operationalizing results. Important roles include data scientist, engineer, analyst, and statistician. Tools include R, SQL, Python, and SAS. Applications are in internet search, recommendations, image recognition, gaming, and price comparison. The main challenge is obtaining a high variety of information and data for accurate analysis.
Data science is an interdisciplinary field (it consists of more than one branch of study) that uses statistics, computer science, and machine learning algorithms to gain insights from structured and unstructured data. CETPA INFOTECH, an ISO 9001- 2008 certified training company provides Data Science Training Course for students and professionals who want to make their mark in the world of Data Science. Cetpa is the best data science training institute in Delhi NCR.
Introduction to Data Science: Unveiling Insights Hidden in Datahemayadav41
Embark on a journey into the fascinating field of Data Science and uncover the valuable insights concealed within vast datasets. In this article, we explore the fundamental concepts of Data Science and its applications. Discover how a Data science Training Institute in Jaipur, Lucknow, Indore, Mumbai, Delhi, Noida, Gurgaon and other cities in India can equip you with the knowledge and skills to analyze, interpret, and extract meaningful information from data. Explore topics such as data preprocessing, statistical analysis, machine learning, and data visualization. Join us on this enlightening exploration of the world of Data Science.
Data Science: Unlocking Insights and Transforming IndustriesUncodemy
Data science is an interdisciplinary field that encompasses a range of techniques, algorithms, and tools to extract valuable insights and knowledge from data.
Huge amount of data is being collected everywhere - when we browse the web, go to the doctor's clinic, visit the supermarket, tweet or watch a movie. This plethora of data is dealt under a new realm called Data Science. Data Science is now recognized as a highly-critical growing area with impact across many sectors including science, government, finance, health care, social networks, manufacturing, advertising, retail,
and others. This colloquium will try to provide an overview as well as clarify bits and bats about this emerging field.
Data Science Introduction: Concepts, lifecycle, applications.pptxsumitkumar600840
This document provides an introduction to the subject of data visualization using R programming and Power BI. It discusses key concepts in data science including the data science lifecycle, components of data science like statistics and machine learning, and applications of data science such as image recognition. The document also outlines some advantages and disadvantages of using data science.
Data Analytics in Industry Verticals, Data Analytics Lifecycle, Challenges of...Sahilakhurana
Banking and securities
Challenges
Early warning for securities fraud and trade visibilities
Card fraud detection and audit trails
Enterprise credit risk reporting
Customer data transformation and analytics.
The Security Exchange commission (SEC) is using big data to monitor financial market activity by using network analytics and natural language processing. This helps to catch illegal trading activity in the financial markets.
The Data Analytics Lifecycle is designed specifically for Big Data problems and data science projects. The lifecycle has six phases, and project work can occur in several phases at once. For most phases in the lifecycle, the movement can be either forward or backward. This iterative depiction of the lifecycle is intended to more closely portray a real project, in which aspects of the project move forward and may return to earlier stages as new information is uncovered and team members learn more about various stages of the project. This enables participants to move iteratively through the process and drive toward operationalizing the project work.
Phase 1—Discovery: In Phase 1, the team learns the business domain, including relevant history such as whether the organization or business unit has attempted similar projects in the past from which they can learn. The team assesses the resources available to support the project in terms of people, technology, time, and data. Important activities in this phase include framing the business problem as an analytics challenge that can be addressed in subsequent phases and formulating initial hypotheses (IHs) to test and begin learning the data.
Phase 2—Data preparation: Phase 2 requires the presence of an analytic sandbox, in which the team can work with data and perform analytics for the duration of the project. The team needs to execute extract, load, and transform (ELT) or extract, transform and load (ETL) to get data into the sandbox. The ELT and ETL are sometimes abbreviated as ETLT. Data should be transformed in the ETLT process so the team can work with it and analyze it. In this phase, the team also needs to familiarize itself with the data thoroughly and take steps to condition the data.
INTRODUCTION TO DATA SCIENCE -CONCEPTS.pptxMadhumitha N
This ppt says the introduction to data science and all the basic concepts of data science like data mining and Eda and cycle of data science and analytics
Data Science. Business Analytics is the statistical study of business data to gain insights. Data science is the study of data using statistics, algorithms and technology. Uses mostly structured data. Uses both structured and unstructured data.
Understanding Data Science: Unveiling the Basics
What is Data Science?
Data science is an interdisciplinary field that combines techniques from statistics, mathematics, computer science, and domain knowledge to extract insights and knowledge from data. It involves collecting, processing, analyzing, and interpreting large and complex datasets to solve real-world problems.
Importance of Data Science
In today's data-driven world, organizations are inundated with data from various sources. Data science allows them to convert this raw data into actionable insights, enabling informed decision-making, improved efficiency, and innovation.
Intersection of Data Science, Statistics, and Computer Science
Data science borrows heavily from statistics and computer science. Statistical methods help in understanding data patterns, while computer science provides the tools to process and analyze large datasets efficiently.
Key Components of Data Science
Data Collection and Storage
The first step in data science is gathering relevant data from various sources. This data is then stored in databases or data warehouses for further processing.
Data Cleaning and Preprocessing
Raw data is often messy and inconsistent. Data cleaning involves removing errors, duplicates, and irrelevant information. Preprocessing includes transforming data into a usable format.
Exploratory Data Analysis (EDA)
EDA involves visualizing and summarizing data to uncover patterns, trends, and anomalies. It helps in forming hypotheses and guiding further analysis.
Machine Learning and Predictive Modeling
Machine learning algorithms are used to build predictive models from data. These models can make predictions and decisions based on new, unseen data.
Data Visualization
Visual representations of data, such as graphs and charts, help in understanding complex information quickly. Data visualization aids in conveying insights effectively.
The Data Science Process
Problem Definition
The data science process begins with understanding the problem you want to solve and defining clear objectives.
Data Collection and Understanding
Collect relevant data and understand its context. This step is crucial as the quality of the analysis depends on the quality of the data.
Data Preparation
Clean, preprocess, and transform the data into a suitable format for analysis. This step ensures that the data is accurate and ready for modeling.
Model Building
Select appropriate algorithms and build predictive models using machine learning techniques. This step involves training and fine-tuning the models.
Model Evaluation and Deployment
Evaluate the model's performance using metrics and test datasets. If the model performs well, deploy it for making predictions on new data.
Technologies Driving Data Science
Programming Languages
Languages like Python and R are widely used in data science due to their extensive libraries and versatility.
Machine Learning Libraries
Libraries like Scikit-Learn and TensorFlow prov
emerging expotenial technology Initially, Industrial revolution was regarded as alterations in the way. labourer works. * then, centralised on steam and mechanisation.
Data Science involves extracting insights from vast amounts of data using scientific methods and algorithms. It includes concepts like Statistics, Visualization, Machine Learning, and Deep Learning. The Data Science process goes through steps like Discovery, Preparation, Modeling, and Communication. Important roles include Data Scientist, Engineer, Analyst, and Statistician. Tools include R, SQL, Python, and SAS. Applications are in search, recommendations, recognition, gaming, and pricing. The main challenge is the variety of information and data required.
This document provides an overview of data science, big data, and the data preprocessing steps involved in data science projects. It defines data science as extracting meaningful insights from large, structured and unstructured data using scientific methods, technologies and algorithms. It also defines big data in terms of the volume, variety and velocity of data. The document outlines common data sources that generate big data and applications of big data such as in finance, healthcare, transportation and more. It concludes by describing the key steps in data preprocessing: data cleaning, transformation and reduction to prepare raw data for analysis.
Want to learn data analytics or just grab the information about data analytics and its future? https://coursedekho.com/data-analytics-courses-in-surat/
The significance of Data Science has impressively increased over recent years. The contemporary period is the intersection of data analytics with emerging technologies that involve artificial intelligence (AI), machine learning (MI), and automation. And these three things have an ocean of career opportunities. In this post, I am sharing with you some best Data Analytics Courses in Surat, with a detailed course curriculum and placements guarantee.
#education
#data
#DataAnalytics
#DataScience
#DataCourse
#AnalyticsCourses
#AnalyticsCourse
#DataScienceCourse
#DataScienceCourses
#CoursesInIndia
#DataJob
This document provides an introduction and overview of data science. It defines data science as the field that uses scientific processes and algorithms to extract knowledge and insights from data. It describes data scientists as applying machine learning to structure and unstructured data to build AI systems. The document outlines typical data science processes and discusses different types of data scientists, including those focused on humans and machines. It explains why data science is important for businesses to increase the value of their data and help with decisions, customers, and processes. Finally, it provides a demo of a data science application.
A brief introduction to DataScience with explaining of the concepts, algorithms, machine learning, supervised and unsupervised learning, clustering, statistics, data preprocessing, real-world applications etc.
It's part of a Data Science Corner Campaign where I will be discussing the fundamentals of DataScience, AIML, Statistics etc.
This document provides an overview of the key concepts in the syllabus for a course on data science and big data. It covers 5 units: 1) an introduction to data science and big data, 2) descriptive analytics using statistics, 3) predictive modeling and machine learning, 4) data analytical frameworks, and 5) data science using Python. Key topics include data types, analytics classifications, statistical analysis techniques, predictive models, Hadoop, NoSQL databases, and Python packages for data science. The goal is to equip students with the skills to work with large and diverse datasets using various data science tools and techniques.
Data Science for Beginners: A Step-by-Step IntroductionUncodemy
Data science is a dynamic and rapidly evolving field that has gained immense importance in recent years. It involves the extraction of meaningful insights and knowledge from large and complex datasets. If you are new to data science, this step-by-step introduction will provide you with a solid foundation and explain why pursuing a data science certification course.
Lecture-1-Introduction to Deep learning.pptxJayChauhan100
Introduction To Deep Learning.
This presentation covers everything about deep learning. You will be familier with all the main concepts used in deep learning.
Includes topics like difference between deep learning and machine learning, Feature engineering in detail, Deep learning frameworks , applications of deep learning etc.
This presentation will surely help you to know about the deep learning.
For queries contact on the given email id.
Email - chauhanjay657@gmail.com
This document provides an introduction to big data and data science from Amity Institute of Information Technology. It defines big data and data science, highlighting that big data is a subset of data science. The key differences between big data and data science are described. Examples of applications of big data in various domains like social media, healthcare, finance, ecommerce and education are outlined. Finally, the skills required to become a data scientist or big data specialist are summarized.
This document provides an overview of data science tools, techniques, and applications. It begins by defining data science and explaining why it is an important and in-demand field. Examples of applications in healthcare, marketing, and logistics are given. Common computational tools for data science like RapidMiner, WEKA, R, Python, and Rattle are described. Techniques like regression, classification, clustering, recommendation, association rules, outlier detection, and prediction are explained along with examples of how they are used. The advantages of using computational tools to analyze data are highlighted.
Transform your career with our Data Science course in Hyderabad. Master machine learning, Python, big data analysis, and data visualization. Our training and expert mentors prepare you for high-demand roles, making you a sought-after data scientist in Hyderabad's tech scene.
data science course in Hyderabad data science course in Hyderabadakhilamadupativibhin
Transform your career with our Data Science course in Hyderabad. Master machine learning, Python, big data analysis, and data visualization. Our training and expert mentors prepare you for high-demand roles, making you a sought-after data scientist in Hyderabad's tech scene.
The Building Blocks of QuestDB, a Time Series Databasejavier ramirez
Talk Delivered at Valencia Codes Meetup 2024-06.
Traditionally, databases have treated timestamps just as another data type. However, when performing real-time analytics, timestamps should be first class citizens and we need rich time semantics to get the most out of our data. We also need to deal with ever growing datasets while keeping performant, which is as fun as it sounds.
It is no wonder time-series databases are now more popular than ever before. Join me in this session to learn about the internal architecture and building blocks of QuestDB, an open source time-series database designed for speed. We will also review a history of some of the changes we have gone over the past two years to deal with late and unordered data, non-blocking writes, read-replicas, or faster batch ingestion.
Analysis insight about a Flyball dog competition team's performanceroli9797
Insight of my analysis about a Flyball dog competition team's last year performance. Find more: https://github.com/rolandnagy-ds/flyball_race_analysis/tree/main
Beyond the Basics of A/B Tests: Highly Innovative Experimentation Tactics You...Aggregage
This webinar will explore cutting-edge, less familiar but powerful experimentation methodologies which address well-known limitations of standard A/B Testing. Designed for data and product leaders, this session aims to inspire the embrace of innovative approaches and provide insights into the frontiers of experimentation!
State of Artificial intelligence Report 2023kuntobimo2016
Artificial intelligence (AI) is a multidisciplinary field of science and engineering whose goal is to create intelligent machines.
We believe that AI will be a force multiplier on technological progress in our increasingly digital, data-driven world. This is because everything around us today, ranging from culture to consumer products, is a product of intelligence.
The State of AI Report is now in its sixth year. Consider this report as a compilation of the most interesting things we’ve seen with a goal of triggering an informed conversation about the state of AI and its implication for the future.
We consider the following key dimensions in our report:
Research: Technology breakthroughs and their capabilities.
Industry: Areas of commercial application for AI and its business impact.
Politics: Regulation of AI, its economic implications and the evolving geopolitics of AI.
Safety: Identifying and mitigating catastrophic risks that highly-capable future AI systems could pose to us.
Predictions: What we believe will happen in the next 12 months and a 2022 performance review to keep us honest.
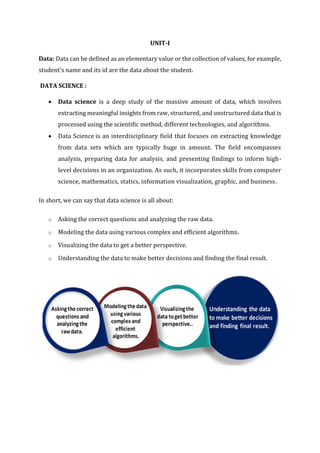
1. UNIT-I
Data: Data can be defined as an elementary value or the collection of values, for example,
student's name and its id are the data about the student.
DATA SCIENCE :
• Data science is a deep study of the massive amount of data, which involves
extracting meaningful insights from raw, structured, and unstructured data that is
processed using the scientific method, different technologies, and algorithms.
• Data Science is an interdisciplinary field that focuses on extracting knowledge
from data sets which are typically huge in amount. The field encompasses
analysis, preparing data for analysis, and presenting findings to inform high-
level decisions in an organization. As such, it incorporates skills from computer
science, mathematics, statics, information visualization, graphic, and business.
In short, we can say that data science is all about:
o Asking the correct questions and analyzing the raw data.
o Modeling the data using various complex and efficient algorithms.
o Visualizing the data to get a better perspective.
o Understanding the data to make better decisions and finding the final result.
2. NEED FOR DATA SCIENCE:
• Traditionally, the data that we had was mostly structured and small in size, which
could be analyzed by using simple Business Intelligence tools. Unlike data in
the traditional systems which was mostly structured, today most of the data is
unstructured or semi-structured.
• This data is generated from different sources like financial logs, text files,
multimedia forms, sensors, and instruments. Simple BI tools are not capable
of processing this huge volume and variety of data. This is why we need more
complex and advanced analytical tools and algorithms for processing, analyzing
and drawing meaningful insights out of it.
•
LIFECYCLE OF DATA SCIENCE
Step 1: Define Problem Statement : Creating a well-defined problem statement is a first
and critical step in data science. It is a brief description of the problem that you are going
to solve.
Step 2: Data Collection:
You need to collect the data which can help to solve the problem. Data collection is a
systematic approach to gather relevant information from a variety of sources. Depending
on the problem statement, the data collection method is broadly classified into two
categories.
3. • Primary Data Collection:
First, when you have some unique problem and no related research is done on the
subject. Then, you need to collect new data. This method is called as primary data
collection.
For example, you want information on the average time that employees spend in a
cafeteria across companies. There is no public data available of these. But you can collect
the data through various methods such as surveys, interviews of employees and by
monitoring the time spent by employees in cafeteria. This method is time-consuming
• Secondary Data Collection:
The data which is readily available or collected by someone else. These data can be
found on the internet, news articles, government census, magazines and so on. This
method is called as secondary data collection. This method is less time-consuming than
the primary method.
Step 3: Data Quality Check and Remediation:
One of the most important and often ignored aspects by data scientists is ensuring
the data that is used for analysis and interpretation is of good quality.
After collecting the data, most people start the analysis on it. Often, they forgot to
do a sanity check on the data. If the data is of bad quality, it can give misleading
information.
Step 4: Exploratory Data Analysis:
Before analysing the data it’s important to analyse the data. It is the most exciting
step as it helps you to build familiarity with the data and extract useful insights. If this step
is skipped then you might end up generating inaccurate models and choosing the
insignificant variables in your model.
Step 5: Data Modelling:
Modelling means formulating every step and gather the techniques required to
achieve the solution. You need to list down the flow of the calculations which is nothing
but modelling steps to the solution. The important factor is how to perform the
calculations. There are various techniques under Statistics and Machine Learning that you
can choose based on the requirement.
4. Step 6: Data Communication:
This is the final step where you present the results from your analysis to the
stakeholders. You explain to them how you came to a specific conclusion and your critical
findings.
Most often you need to present your findings to a non-technical audience, such as
the marketing team or business executives. You need to communicate the results in a
simple to understand manner. And the stakeholders should be able to chalk out an
actionable plan from it.
DATA SCIENCE COMPONENTS:
The main components of Data Science are given below:
1. Statistics: Statistics is one of the most important components of data science. Statistics
is a way to collect and analyze the numerical data in a large amount and finding
meaningful insights from it.
2. Domain Expertise: In data science, domain expertise binds data science together.
Domain expertise means specialized knowledge or skills of a particular area. In data
science, there are various areas for which we need domain experts.
3. Data engineering: Data engineering is a part of data science, which involves acquiring,
storing, retrieving, and transforming the data. Data engineering also includes metadata
(data about data) to the data.
4. Visualization: Data visualization is meant by representing data in a visual context so
that people can easily understand the significance of data. Data visualization makes it
easy to access the huge amount of data in visuals.
5. Advanced computing: Heavy lifting of data science is advanced computing. Advanced
computing involves designing, writing, debugging, and maintaining the source code of
computer programs.
6. Mathematics: Mathematics is the critical part of data science. Mathematics involves
the study of quantity, structure, space, and changes. For a data scientist, knowledge of
good mathematics is essential.
7. Machine learning: Machine learning is backbone of data science. Machine learning is
all about to provide training to a machine so that it can act as a human brain. In data
science, we use various machine learning algorithms to solve the problems.
5. TOOLS FOR DATA SCIENCE
Following are some tools required for data science:
o Data Analysis tools: R, Python, Statistics, SAS, Jupyter, R Studio, MATLAB, Excel,
RapidMiner.
o Data Warehousing: ETL, SQL, Hadoop, Informatica/Talend, AWS Redshift
o Data Visualization tools: R, Jupyter, Tableau, Cognos.
o Machine learning tools: Spark, Mahout, Azure ML studio.
6. APPLICATIONS OF DATA SCIENCE:
o Image recognition and speech recognition:
Data science is currently using for Image and speech recognition. When you
upload an image on Facebook and start getting the suggestion to tag to your
friends. This automatic tagging suggestion uses image recognition algorithm,
which is part of data science.
When you say something using, "Ok Google, Siri, Cortana", etc., and these devices
respond as per voice control, so this is possible with speech recognition
algorithm.
o Gaming world:
In the gaming world, the use of Machine learning algorithms is increasing day by
day. EA Sports, Sony, Nintendo, are widely using data science for enhancing user
experience.
o Internet search:
When we want to search for something on the internet, then we use different
types of search engines such as Google, Yahoo, Bing, Ask, etc. All these search
engines use the data science technology to make the search experience better,
and you can get a search result with a fraction of seconds.
o Transport:
Transport industries also using data science technology to create self-driving
cars. With self-driving cars, it will be easy to reduce the number of road
accidents.
o Healthcare:
In the healthcare sector, data science is providing lots of benefits. Data science is
being used for tumor detection, drug discovery, medical image analysis, virtual
medical bots, etc.
o Recommendation systems:
Most of the companies, such as Amazon, Netflix, Google Play, etc., are using data
science technology for making a better user experience with personalized
recommendations. Such as, when you search for something on Amazon, and you
started getting suggestions for similar products, so this is because of data science
technology.
o Risk detection:
Finance industries always had an issue of fraud and risk of losses, but with the
help of data science, this can be rescued.
7. Most of the finance companies are looking for the data scientist to avoid risk and
any type of losses with an increase in customer satisfaction.
o
PYTHON FOR DATA SCIENCE
• Python is open source, interpreted, high level language and provides
great approach for object-oriented programming. It is one of the best
language used by data scientist for various data science
projects/application.
• Python provide great functionality to deal with mathematics, statistics
and scientific function. It provides great libraries to deals with data
science application.
• One of the main reasons why Python is widely used in the scientific and
research communities is because of its ease of use and simple syntax
which makes it easy to adapt for people who do not have an engineering
background. It is also more suited for quick prototyping.
Features of Python language:
• It uses the elegant syntax, hence the programs are easier to read.
• It is a simple to access language, which makes it easy to achieve the program
working.
• The large standard library and community support.
8. • The interactive mode of Python makes its simple to test codes.
• In Python, it is also simple to extend the code by appending new modules that
are implemented in other compiled language like C++ or C.
• Python is an expressive language which is possible to embed into
applications to offer a programmable interface.
• Allows developer to run the code anywhere, including Windows, Mac OS X,
UNIX, and Linux.
• It is free software in a couple of categories. It does not cost anything to use or
download Pythons or to add it to the application.
NEED FOR PYTHON IN DATA SCIENCE
Python is no-doubt the best-suited language for a Data Scientist. I have listed down a few
points which will help you understand why people go with Python for Data Science:
• Python is a free, flexible and powerful open-source language
• Python cuts development time in half with its simple and easy to read syntax
• With Python, you can perform data manipulation, analysis, and visualization
• Python provides powerful libraries for Machine learning applications and other
scientific computations
PYTHON IDES FOR DATA SCIENCE
Data Science is a field that is used to study and understand data and draw various
conclusions with the help of different scientific processes. Python is a popular language
that is quite useful for data science because of its capacity for statistical analysis and its
easy readability. Python also has various packages for machine learning, natural
language processing, data visualization, data analysis, etc. that make it suited for data
science. Some of the Python IDE’s that are used for Data Science are given as follows:
1. Jupyter notebook – Jupyter notebook is an open source IDE that is used to
create Jupyter documents that can be created and shared with live codes.
Also, it is a web-based interactive computational environment. The Jupyter
notebook can support various languages that are popular in data science
9. such as Python, Julia, Scala, R, etc.
2. Spyder –Spyder is an open source IDE that was originally created and
developed by Pierre Raybaut in 2009. It can be integrated with many
different Python packages such as NumPy, SymPy, SciPy, pandas, IPython,
etc. The Spyder editor also supports code introspection, code completion,
syntax highlighting, horizontal and vertical splitting, etc.
3. Sublime text –Sublime text is a proprietary code editor and it supports a
Python API. Some of the features of Sublime text are project-specific
preferences, quick navigation, supportive plugins for cross-platform, etc.
While the Sublime text is quite fast and has a good support group, it is not
available for free.
4. Visual Studio Code –
Visual Studio Code is a code editor that was developed by Microsoft. It was
developed using Electron but it does not use Atom. Some of the features of
Visual Studio Code are embedded Git control, intelligent code completion,
support for debugging, syntax highlighting, code refactoring, etc. It is also
quite fast and lightweight as well.
5. Pycharm –
Pycharm is an IDE developed by JetBrains and created specifically for
Python. It has various features such as code analysis, integrated unit tester,
integrated Python debugger, support for web frameworks, etc. Pycharm is
particularly useful in machine learning because it supports libraries such as
Pandas, Matplotlib, Scikit-Learn, NumPy, etc.
6. Rodeo –
Rodeo is an open source IDE that was developed by Yhat for data science in
Python. So Rodeo includes Python tutorials and also cheat sheets that can
be used for reference if required. Some of the features of Rodeo are syntax
highlighting, auto-completion, easy interaction with data frames and plots,
built-in IPython support, etc.
7. Thonny –
Thonny is an IDE that was developed at the The University of Tartu for
Python. It is created for beginners that are learning to programme in Python
10. or for those that are teaching it. Some of the features of Thonny are statement
stepping without breakpoints, simple pip GUI, line numbers, live variables
during debugging, etc.
8. Atom –
Atom is an open source text and code editor that was developed using
Electron. It has multiple features such as a sleek interface, a file system
browser, various extensions, etc. Atom also has an extension that can support
Python while it is running.
9. Geany –
Geany is a free text editor that supports Python and contains IDE features as
well. It was originally authored by Enrico Tröger in C and C++. Some of the
features of Geany are Symbol lists, Auto-completion, Syntax highlighting,
Code navigation, Multiple document support, etc.
MOST COMMONLY USED PYTHON LIBRARIES FOR DATA SCIENCE :
• Numpy: Numpy is Python library that provides mathematical function to handle
large dimension array. It provides various method/function for Array, Metrics,
and linear algebra.
NumPy stands for Numerical Python. It provides lots of useful features for
operations on n-arrays and matrices in Python. The library provides
vectorization of mathematical operations on the NumPy array type, which
enhance performance and speeds up the execution. It’s very easy to work with
large multidimensional arrays and matrices using NumPy.
• Pandas: Pandas is one of the most popular Python library for data manipulation
and analysis. Pandas provide useful functions to manipulate large amount of
structured data. Pandas provide easiest method to perform analysis. It provide
large data structures and manipulating numerical tables and time series data.
Pandas is a perfect tool for data wrangling. Pandas is designed for quick and easy
data manipulation, aggregation, and visualization. There two data structures in
Pandas
Series – It Handle and store data in one-dimensional data.
DataFrame – It Handle and store Two dimensional data.
11. • Matplotlib: Matplotlib is another useful Python library for Data
Visualization. Descriptive analysis and visualizing data is very important for
any organization. Matplotlib provides various method to Visualize data in
more effective way. Matplotlib allows to quickly make line graphs, pie charts,
histograms, and other professional grade figures. Using Matplotlib, one can
customize every aspect of a figure. Matplotlib has interactive features like
zooming and planning and saving the Graph in graphics format.
• Scipy: Scipy is another popular Python library for data science and scientific
computing. Scipy provides great functionality to scientific mathematics and
computing programming. SciPy contains sub-modules for optimization,
linear algebra, integration, interpolation, special functions, FFT, signal and
image processing, ODE solvers, Statmodel and other tasks common in science
and engineering.
• Scikit – learn: Sklearn is Python library for machine learning. Sklearn
provides various algorithms and functions that are used in machine learning.
Sklearn is built on NumPy, SciPy, and matplotlib. Sklearn provides easy and
simple tools for data mining and data analysis. It provides a set of common
machine learning algorithms to users through a consistent interface. Scikit-
Learn helps to quickly implement popular algorithms on datasets and solve
real-world problems.
PYTHON BASICS FOR DATA SCIENCE
Basic concept of Python Programming :
• Variables: Variables refer to the reserved memory locations to store the values.
In Python, you don’t need to declare variables before using them or even declare
their type.
• Data Types: Python supports numerous data types, which defines the operations
possible on the variables and the storage method. The list of data types includes –
Numeric, Lists, Strings, tuples, Sets, and Dictionary.
• Operators: Operators helps to manipulate the value of operands. The list of
operators in Python includes- Arithmetic, Comparison, Assignment, Logical,
Bitwise, Membership, and Identity.
• Conditional Statements: Conditional statements help to execute a set of
statements based on a condition. There are namely three conditional statements
– If, Elif and Else.
12. • Loops: Loops are used to iterate through small pieces of code. There are three
types of loops namely – While, for and nested loops.
• Functions: Functions are used to divide your code into useful blocks, allowing you
to order the code, make it more readable, reuse it & save some time.
Practical implementations, using Python coding .
Loading The Data
The very first step, to begin with, is loading the data into your program. We can do so by
using the read_csv( ) from the Python panda’s library.
1
2
import pandas as pd
data = pd.read_csv("file_name.csv")
Cleaning the Data
The next step is to look for irregularities in the data by doing some data exploration.
Finding out the null values and replacing them with other values or dropping that row
altogether is involved in this phase.
1. data.describe()
#to check for null values
2. data.isnull().sum()
#drop the null values
3. df = data.dropna()
#checking again to be double sure
4. df.isnull().sum()
Visualization
After we are done cleaning, we can move ahead and make some visualizations to
understand the relationship between various aspects of our dataset.
1sns.scatterplot(x=df["npg"], y=df["birth_rate"])