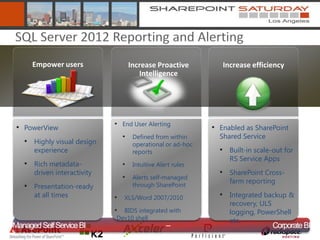
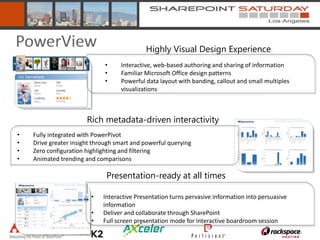
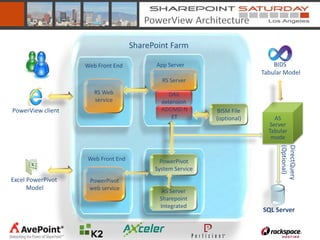
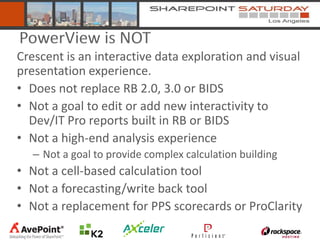
PowerView is an interactive data exploration and visual presentation experience within SQL Server 2012. It allows users to interactively author and share visualizations using familiar Microsoft Office design patterns. PowerView provides a rich metadata-driven experience with fully integrated PowerPivot modeling that drives greater insight through querying and filtering of data. Presentations can be delivered and collaborated on through SharePoint in an interactive format. The PowerView architecture leverages SQL Server Analysis Services tabular mode for storage and processing of data.
SharePoint 2010 and SQL Server 2012 Business Intelligence (Serge Luca, Isabel...serge luca
Session of Serge Luca (SharePoint MVP) and Isabelle Van Campenhoudt (ICT7) on SharePoint Business Intelligence with SQL Server 2012 Club SharePoint France, Microsoft France December 2011
Xencia brings in multi-decades of knowledge in building Collaboration solutions for Large Enterprises, to deliver pragmatic Products and Services. Xencia mission is to enable enterprises with smart and innovative solutions that are simple to deploy and generates substantial business value in a very short period of time. Our Products and Services are designed to leverage enterprises’ technology investments and multiply their benefits several folds. Xencia vision is to design subscription based hosted model for its products and services that would reap the advancement in Cloud Computing.
Presentations from IMGS at Local Government User Group session on 11/09/2012.
Includes presentations on Location Publisher updates, GeoMedia Smartclient, Leica Geosystems and ERDAS Imagine and Apollo
Perficient Self Service Business Intelligence with Power PivotPerficient, Inc.
Power Pivot is a feature of Microsoft Excel 2010. It allows you to import data from multiple sources. It has self-service, in-memory capabilities, and thus adds value to Microsoft's business intelligence offerings. Learn more about how you can leverage Power Pivot for business intelligence in this presentation by Perficient's Duane Schafer, Sr. Technical Architect.
Perficient Business Intelligence Analysis and Delivery Options in SharePointPerficient, Inc.
Learn about analytical and delivery options, visualization frameworks, for business intelligence via Microsoft SharePoint in this presentation by Perficient's Senior Technical Architect, Duane Schafer. You'll also see a demo of SharePoint's BI component.
Power BI & SAP - Integration Options and possible PifallsJJDE
Dein Unternehmen setzt als ERP/BI-System auf SAP? Und du suchst nach den besten Möglichkeiten, um alle SAP BW / HANA-Daten in Microsoft Power BI zu integrieren und das Beste aus beiden Welten zu nutzen? Dann ist diese Session für dich! Du erhältst einen Überblick über die verschiedenen Integrationsoptionen und -Überlegungen, die du berücksichtigen solltest.
English Version:
Your Company's ERP and/or BI-System is SAP? And you are looking for the best options to get all your SAP BW/HANA Data to Microsoft (Power) BI and leverage the best of both worlds? Then this session is for you! You will get an overview of the several integration options and considerations you should be aware. The session will be hold in german language but of course we can switch to English as needed.
Big Data in Cloud: Seize your Insight Like a Golden Snitch (Margaret Ostapchu...IT Arena
Lviv IT Arena is a conference specially designed for programmers, designers, developers, top managers, inverstors, entrepreneurs and startuppers. Annually it takes place at the beginning of October in Lviv at Arena Lviv stadium. In 2016 the conference gathered more than 1800 participants and over 100 speakers from companies like Microsoft, Philips, Twitter, UBER and IBM. More details about the conference at itarena.lviv.ua.
The Behavioural Science of Predictions, Forecasting and Decision MakingNeedle Partners
When running a business, you have to make countless decisions based on your own predictions or those of experts. However in a world of complexity and uncertainty, it is often challenging to make accurate predictions based on limited information.
Whether predicting the financial markets, the outcome of your latest venture or what your competitors are going to do next, making accurate predictions is key to making good decisions.
This seminar will explore the how insights from the behavioural and brain sciences can be used to help make predictions and decisions for your business.
This seminar will demonstrate:
- How experts make predictions
- The cognitive biases that affect predictions
- How to utilise your intuition for quick predictions
- Strategies you can adopt to help you make decisions
About Needle :
Needle is an international law firm that offers more than just legal advice. A full service commercial law firm, Needle provides expert tactical advice to help its clients navigate through any challenges. Beyond the legal, Needle’s business expertise is incorporated into all of its advice, ensuring its clients’ objectives are always a priority. Able to provide clients with levels of expertise and knowledge rarely found outside the major international and large national practices, Needle’s approach is pragmatic, focused and results oriented.
How start ups are changing the Indian Business by introducing innovative business model. The new age of entrepreneurs start up ideas of conventional business model in Indian E-Commerce Industry are trying to create a business empire which no one can imagine in the Indian Market and to work on such a model which never existed.
How to Get Lightning Fast Answers with Power BI Q&A and CortanaVishal Pawar
How to interact with your corporate data right from within the Cortana experience including voice integration for querying your data. How Q&A can resolve our day today question from organization. How to Use natural language queries to find answers in your own data. Start with a question, and have fun traveling through your data refining or expanding your question, uncovering trust-worthy new information, zeroing in on details and zooming out for a broader view
This session will cover the enhancements and new features in SQL Server 2012 as Microsoft continues its roadmap with self-service BI. Topics include the changes that have been made to PowerPivot in Excel, as well as the new features. There will be a demo showing how PowerPivot models can be used in SharePoint along with Power View to provide self-service reporting capabilities to end-users. This session will also cover what Power View is, how it works, and what you can do with this new reporting feature that is part of SharePoint SSRS 2012 Integrated Mode.
Intro to BI Semantic Model & Self-Service Reporting with Power ViewDan English
There are a lot of changes coming in the next release of SQL Server “Denali” with Analysis Services and PowerPivot along with new powerful BI functionality being added. This presentation will introduce the new BI Semantic Model concept, talk about the different options you have with Analysis Services in SQL Server 2012 (“Denali"), go over the new features in Analysis Services – including PowerPivot, go over developing models, and dive into the new self-service reporting authoring tool Power View (Project “Crescent”). Along the way there will be demonstrations of the new features and functionality so you can get a feel for what is coming. By the end of the session you will have a full understanding of what lies ahead and you can start preparing your roadmap for delivering BI content within your organization.
SQL Server 2012 and SharePoint 2010: Reporting NirvanaRandy Williams
With SQL Server 2012, Microsoft finally delivers on a critical business need: end-user driven reporting solutions. In this session, be prepared to be amazed by the power and ease of Power View, Microsoft's latest reporting technology that lets regular users build rich, dynamic reporting applications right from the browser. We'll then learn how the next generation of PowerPivot and SQL Server Reporting Services (SSRS) integrates as a pure SharePoint service application, simplifying deployment and the architecture of your reporting platform.
What's New with BI in SQL Server Denali (SQL11)Dan English
During this session we are going to go over some of the new BI features that have been enhanced and added in SQL Server "Denali" (SQL11). We will look at new features that have been added into Integration Services, Analysis Services, and Reporting Services. Along with this we will talk about and go over the new report authoring tool "Crescent" showing how this tool will provide you the ability to access, explore, and visualize your data in a whole new way and have fun at the same time.
Starting in May 2010, with SQL Server 2008 R2, Microsoft began talking more and more about "Personal BI". The focus of this discussion was a paradigm shift moving business intelligence from being something a few BI professionals do with a data warehouse to a practice done by Information Workers every day in familiar tools like Microsoft Excel and SharePoint. Over the course of this session we will show you the improvements that Microsoft has made in the 2013 stack to take this new focus from being a “nice idea” to a truly powerful reality. We will explore the improvements made to Excel, PowerPivot & Power View, & Reporting Services. We will explain the underlying technology that makes the new features possible and walk through demos of some of the shinier toys. At the end of the session you will walk away with a better understanding of what is new in 2013 for business intelligence and an extreme desire to build reusable data model that will undoubtedly bring real value to your business.
Self service BI with sql server 2008 R2 and microsoft power pivot shortEduardo Castro
In this presentation we summarize BI improvements in SQL Server 2008 R2 and PowerPivot.
Regards,
Dr. Eduardo Castro
http://ecastrom.blogspot.com
http://comunidadwindows.org
Explain about power BI Overview from Power BI Desktop, Power BI Service, Power BI Report Server and Power BI Mobile that consume all BI Data from Dataset and datamodel
Learn more about PowePivot, Microsoft's new in-memory engine, and how you can extend it with advanced analytics and a data security layer for enterprise wide deployment.
Extending the reach of the business application to more users in the organization leads to better data management and better access to information.
After a short intro on Microsoft Dynamics AX you will learn about the new MS Office Add-ins for Microsoft Dynamics AX and discover the mobile capabilities for end users within the travel and expense module.
Learn how to create state-of-the-art, self-service BI solutions for Dynamics AX 2012 using SQL Server 2012 PowerPivot for SharePoint, BISM and Power View.
UiPath Test Automation using UiPath Test Suite series, part 4DianaGray10
Welcome to UiPath Test Automation using UiPath Test Suite series part 4. In this session, we will cover Test Manager overview along with SAP heatmap.
The UiPath Test Manager overview with SAP heatmap webinar offers a concise yet comprehensive exploration of the role of a Test Manager within SAP environments, coupled with the utilization of heatmaps for effective testing strategies.
Participants will gain insights into the responsibilities, challenges, and best practices associated with test management in SAP projects. Additionally, the webinar delves into the significance of heatmaps as a visual aid for identifying testing priorities, areas of risk, and resource allocation within SAP landscapes. Through this session, attendees can expect to enhance their understanding of test management principles while learning practical approaches to optimize testing processes in SAP environments using heatmap visualization techniques
What will you get from this session?
1. Insights into SAP testing best practices
2. Heatmap utilization for testing
3. Optimization of testing processes
4. Demo
Topics covered:
Execution from the test manager
Orchestrator execution result
Defect reporting
SAP heatmap example with demo
Speaker:
Deepak Rai, Automation Practice Lead, Boundaryless Group and UiPath MVP
Neuro-symbolic is not enough, we need neuro-*semantic*Frank van Harmelen
Neuro-symbolic (NeSy) AI is on the rise. However, simply machine learning on just any symbolic structure is not sufficient to really harvest the gains of NeSy. These will only be gained when the symbolic structures have an actual semantics. I give an operational definition of semantics as “predictable inference”.
All of this illustrated with link prediction over knowledge graphs, but the argument is general.
DevOps and Testing slides at DASA ConnectKari Kakkonen
My and Rik Marselis slides at 30.5.2024 DASA Connect conference. We discuss about what is testing, then what is agile testing and finally what is Testing in DevOps. Finally we had lovely workshop with the participants trying to find out different ways to think about quality and testing in different parts of the DevOps infinity loop.
GraphRAG is All You need? LLM & Knowledge GraphGuy Korland
Guy Korland, CEO and Co-founder of FalkorDB, will review two articles on the integration of language models with knowledge graphs.
1. Unifying Large Language Models and Knowledge Graphs: A Roadmap.
https://arxiv.org/abs/2306.08302
2. Microsoft Research's GraphRAG paper and a review paper on various uses of knowledge graphs:
https://www.microsoft.com/en-us/research/blog/graphrag-unlocking-llm-discovery-on-narrative-private-data/
Essentials of Automations: Optimizing FME Workflows with ParametersSafe Software
Are you looking to streamline your workflows and boost your projects’ efficiency? Do you find yourself searching for ways to add flexibility and control over your FME workflows? If so, you’re in the right place.
Join us for an insightful dive into the world of FME parameters, a critical element in optimizing workflow efficiency. This webinar marks the beginning of our three-part “Essentials of Automation” series. This first webinar is designed to equip you with the knowledge and skills to utilize parameters effectively: enhancing the flexibility, maintainability, and user control of your FME projects.
Here’s what you’ll gain:
- Essentials of FME Parameters: Understand the pivotal role of parameters, including Reader/Writer, Transformer, User, and FME Flow categories. Discover how they are the key to unlocking automation and optimization within your workflows.
- Practical Applications in FME Form: Delve into key user parameter types including choice, connections, and file URLs. Allow users to control how a workflow runs, making your workflows more reusable. Learn to import values and deliver the best user experience for your workflows while enhancing accuracy.
- Optimization Strategies in FME Flow: Explore the creation and strategic deployment of parameters in FME Flow, including the use of deployment and geometry parameters, to maximize workflow efficiency.
- Pro Tips for Success: Gain insights on parameterizing connections and leveraging new features like Conditional Visibility for clarity and simplicity.
We’ll wrap up with a glimpse into future webinars, followed by a Q&A session to address your specific questions surrounding this topic.
Don’t miss this opportunity to elevate your FME expertise and drive your projects to new heights of efficiency.
LF Energy Webinar: Electrical Grid Modelling and Simulation Through PowSyBl -...DanBrown980551
Do you want to learn how to model and simulate an electrical network from scratch in under an hour?
Then welcome to this PowSyBl workshop, hosted by Rte, the French Transmission System Operator (TSO)!
During the webinar, you will discover the PowSyBl ecosystem as well as handle and study an electrical network through an interactive Python notebook.
PowSyBl is an open source project hosted by LF Energy, which offers a comprehensive set of features for electrical grid modelling and simulation. Among other advanced features, PowSyBl provides:
- A fully editable and extendable library for grid component modelling;
- Visualization tools to display your network;
- Grid simulation tools, such as power flows, security analyses (with or without remedial actions) and sensitivity analyses;
The framework is mostly written in Java, with a Python binding so that Python developers can access PowSyBl functionalities as well.
What you will learn during the webinar:
- For beginners: discover PowSyBl's functionalities through a quick general presentation and the notebook, without needing any expert coding skills;
- For advanced developers: master the skills to efficiently apply PowSyBl functionalities to your real-world scenarios.
Slack (or Teams) Automation for Bonterra Impact Management (fka Social Soluti...Jeffrey Haguewood
Sidekick Solutions uses Bonterra Impact Management (fka Social Solutions Apricot) and automation solutions to integrate data for business workflows.
We believe integration and automation are essential to user experience and the promise of efficient work through technology. Automation is the critical ingredient to realizing that full vision. We develop integration products and services for Bonterra Case Management software to support the deployment of automations for a variety of use cases.
This video focuses on the notifications, alerts, and approval requests using Slack for Bonterra Impact Management. The solutions covered in this webinar can also be deployed for Microsoft Teams.
Interested in deploying notification automations for Bonterra Impact Management? Contact us at sales@sidekicksolutionsllc.com to discuss next steps.
Kubernetes & AI - Beauty and the Beast !?! @KCD Istanbul 2024Tobias Schneck
As AI technology is pushing into IT I was wondering myself, as an “infrastructure container kubernetes guy”, how get this fancy AI technology get managed from an infrastructure operational view? Is it possible to apply our lovely cloud native principals as well? What benefit’s both technologies could bring to each other?
Let me take this questions and provide you a short journey through existing deployment models and use cases for AI software. On practical examples, we discuss what cloud/on-premise strategy we may need for applying it to our own infrastructure to get it to work from an enterprise perspective. I want to give an overview about infrastructure requirements and technologies, what could be beneficial or limiting your AI use cases in an enterprise environment. An interactive Demo will give you some insides, what approaches I got already working for real.
UiPath Test Automation using UiPath Test Suite series, part 3DianaGray10
Welcome to UiPath Test Automation using UiPath Test Suite series part 3. In this session, we will cover desktop automation along with UI automation.
Topics covered:
UI automation Introduction,
UI automation Sample
Desktop automation flow
Pradeep Chinnala, Senior Consultant Automation Developer @WonderBotz and UiPath MVP
Deepak Rai, Automation Practice Lead, Boundaryless Group and UiPath MVP
Elevating Tactical DDD Patterns Through Object CalisthenicsDorra BARTAGUIZ
After immersing yourself in the blue book and its red counterpart, attending DDD-focused conferences, and applying tactical patterns, you're left with a crucial question: How do I ensure my design is effective? Tactical patterns within Domain-Driven Design (DDD) serve as guiding principles for creating clear and manageable domain models. However, achieving success with these patterns requires additional guidance. Interestingly, we've observed that a set of constraints initially designed for training purposes remarkably aligns with effective pattern implementation, offering a more ‘mechanical’ approach. Let's explore together how Object Calisthenics can elevate the design of your tactical DDD patterns, offering concrete help for those venturing into DDD for the first time!
Smart TV Buyer Insights Survey 2024 by 91mobiles.pdf91mobiles
91mobiles recently conducted a Smart TV Buyer Insights Survey in which we asked over 3,000 respondents about the TV they own, aspects they look at on a new TV, and their TV buying preferences.
FIDO Alliance Osaka Seminar: Passkeys and the Road Ahead.pdf
SQL 2012 PowerView Talk SPSLA
1. Business Intelligence:
SQL Server 2012 PowerView
Ravi Bodla
Senior Manager
Hitachi Consulting
Orange County, California,
United States
2. About Ravi Bodla
• Senior Manager
– Microsoft Platform
– Southern California Region
• Hitachi Consulting
– Global IT and Management Consulting Firm
– Over 5000 consultants worldwide
– Microsoft Worldwide Partner,
– Microsoft Product Development,
– Partner Advisory Council
• Microsoft V-TSP
3. Session Objectives and Takeaways
• What is PowerView?
• Learn about PowerView’s key capabilities
• Architecture and requirements
• Understanding of the SQL Server BI Stack
• Have fun with data!
5. SQL Server2012
Delivering business agility and innovation to gain strategic
value out of your information
MISSION CRITICAL DEVELOPER & IT PERVASIVE INSIGHT
PLATFORM PRODUCTIVITY
Microsoft Confidential—Preliminary Information Subject to Change
6. SQL Server 2012 Reporting and Alerting
Empower users Increase Proactive Increase efficiency
Intelligence
• End User Alerting
• PowerView • Enabled as SharePoint
• Defined from within Shared Service
• Highly visual design operational or ad-hoc
experience reports • Built-in scale-out for
RS Service Apps
• Rich metadata- • Intuitive Alert rules
driven interactivity • SharePoint Cross-
• Alerts self-managed
farm reporting
• Presentation-ready through SharePoint
at all times • XLS/Word 2007/2010 • Integrated backup &
recovery, ULS
• BIDS integrated with logging, PowerShell
Dev10 shell etc.
Managed Self Service BI – Corporate BI
7.
8. What is PowerView?
PowerView is an interactive
data exploration and visual
presentation experience.
9. PowerView Highly Visual Design Experience
• Interactive, web-based authoring and sharing of information
• Familiar Microsoft Office design patterns
• Powerful data layout with banding, callout and small multiples
visualizations
Rich metadata-driven interactivity
• Fully integrated with PowerPivot
• Drive greater insight through smart and powerful querying
• Zero configuration highlighting and filtering
• Animated trending and comparisons
Presentation-ready at all times
• Interactive Presentation turns pervasive information into persuasive
information
• Deliver and collaborate through SharePoint
• Full screen presentation mode for interactive boardroom session
11. PowerView Architecture
SharePoint Farm
Web Front End App Server BIDS
Tabular Model
RS Server
RS Web DAX
service extension
PowerView client ADOMD.N BISM File
ET (optional) AS
Server
Tabular
mode
(Optional)
DirectQuery
Web Front End PowerPivot
System Service
Excel PowerPivot PowerPivot
Model web service AS Server
Sharepoint
Integrated
SQL Server
12. Analysis Services: Tomorrow
Build on the strengths
Embrace the relational
and success of Analysis
data model – well
Services and expand its
understood by
reach to a much
developers and IT Pros
broader user base
Bring together the
relational and Provide flexibility in the
multidimensional platform to suit the
models under a single diverse needs of BI
unified BI platform – applications
best of both worlds!
13. BI Semantic Model: Benefits
Flexibility Richness Scalability
o Tabular and o Serves entire range of BI o VertiPaq in-memory
multidimensional engine
modeling solutions
o Cached or passthrough o Rich modeling o State-of-the-art
storage capabilities compression algorithms
o VertiPaq for o Scales to largest enterprise
performance, MOLAP for o Complex business logic servers
scale
o Fine-grained security o Improved SharePoint
o Choice of end-user BI
tools configuration and
performance
14. BI Semantic Model: Architecture
Third-party Reporting SharePoint
applications Services Excel PowerPivot Insights
BI Semantic Model
Multi- Tabular
Data model dimensional
Business MDX DAX
logic/queries
Data access ROLAP MOLAPVertiPaq Direct
Query
Databases LOB Applications Files OData Feeds Cloud Services
15. Data Model
Tabular Multidimensional
Familiar model, easier to Sophisticated model, higher learning
build, faster time curve
to solution
Advanced concepts baked into the
Advanced concepts (parent- model
child, many-to-many) not available and optimized (parent-child, many-
natively in the model… need to-many, attribute relationships, key
calculations to simulate these vs. name, etc.)
Easy to wrap a model over a raw Ideally suited for OLAP type apps
database (e.g.
or warehouse for reporting & planning, budgeting, forecasting)
analytics that need the power of the
multidimensional model
16. Business Logic
DAX MDX
Based on Excel formulas and Based on understanding of
relational concepts – easy to get multidimensional concepts – higher
started initial learning curve
Complex solutions require steeper Complex solutions require steeper
learning curve – row/filter learning curve –
context, Calculate, etc. CurrentMember, overwrite
semantics, etc.
Calculated columns enable new
scenarios, however no named sets Ideally suited for apps that need the
or calc members power of multidimensional
calculations –
scopes, assignments, calc members
17. PowerView is NOT
Crescent is an interactive data exploration and visual
presentation experience.
• Does not replace RB 2.0, 3.0 or BIDS
• Not a goal to edit or add new interactivity to
Dev/IT Pro reports built in RB or BIDS
• Not a high-end analysis experience
– Not a goal to provide complex calculation building
• Not a cell-based calculation tool
• Not a forecasting/write back tool
• Not a replacement for PPS scorecards or ProClarity
18. Report Designer Report Builder Project “Crescent”
Embedded Operational Business
21. We want your feedback!
Use this QR code or visit:
http://sps.la/feedback
Silver Sponsors:
22. Victory Lap- social event
"SharePoint Victory Lap" Social Event for
SPSLA will be at: 5:30pm to 8pm at
Di Piazzas (5205 E. Pacific Coast Hwy, 90804)
Editor's Notes
Where do we want to take this product. Multi-release, multi-year vision for the productSometimes you want fast time to solution, sometimes you want complex calculations and huge scaleBISM is the name we give to Analysis Services that encompasses these goalsSession Talk------------------------now when we started SQL server Denali, at the beginning of the planning stages we say let’s take a step back, where do we want to take this product not just for Denali, but for multiple releases. Let’s come up with vision for this product where it take Microsoft BI, and come up with multi release vision that we can articulate and then deliver on over a period of multiple releases with Denali being the first release. According to the coordination of AS the --familiar with sort of conceived almost a year back and we were studying --vision and we target a good time to takes talk --sorts of applications customers are building or want to build and we want to come up with a vision that captures those needs.So first of all we said we have got a very rich and large ecosystem, developers, partners IPSVs, we want to carry this ecosystem forward in a seamless manner we don’t want the community to learn start things from scratch, community to build the top of work they already have, at the same time we want to extend the reach of Microsoft BI, so if you go the typical IT conference let’s like Microsoft Tech-head and you can ask around what do you think about BI, you can get some people would say hmm, I have heard about it but not really sure about that what it is, you can hear few people say I have heard all up about multi-dimension modeling and BI can do the legal things but it seems like something that’s complex, high learning curve not sure how to get time to go about getting into that.And on the other hand if you go asking about traditional relational database concepts of SQL you are going to find people are much more receptive to that, there is a certain amount of penetration a certain amount of familiarity with relational database concepts that exists out there and we want to sell of embrace that in BI and in AS. This is where we want this relational data modeling because in order to --more IT professionals and developers that are familiar with that, at the same time we recognize that what AS have today with multi-dimensional modeling, with level of richness and scale on the --- so we want to keep that an essential that provides the best of both ways. We recognize that BI applications don’t come in single shaper size they have varying needs; some applications need tremendous requirements in terms of scales and performance, some application have a lot of needs in terms of calculation complexity, there are lot of BI applications that need rapid attritions, there is a lot of time hear from customers coming and saying my usage have a need and for me to go provision fund project --go through the --process of ETL and --development report development, all of that takes a long time and I’d like to be able to iterate really fast, and some of these things. So that’s another requirement that we hear from --we need we would like this platform to be able to provide the flexibility that it can meet all of these needs, based on the needs of your applications. So kind of the BI Semantic model is it on we use, to capture this vision, the vision that takes into account all of these needs or all of these principles that we have outlined here.
Carry forward the existing ecosystem of client applicationsLook a bit deeper into the conceptual architectureCall out PowerPivot as a clientMDX versus DAXData access: cache the data or pass it through Vertipaq new in-memorycolunmstore, compression, blazing fast perf. No aggregations or tuning. Same as PowerPivot for Excel and SharePoint.Session Talk------------------Let’s just get into the details of the model, so here is a conceptual architecture of the BI Semantic model, at the bottom you see a list of data sources. The model can consume data from a variety of data services; you have got classic relational databases, SQL server, Oracle data unit, all of the traditional relational databases ---pull in data from all data fields in SharePoint list, for example ----you can pull data out of those, you can pull data from Facebook and in a Netflix if you want, anything all of the public data services that are exposed by all data, you can consume SQL --report data service. So, the idea is that we want to make sure that pretty much you got data there in any form, even in text file or excel workbook sitting on a desktop, you should be able to consume that into your model.And then finally the model does a bunch of transformation with the data and serves a top to variety of client tools, the client tools in Microsoft BI stack are listed there if got reporting services, for both professional and operational reporting as well as ad-hoc reporting with crescent, you have got excel, you have got SharePoint inside which is the --for the BI capabilities in SharePoint which is performance points scorecards and dashboards and so-forth. The analysis service continues to expose a rich set of public API for client tools to consume those already from a rich ecosystem of client tools out there. They are not built by Microsoft and you have got tools like ---a number of tools and all of these tools continue to be supported and so we expect that there will be a significant number of third party tools built on analysis services as well. And then you have got PowerPivot as well which is very interesting, right? This is kind of take a little bit of time to think about it, PowerPivot itself has a semantic model embedded inside it, the user doesn’t know about it, the user is just doing his job in excel and then a model gets --out but that model inside PowerPivot can also consume data from professional model that is available on analysis services server so you can essentially let an IT put out an application which consist of BI semantic model, on an AS server, then an information worker can then launch PowerPivot may be take a portion of that data in model and then mashed up with some other personal data that they might have and then build essentially a new model, so that’s kind of builds up interesting scenarios as well.So, let’s look at inside the model, as what is in the model, so we like to think of the model in terms of three layers, the data model layer, the business logic and query layer and the data access layer. So walking from the bottom up, the data access layer is essentially the layer that consolidates the data from the variety of data sources that you have and then --to the higher level in this stack, now the data can be cashed, or the data can be passed through. Cashing the data in analysis services knows how to optimize the data, compress the data and aggregate the data as needed, and essentially make it available in a form that interacting with the data comes really-really fast. That’s can a high your usage get that response time at the speed of top, and we have got them all up engine, this is the traditional engine for cashing in analysis services, and we’ve got a brand new in memory --engine called the work pack engine, that is introduced in Denali, that enables cashing as well and then you have got a couple of different ways you have got roll up and a new mode called direct query. That enables you to pass through the access to the data, so you have got an application where you absolutely don’t want to cash the data, you want the queries to be pass through to the back end data source, and you can do that as well. It’s traditionally possible with roll-up, with some limitation and direct query is a new mode that we are introducing that will also let you pass through the access to the data, and we’ll cover that in more details. Business logic, once you have pulled in the data then you have decided whether you want to may be cash the data so that your users get fast performance, fast access to the data and one of the big elements of being data modeling in analysis services is to enrich the model because this model is the one place where all of your business rules are defined. If you have got sales model that is and you have a business matrices that defines how your sales are doing, your -related to previous periods, may be you have certain KPI or matric that defines your measure of success or failure with regards to some business goals, well, you want all of the end users regardless to what will be the reason, to see the same central definition of those matrices, or business rules, and analysis services offered with MDX and DAX --expressional languages to define those rules. And our MDX is being with AS for several releases so it cannot become the defective standard in the industry, you’ll for multi-dimension data access, but with PowerPivot we introduced DAX- data analysis expressions, which is an expression language sort of based on excel formulas, the goal there was to reduce the barrier to entry we’ve acknowledge that MDX while extremely rich and sophisticated powerful the barrier to entry buzz exist there to learning curve involved with MDX and with DAX we try to reduce that barrier to entry, the idea is with information workers and professionals if you are familiar with relational database concepts, tabular concepts, tables and columns and relationship navigation the barrier to entry with DAX is going to be much lower. And there is an entire session devoted to DAX, either today or tomorrow and so I’d encourage you to go and attend that one. And then finally we’ve got the data model, now the data model is to look to at it, one is that the data model is a model that developer works with so the model developer can work with the multi-dimensional model when building a model or work with a tabular interface.Now you guys use AS today, so you are familiar with the multi-dimensional paradigm of major groups of dimensions that what john was showing you the demo was a completely different paradigm it was just the tables and relationships interface to building models, so you have both options and regardless of which option you use the client tool can then choose to consume the model in either of the two ways, so if the client tool happen to be excel, excel just consumes the model as a multi-dimensional model because excel was built and that multi-dimensional model is more conducive to interactive analysis but crescent chooses to consume it using the tabular interface. Okay, so one of the points that I want to make here is, this model is a hybrid model, it’s a blend of both relational and multi-dimensional modeling