
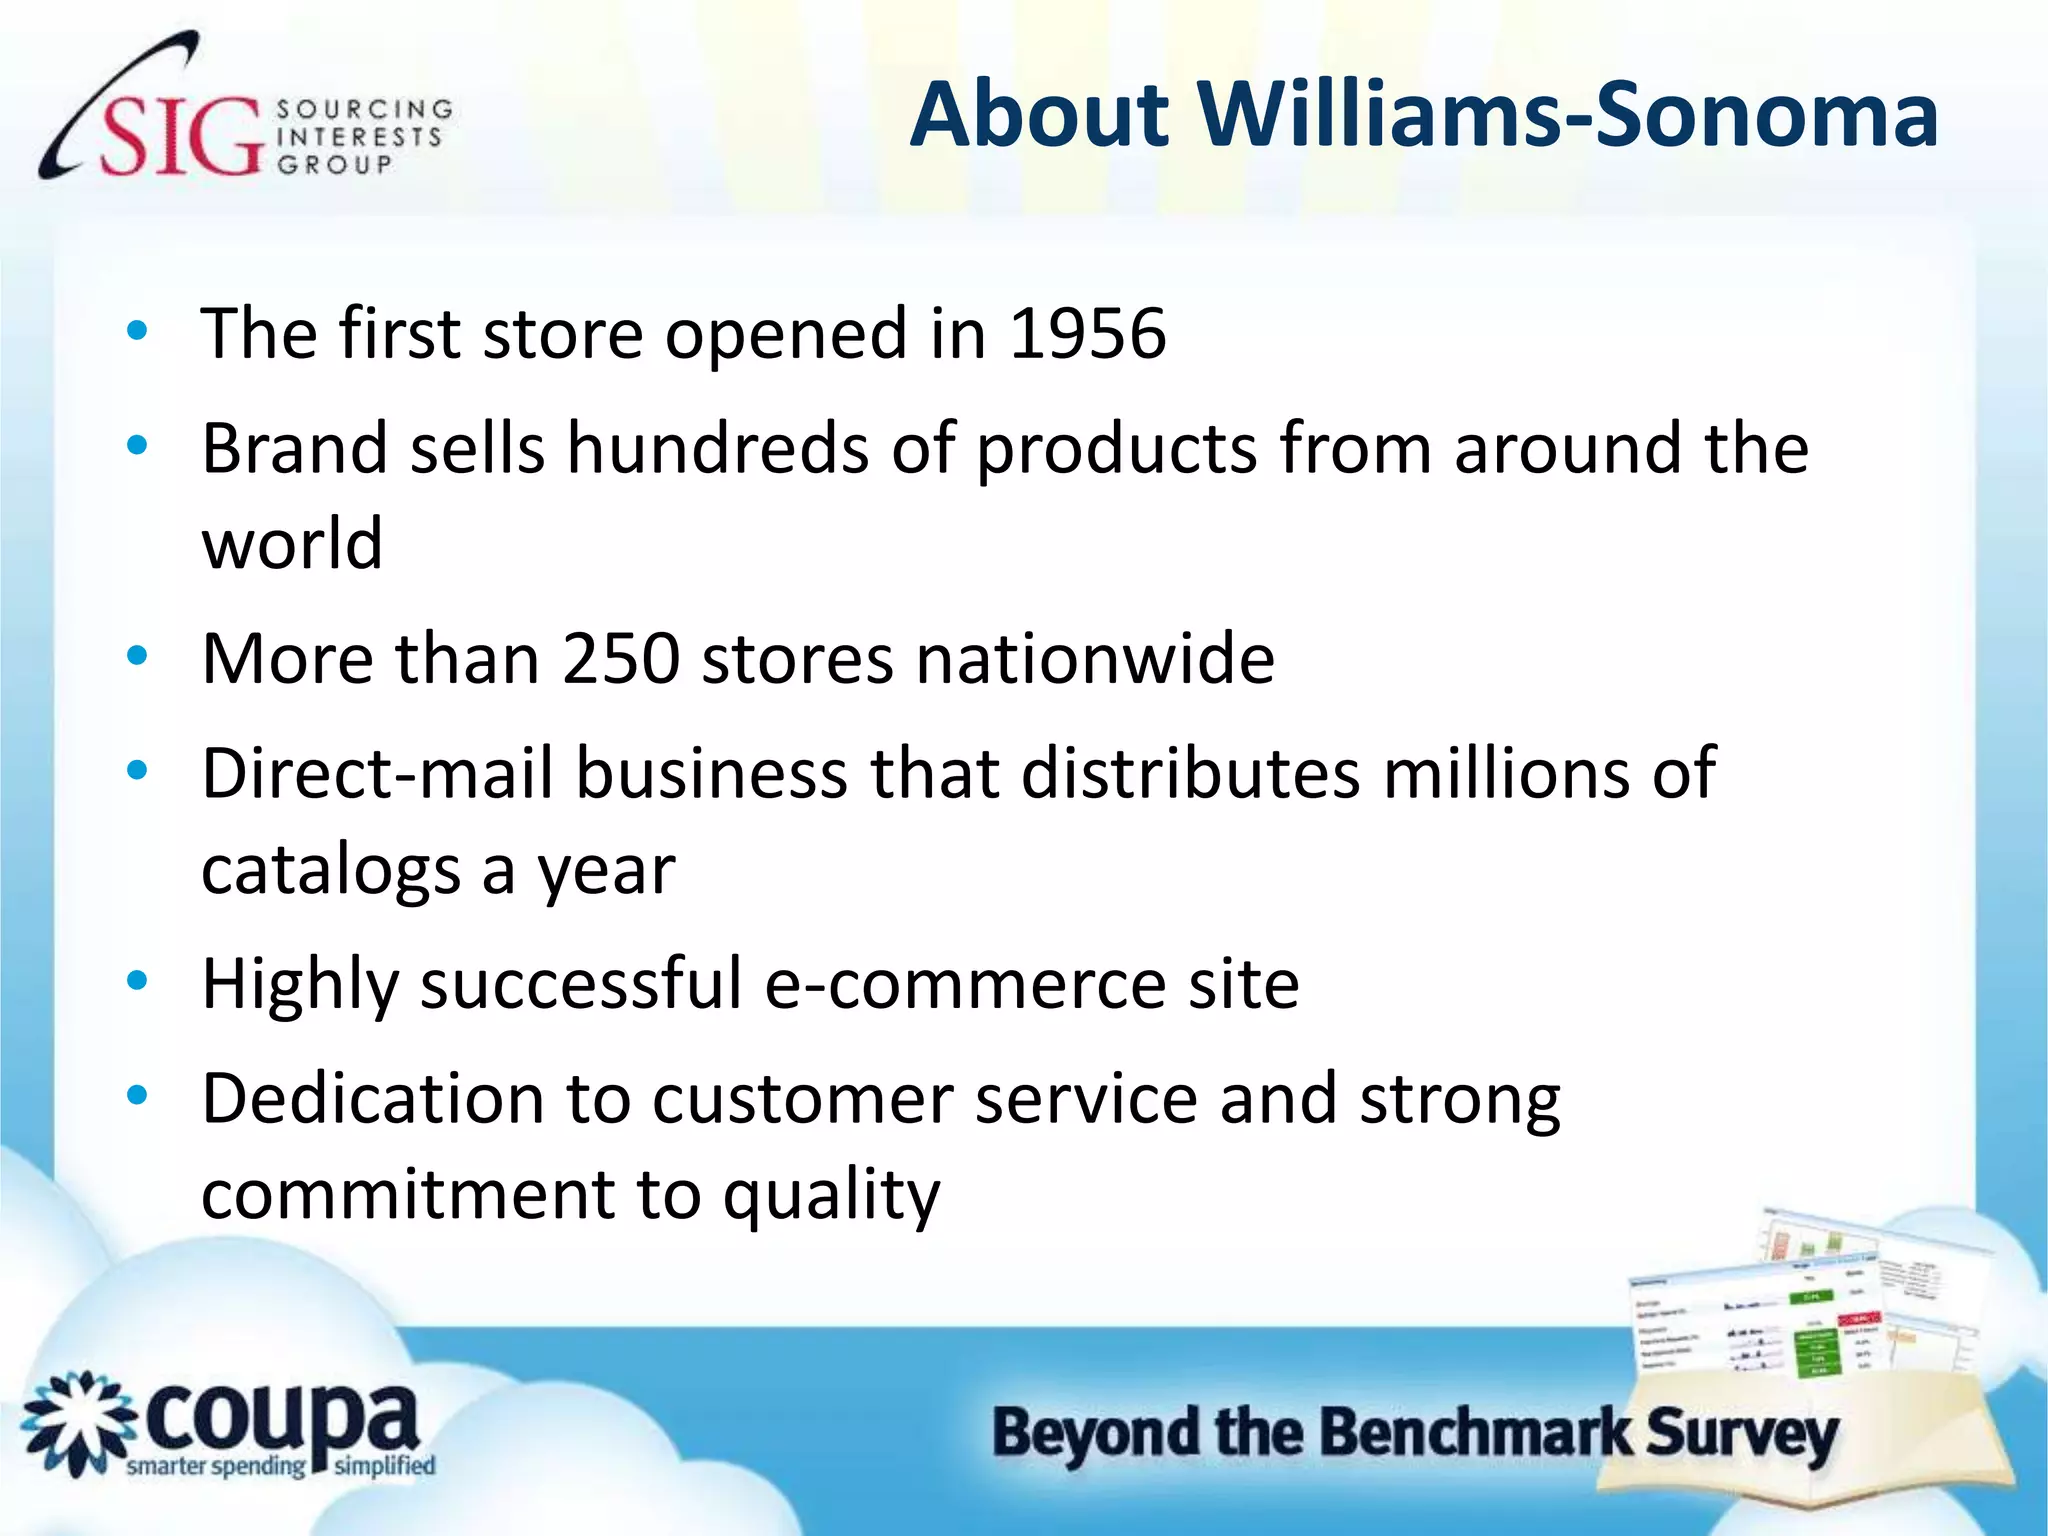

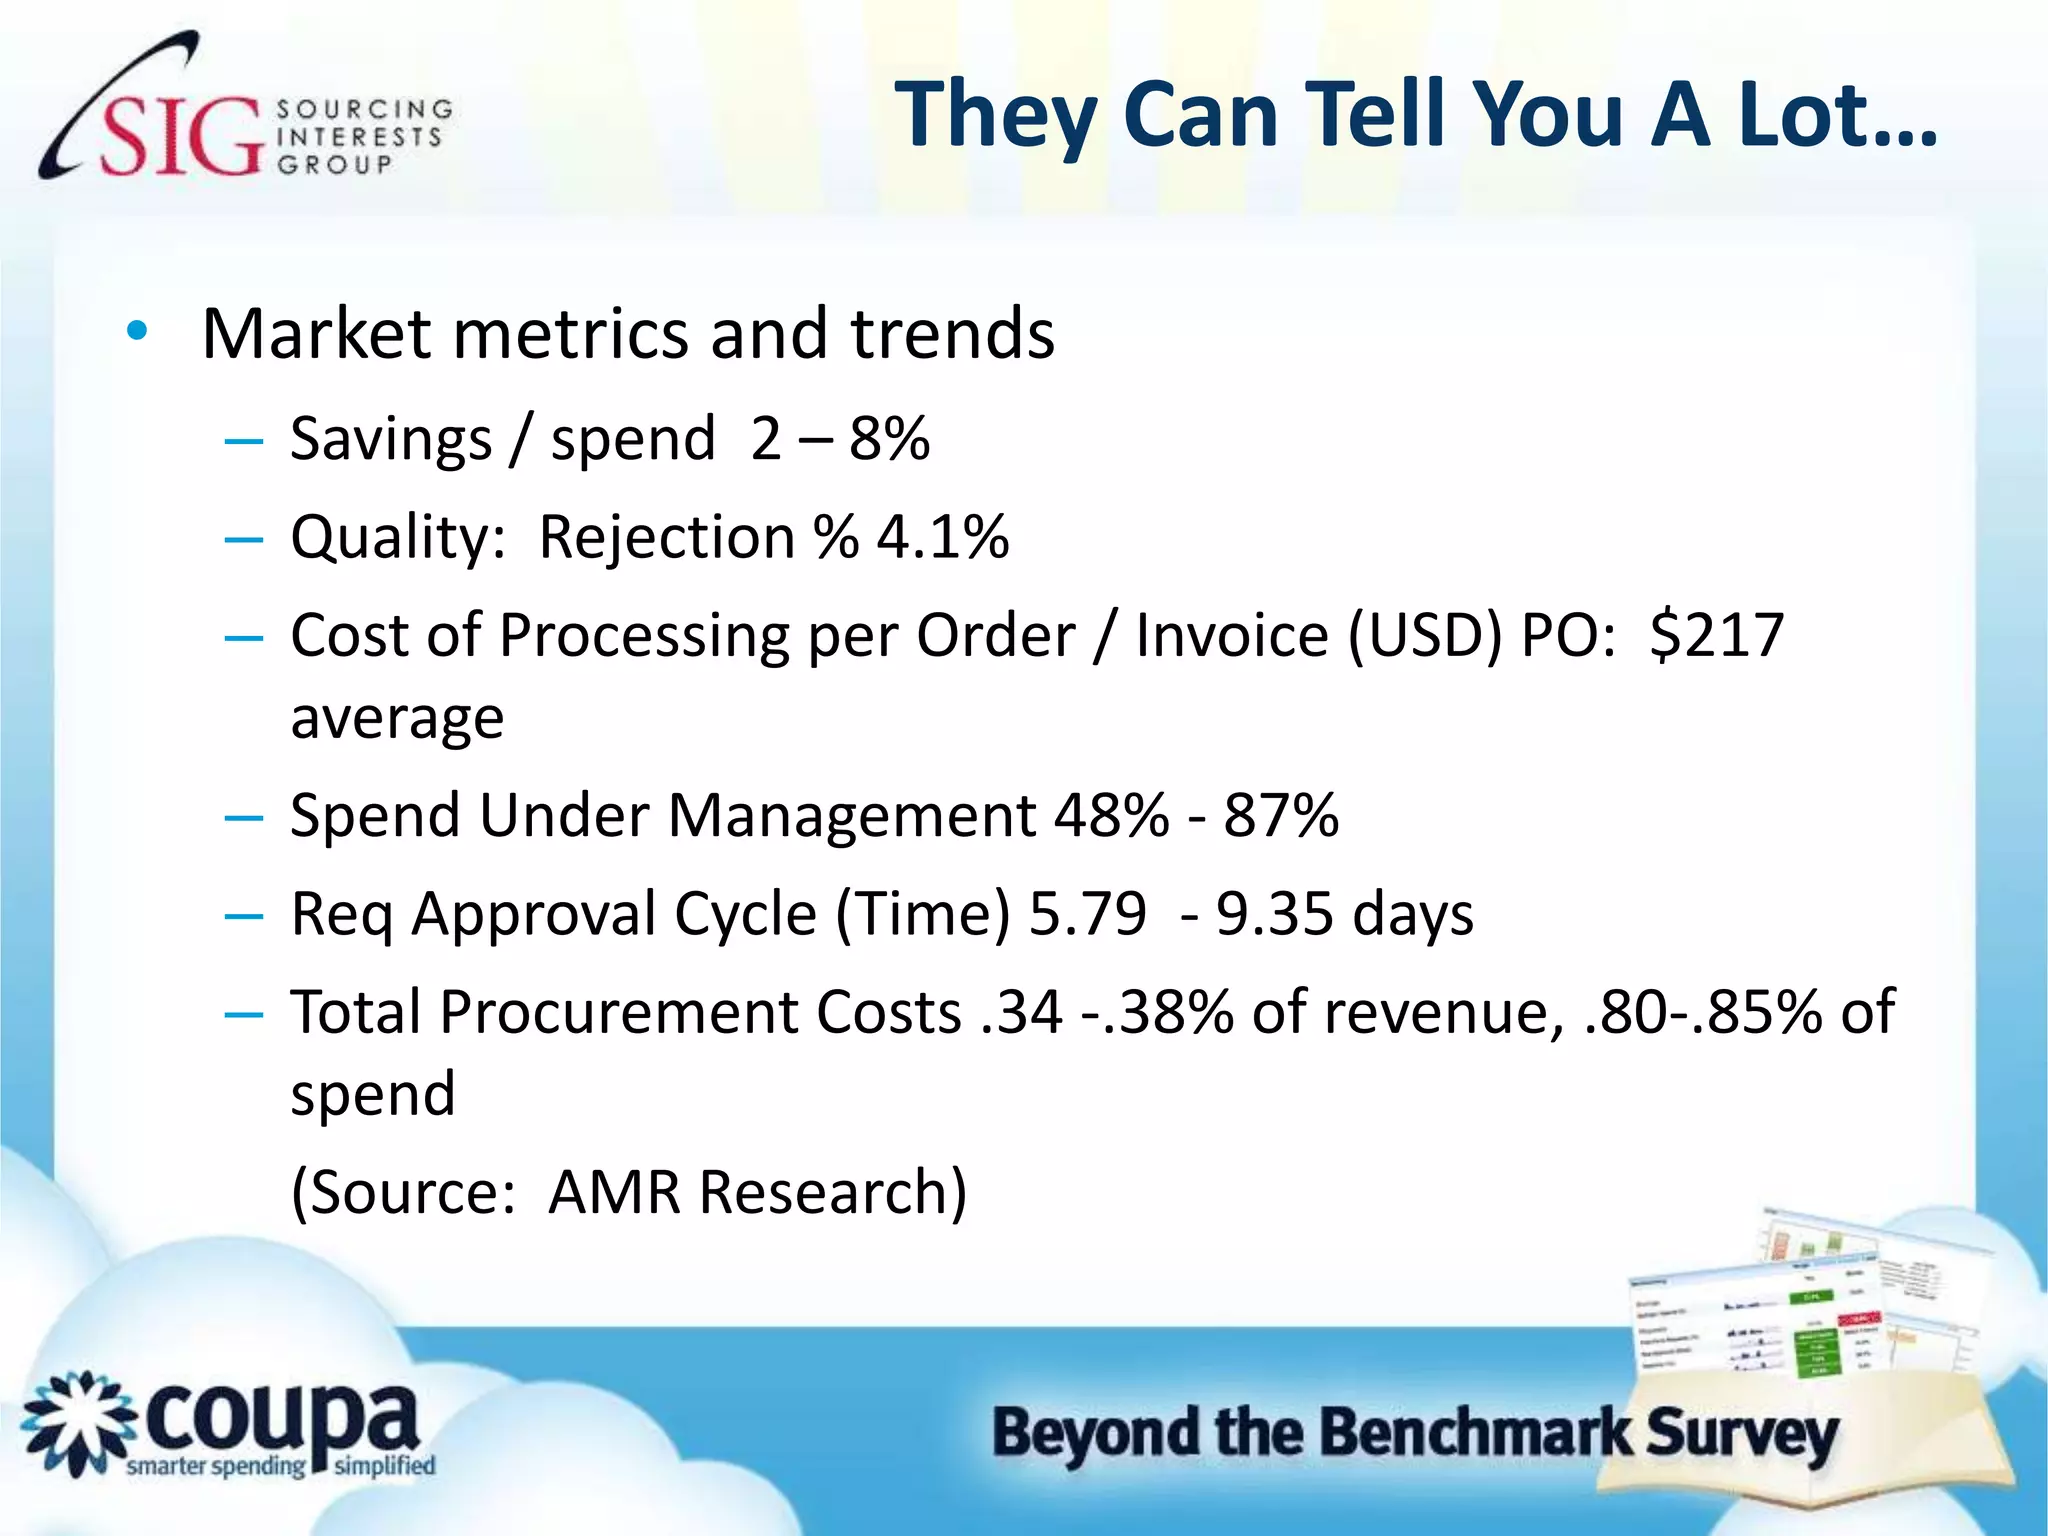
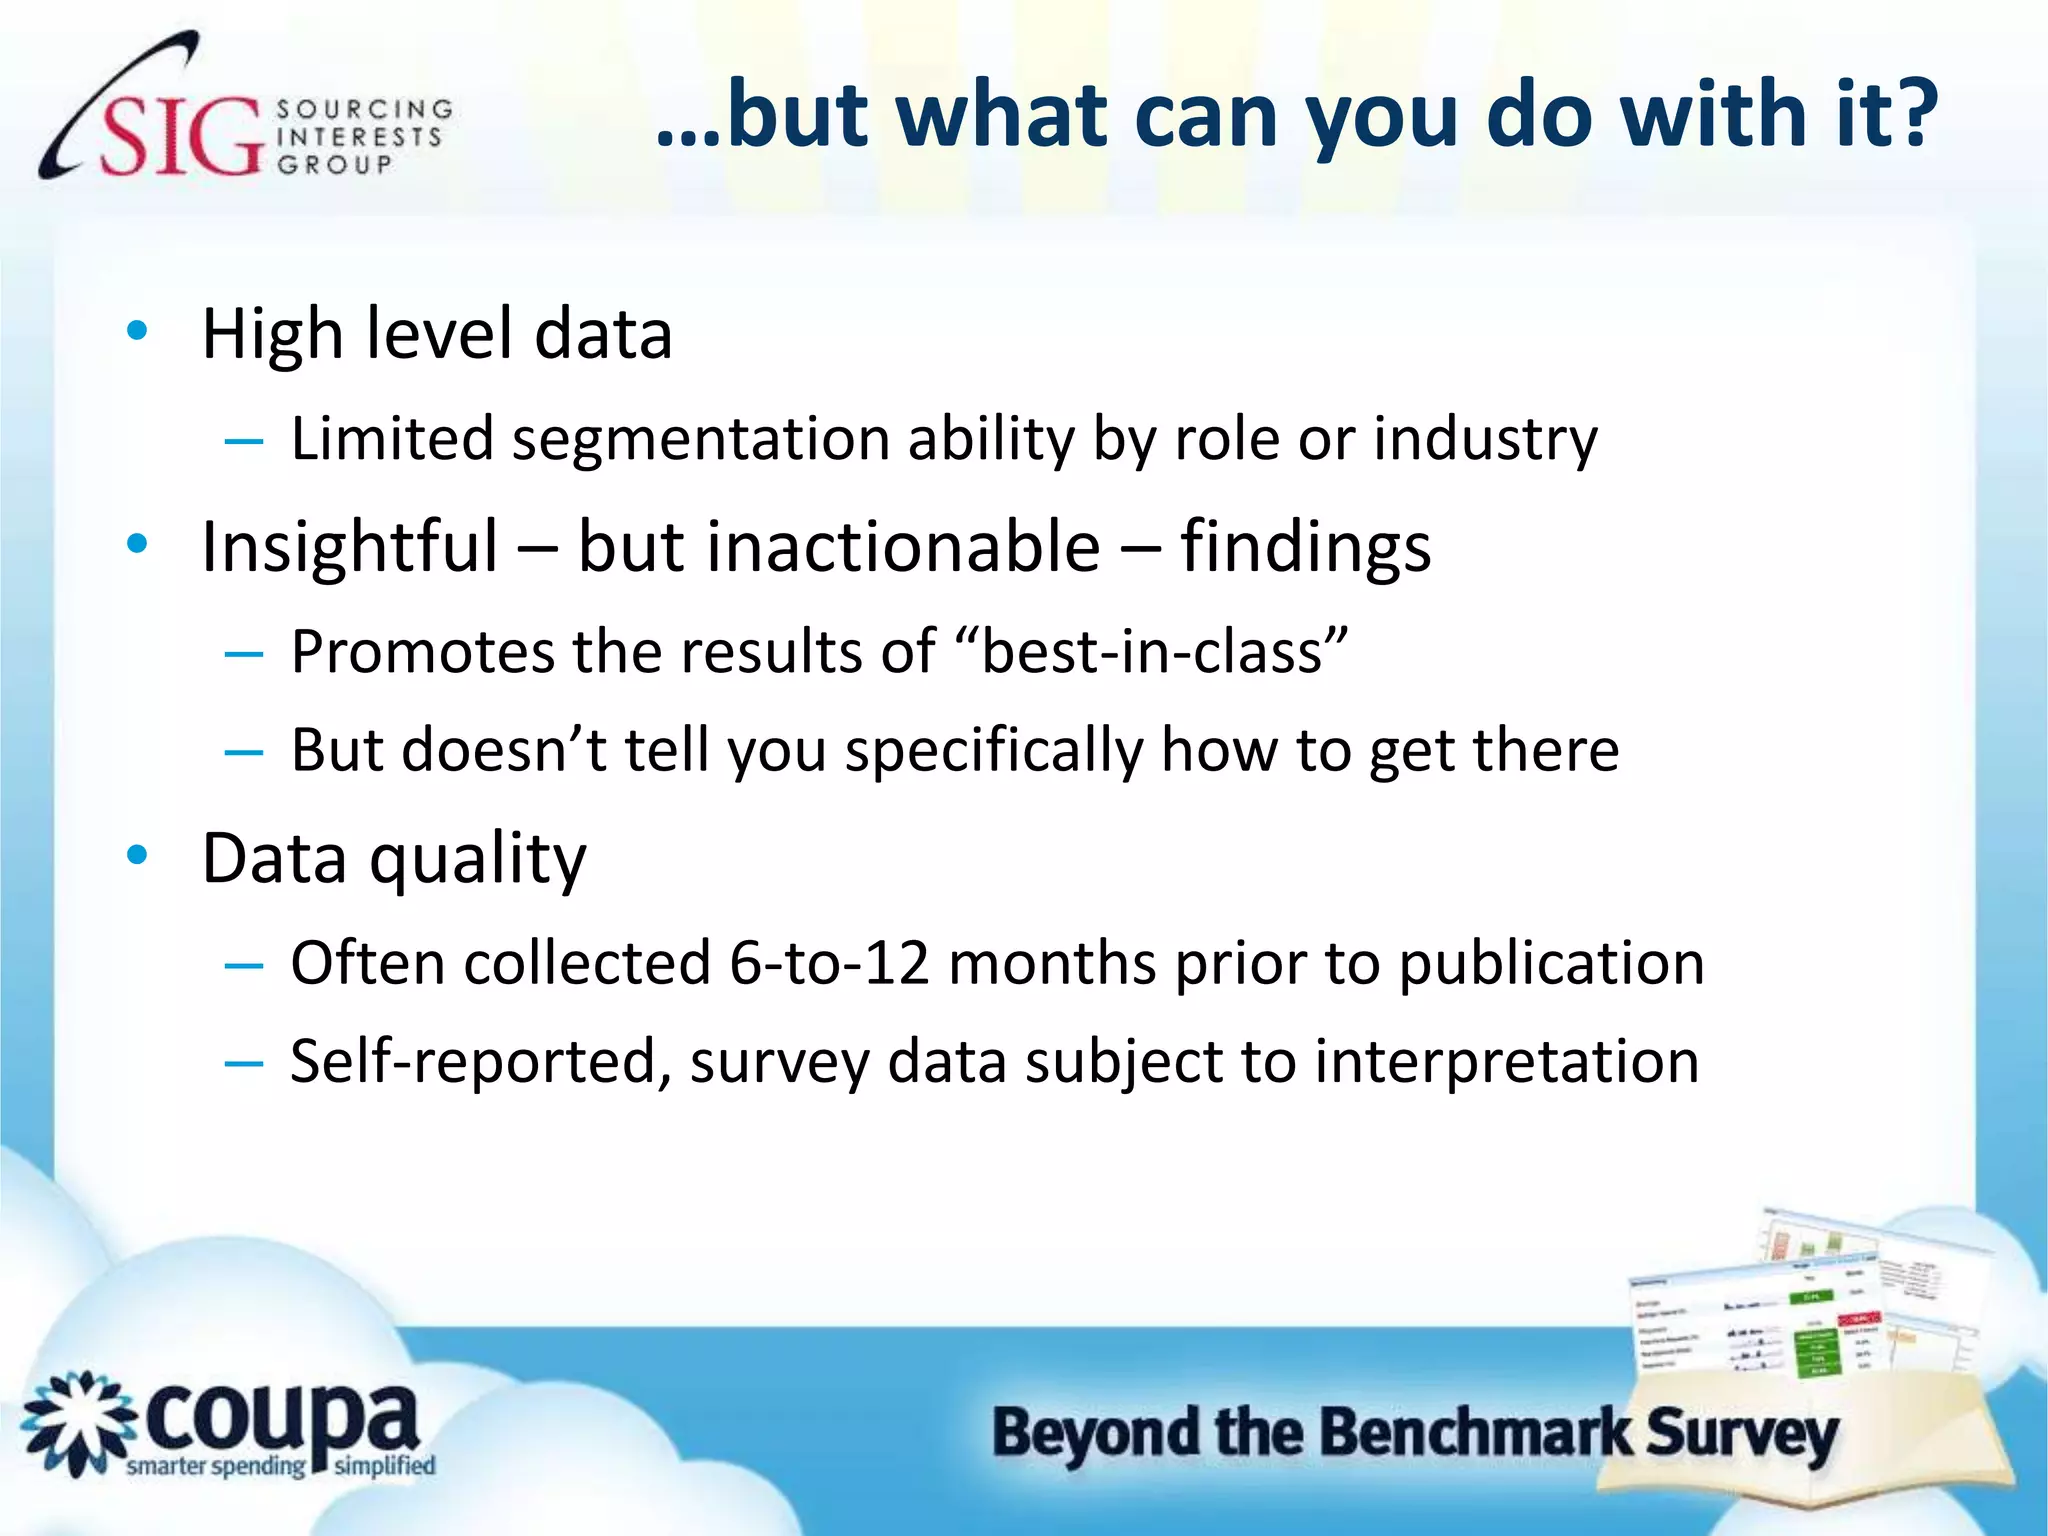
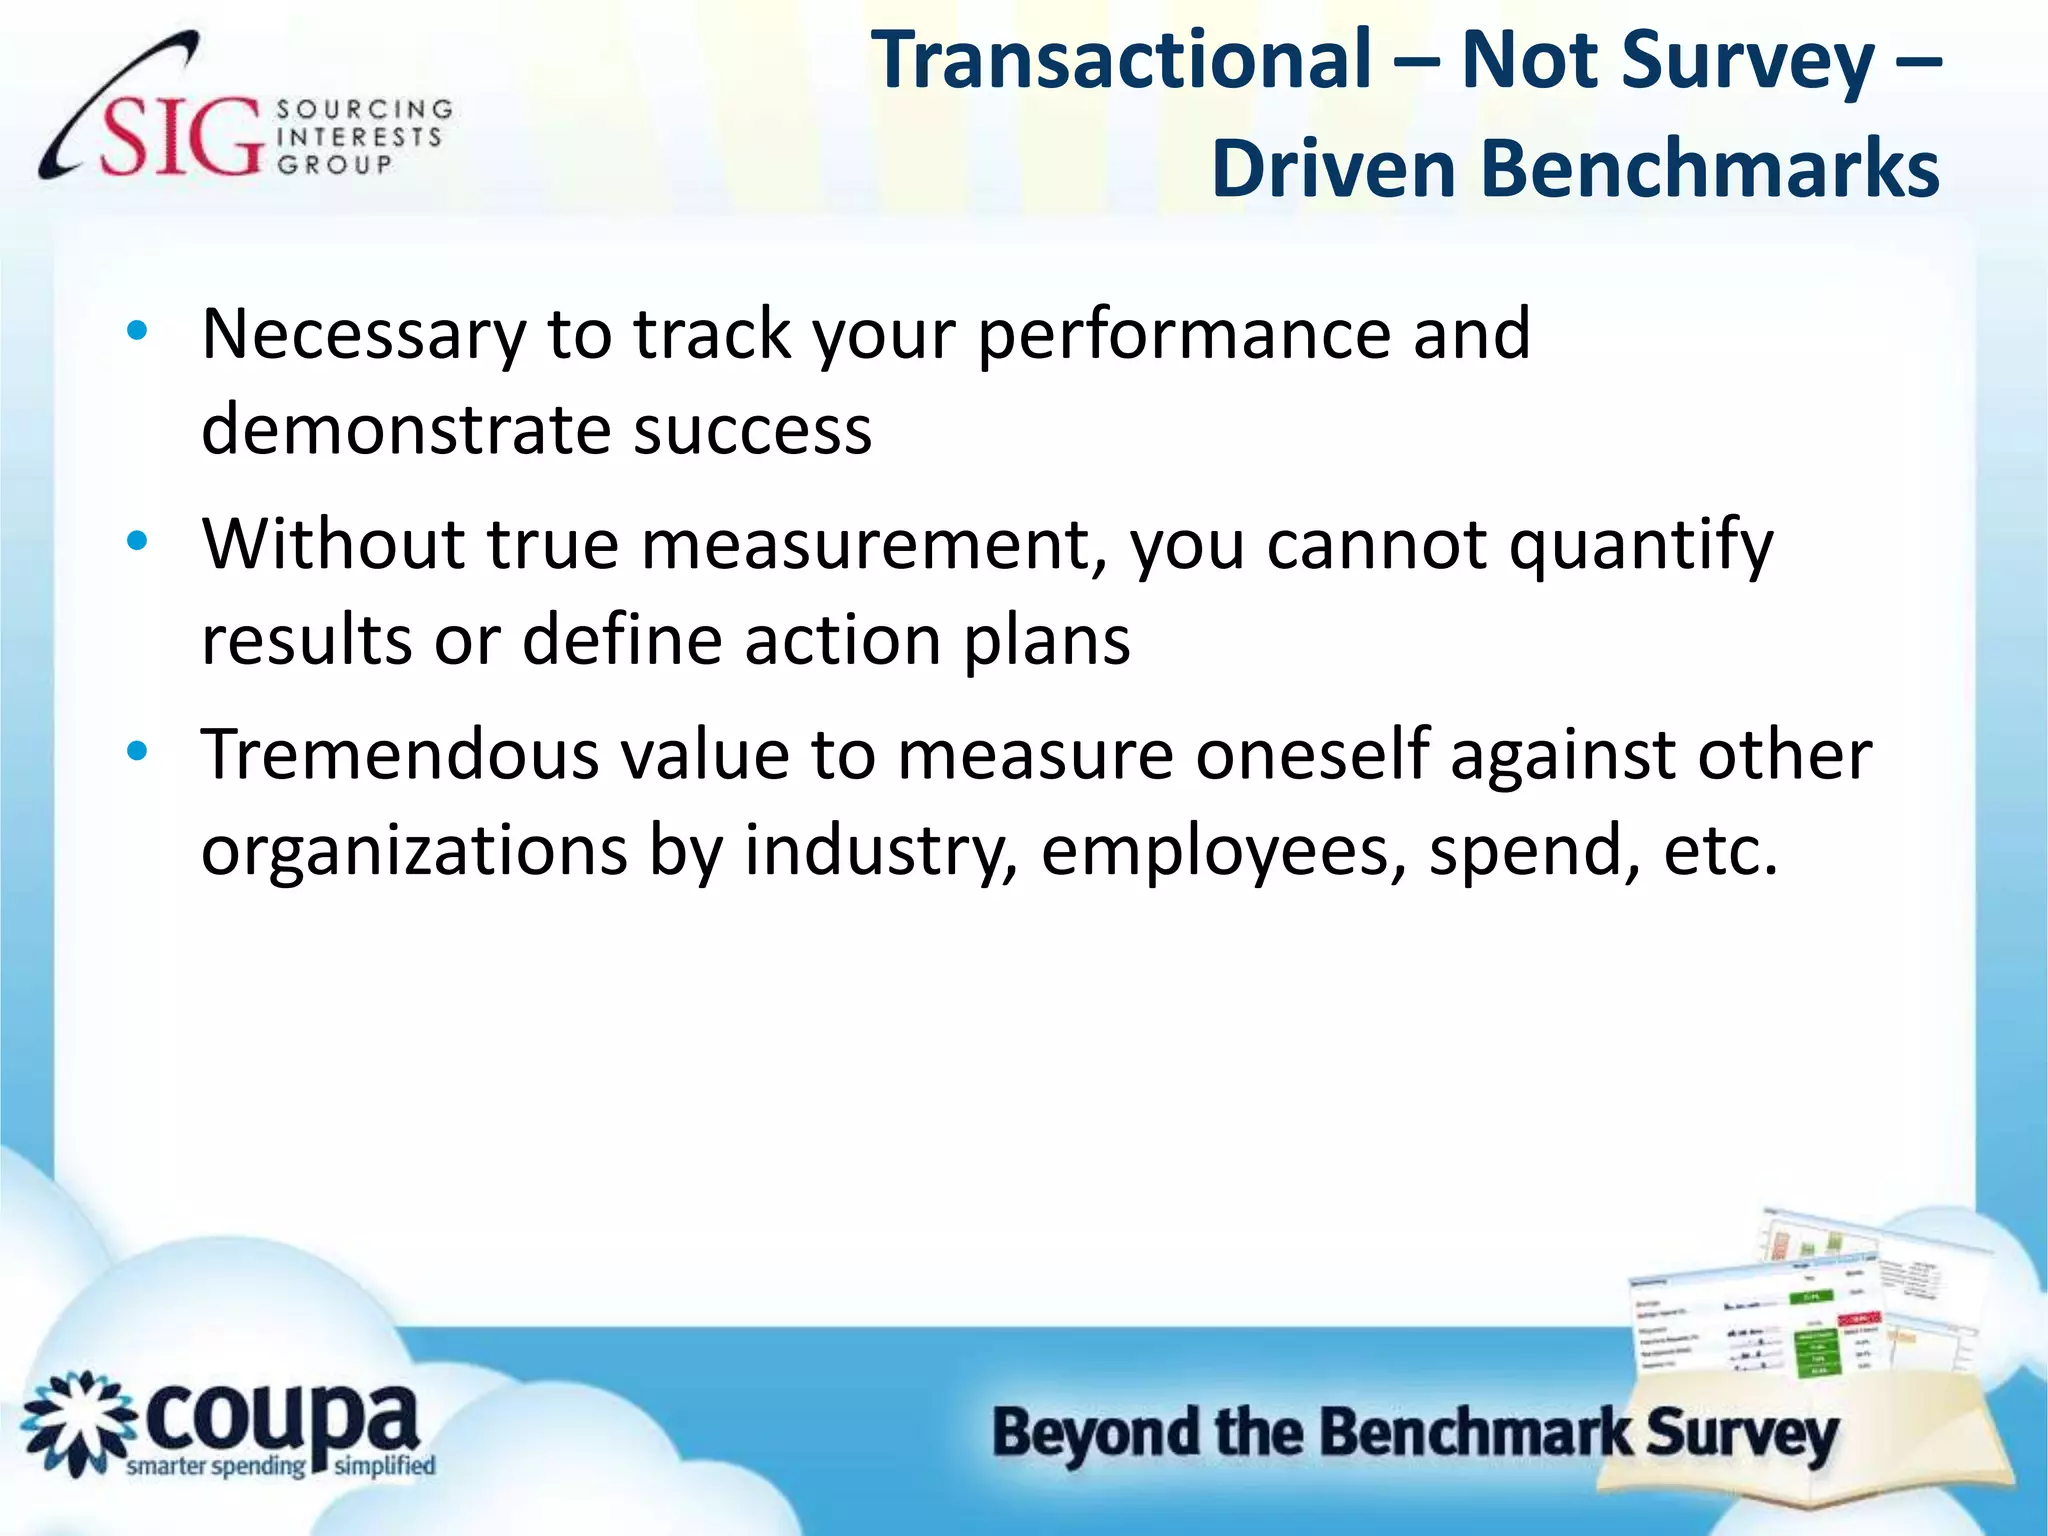
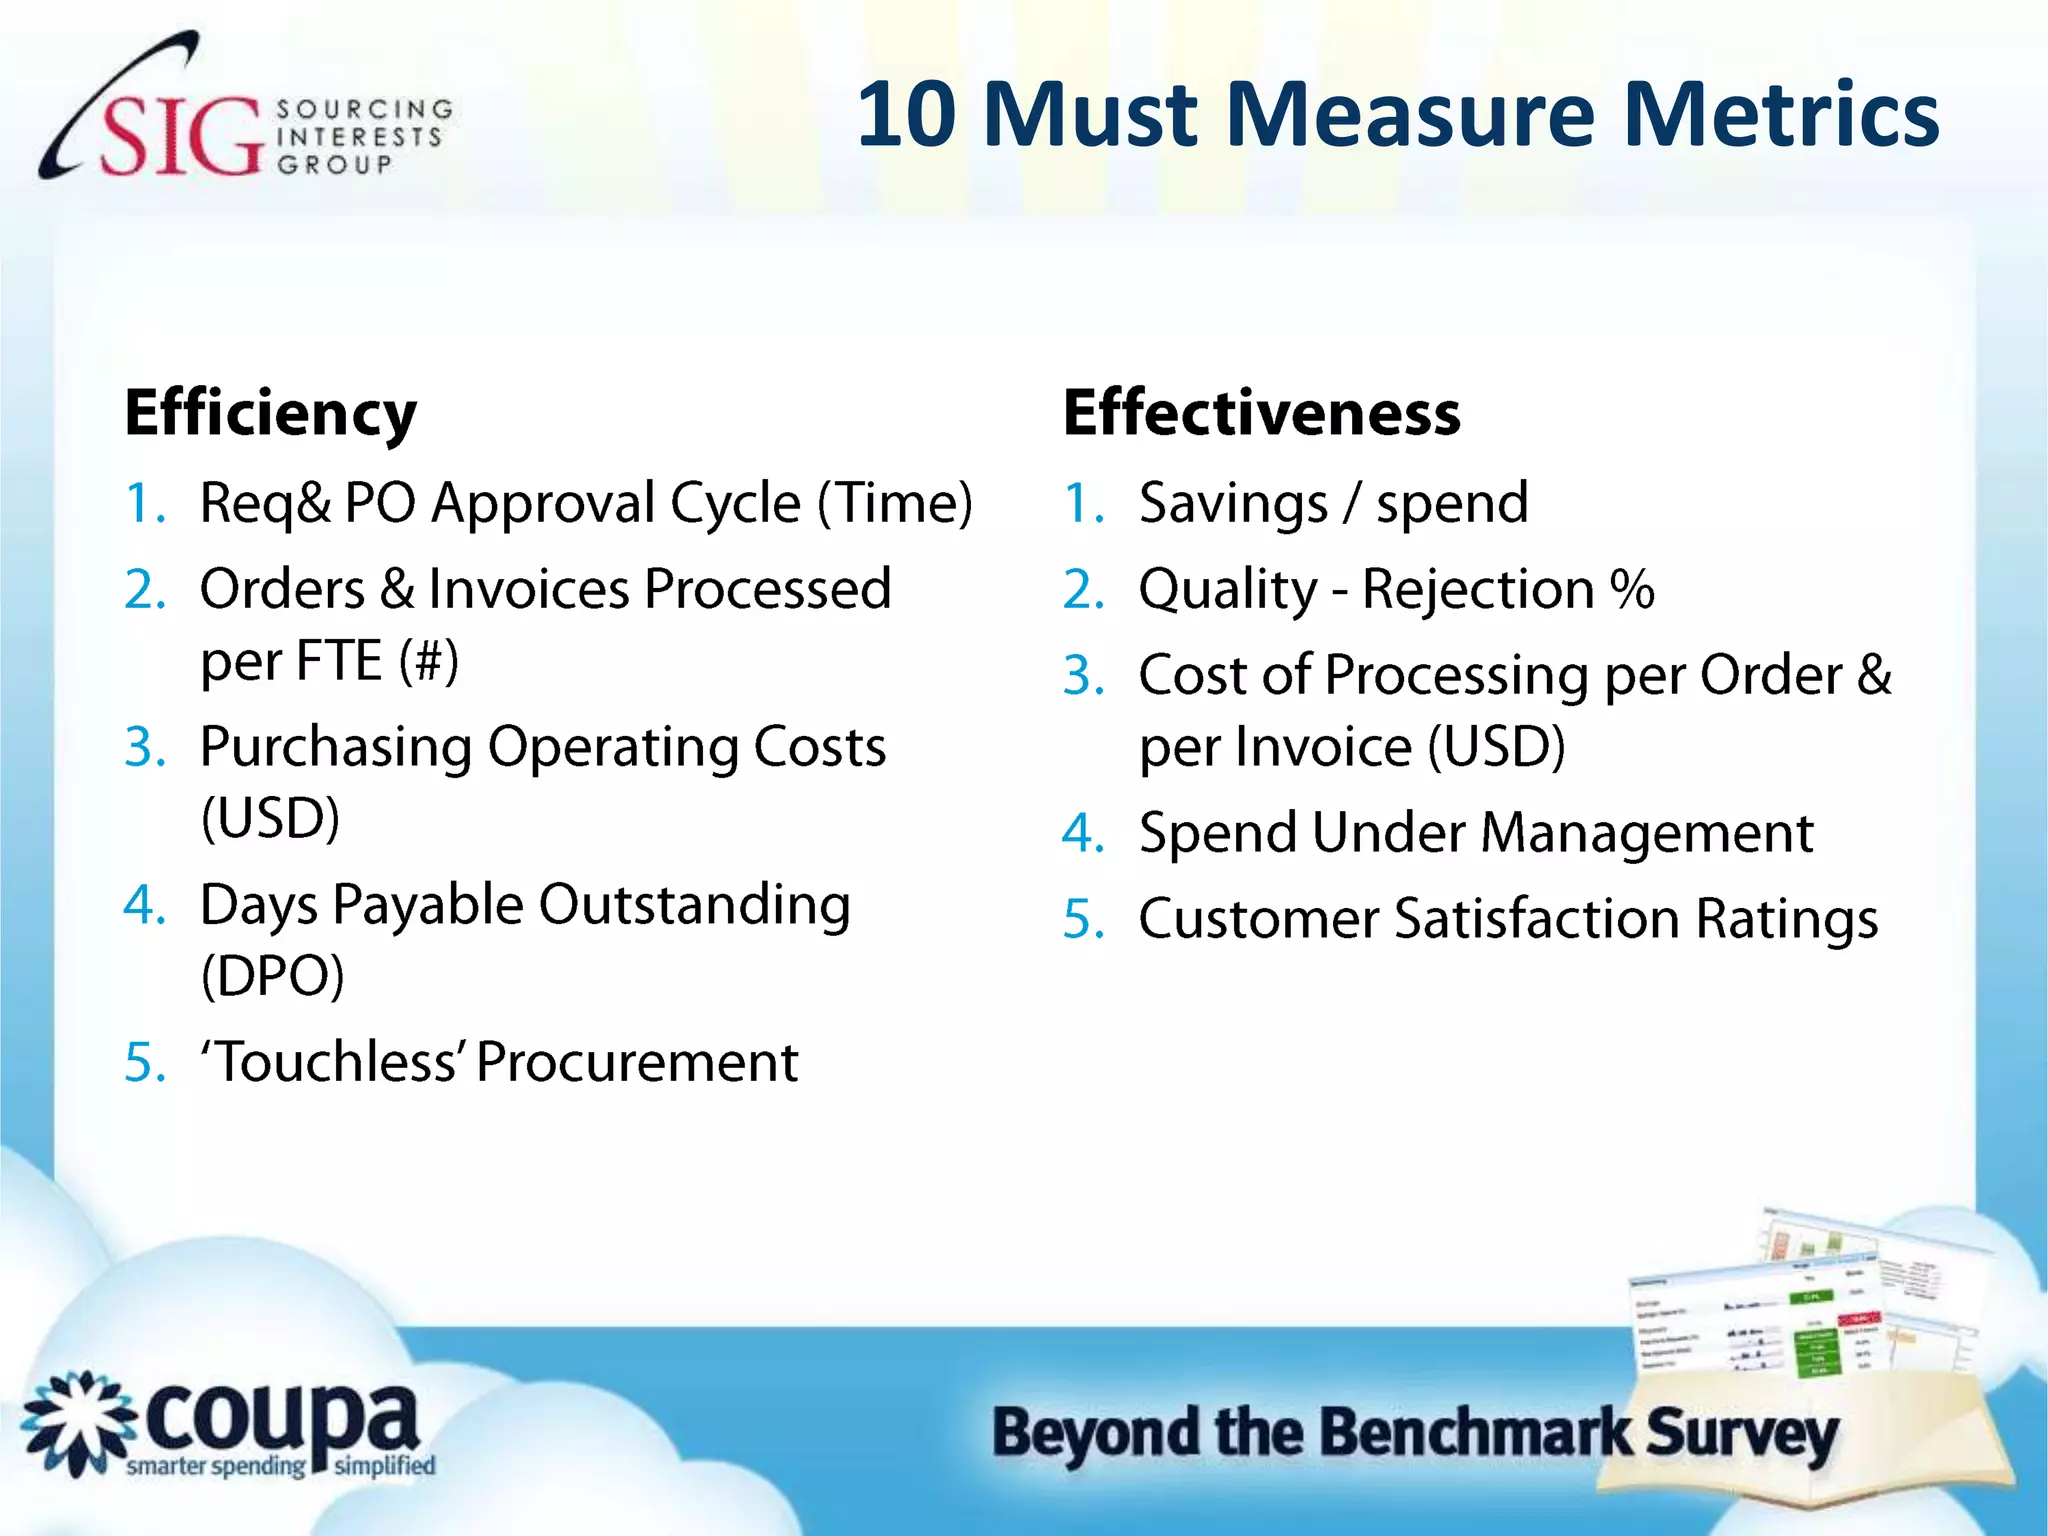
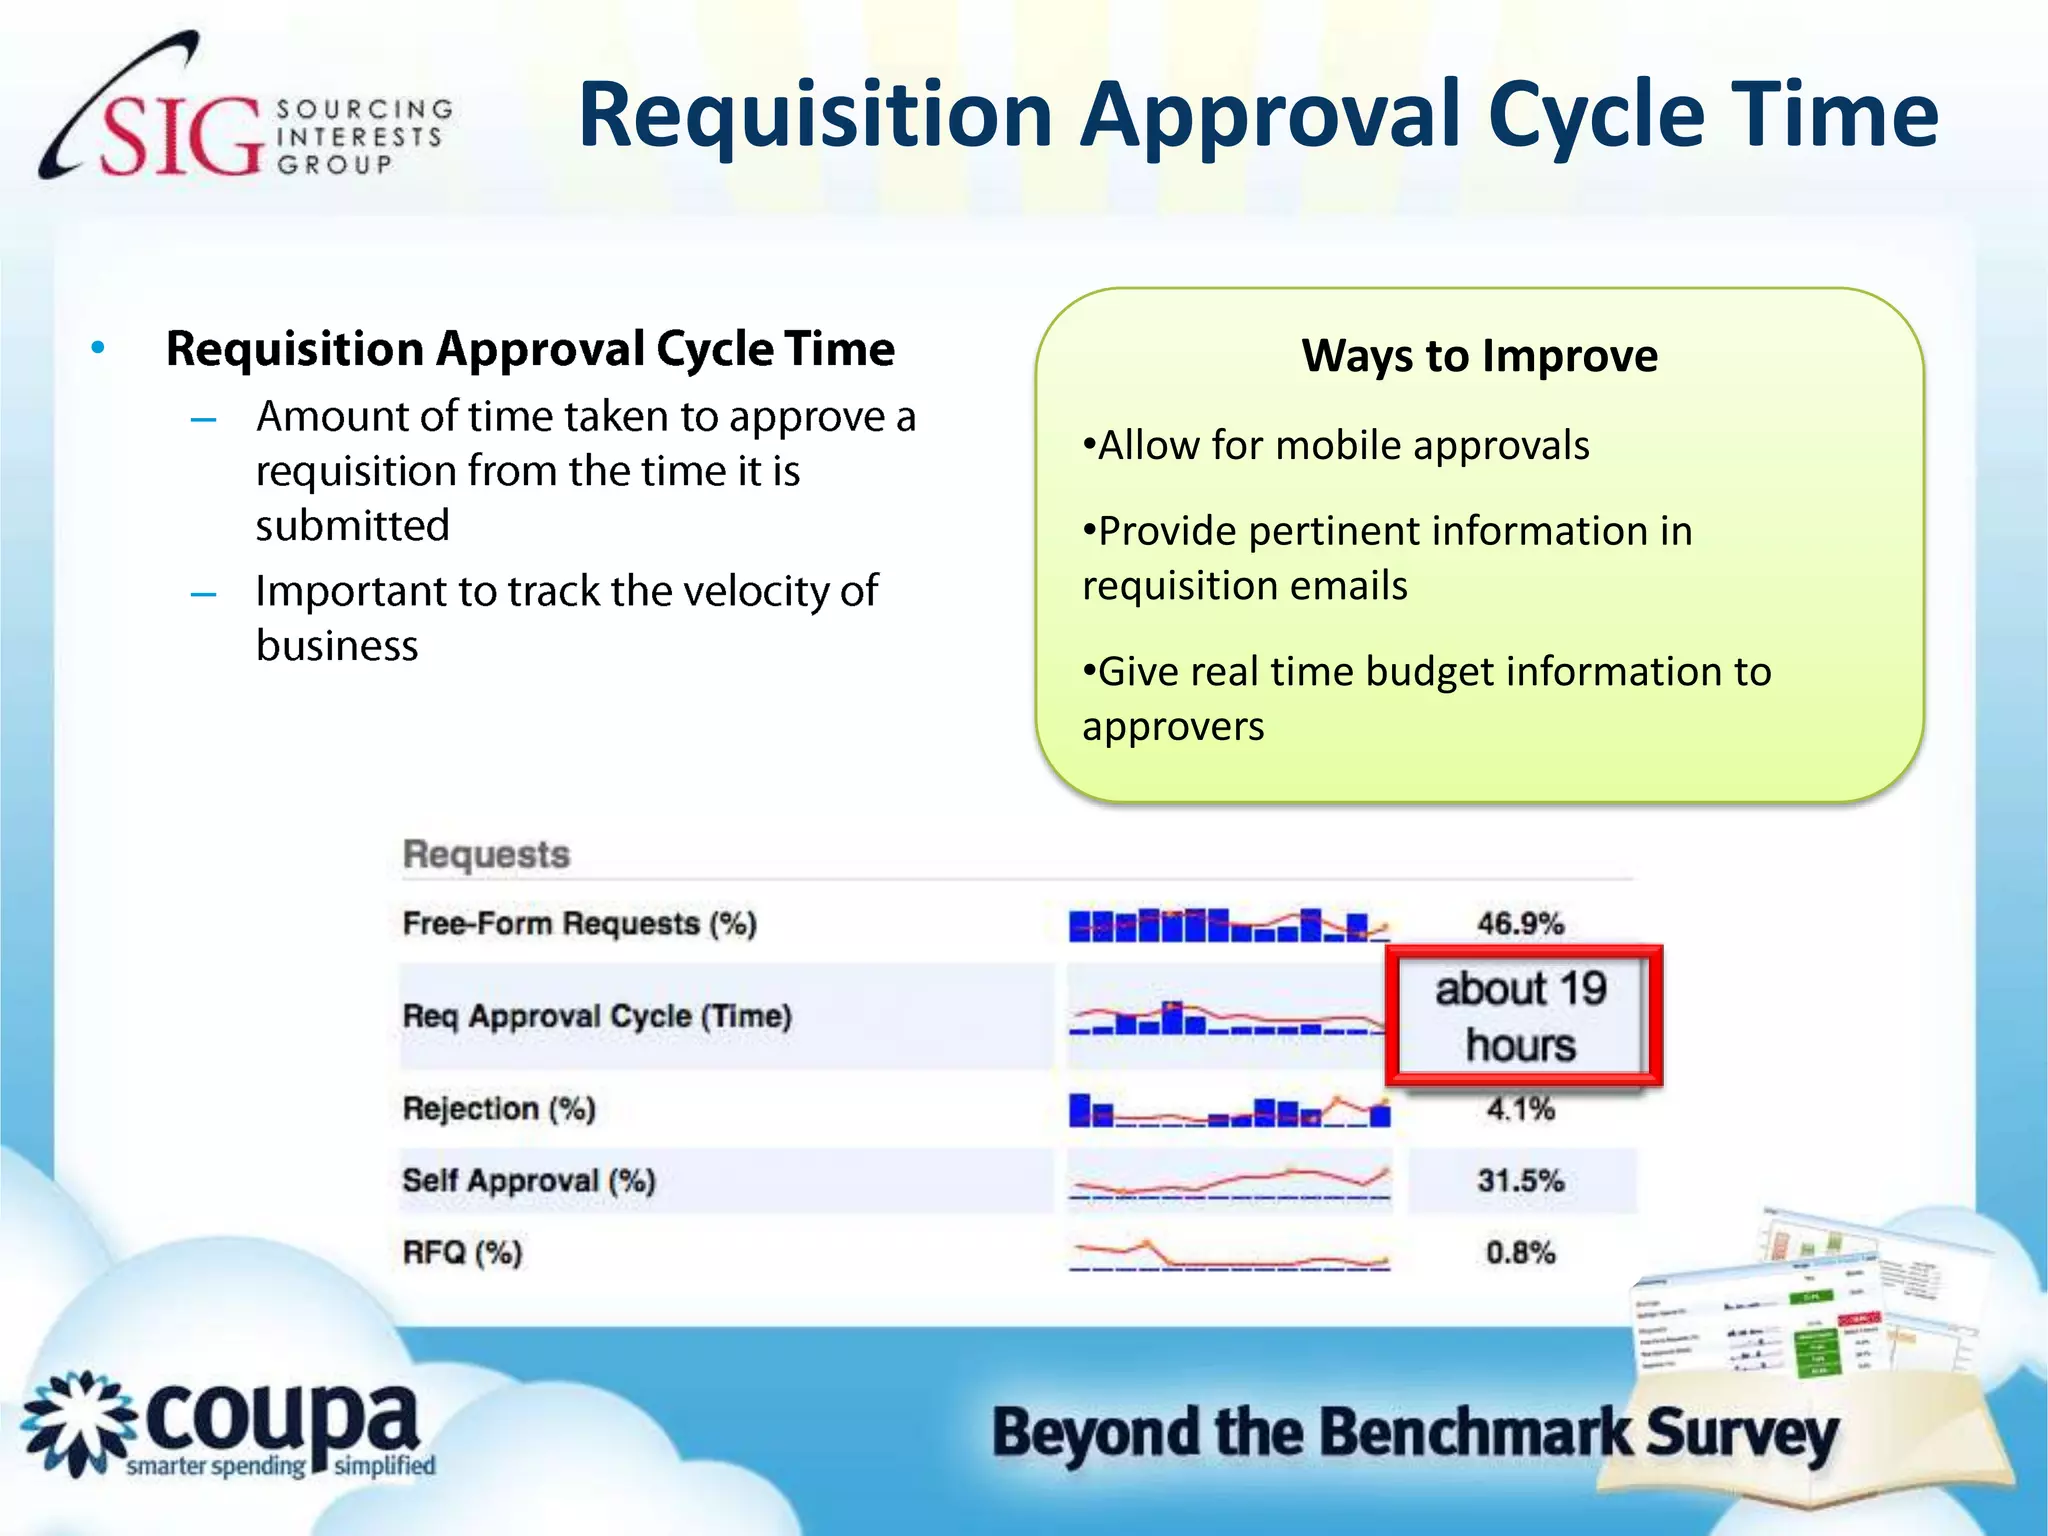
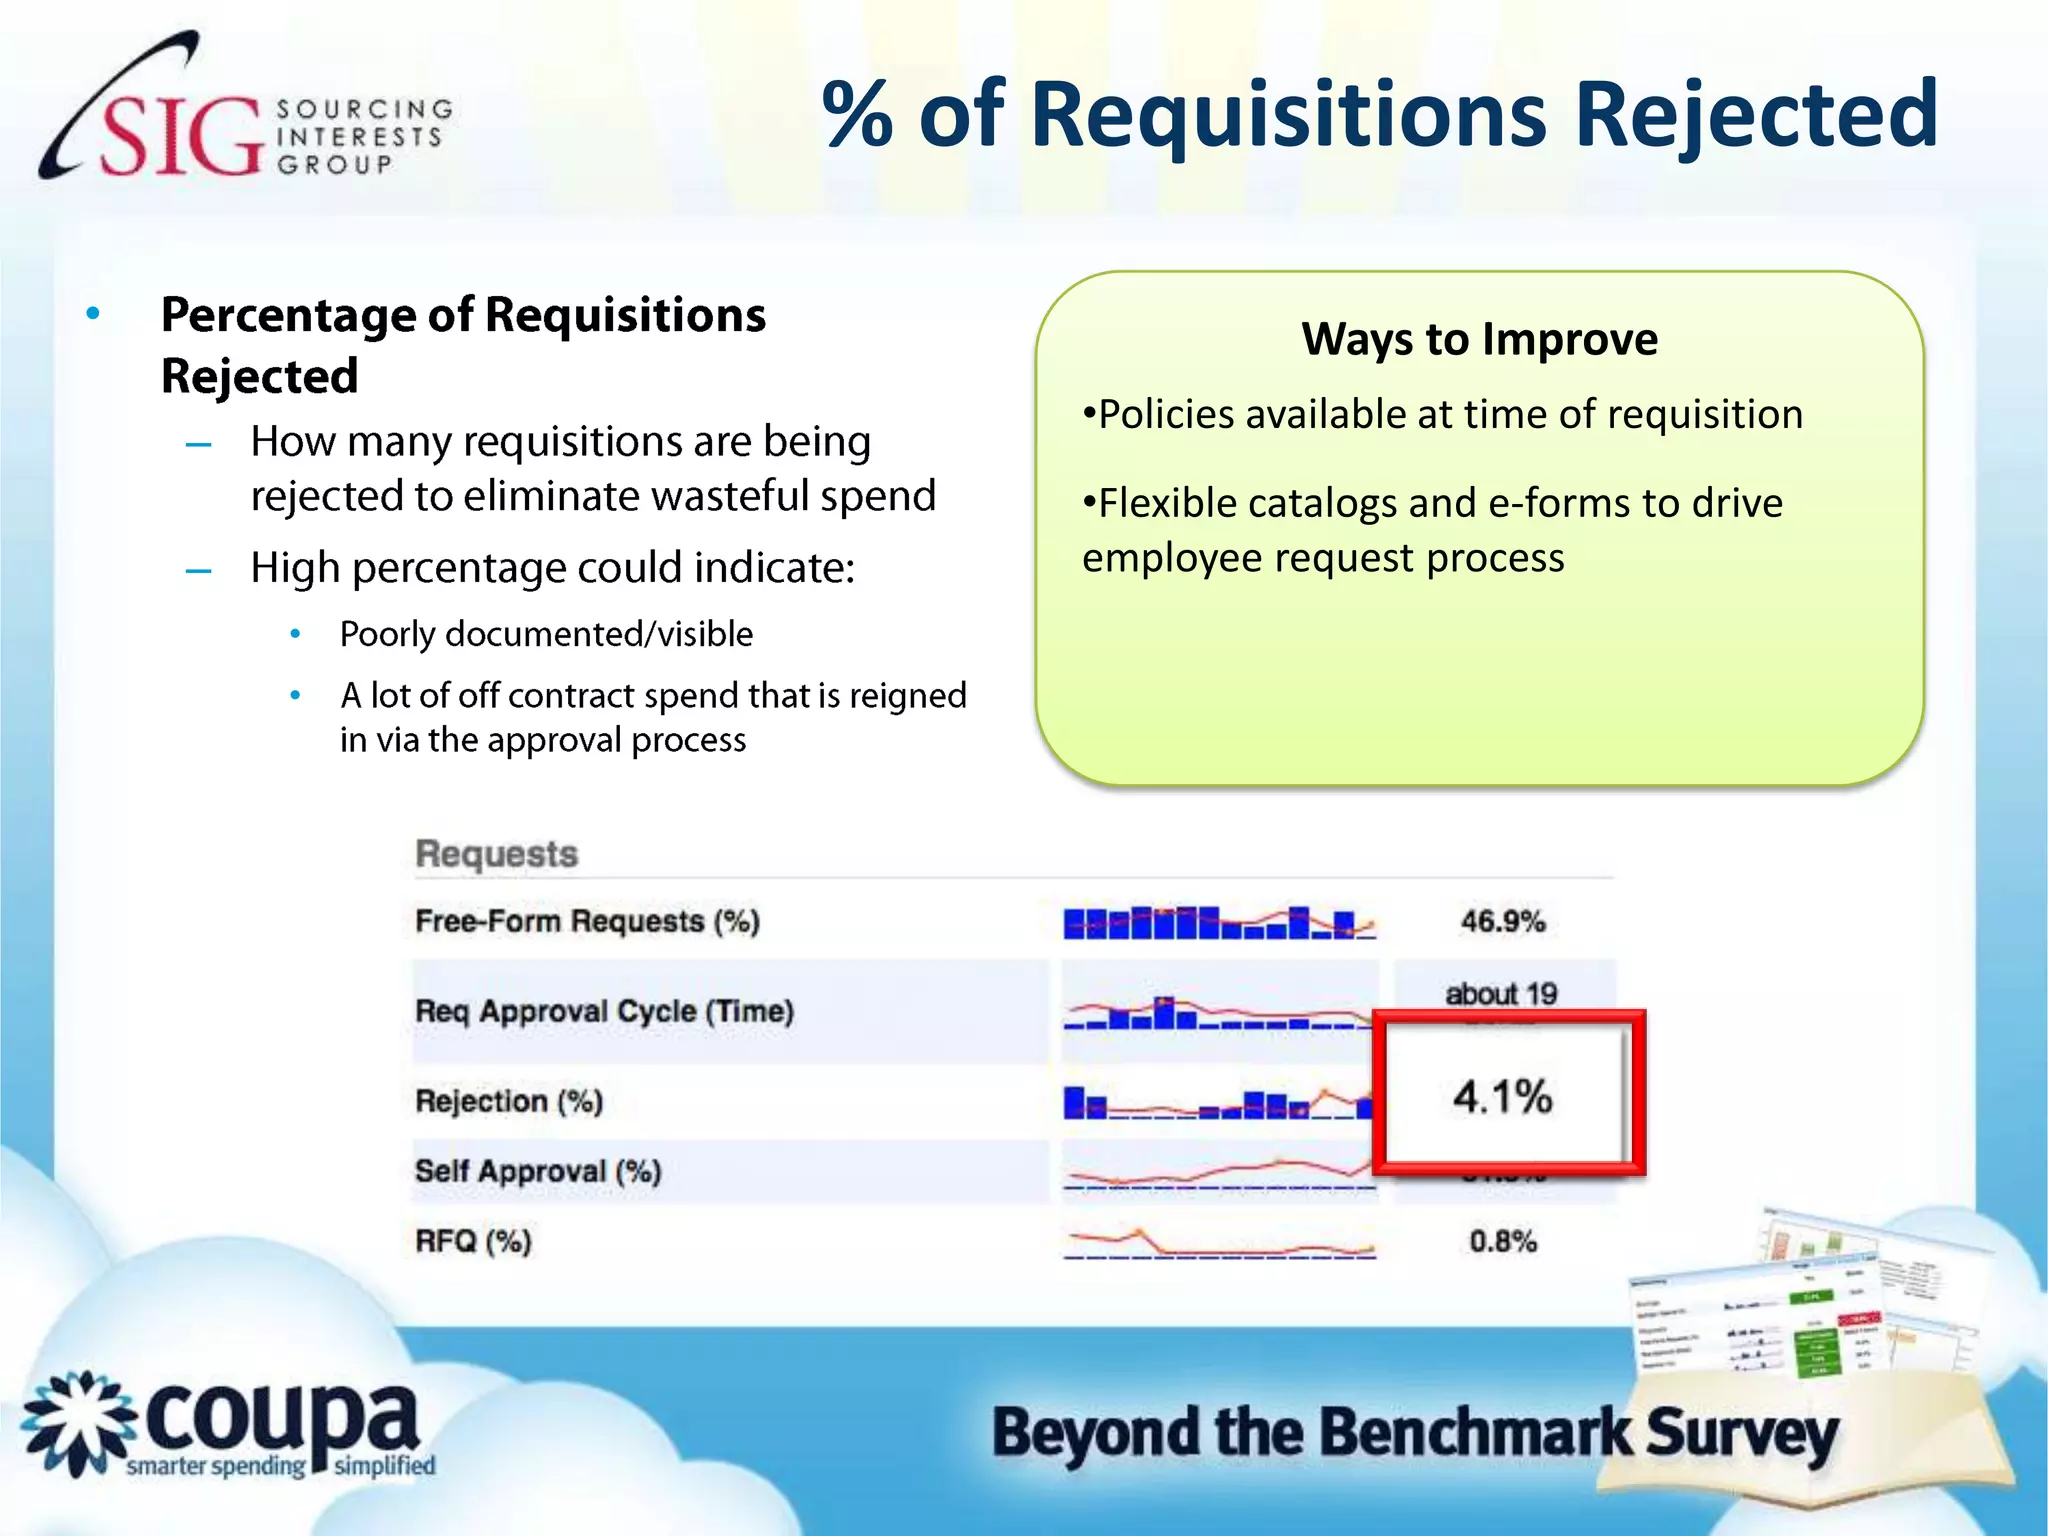
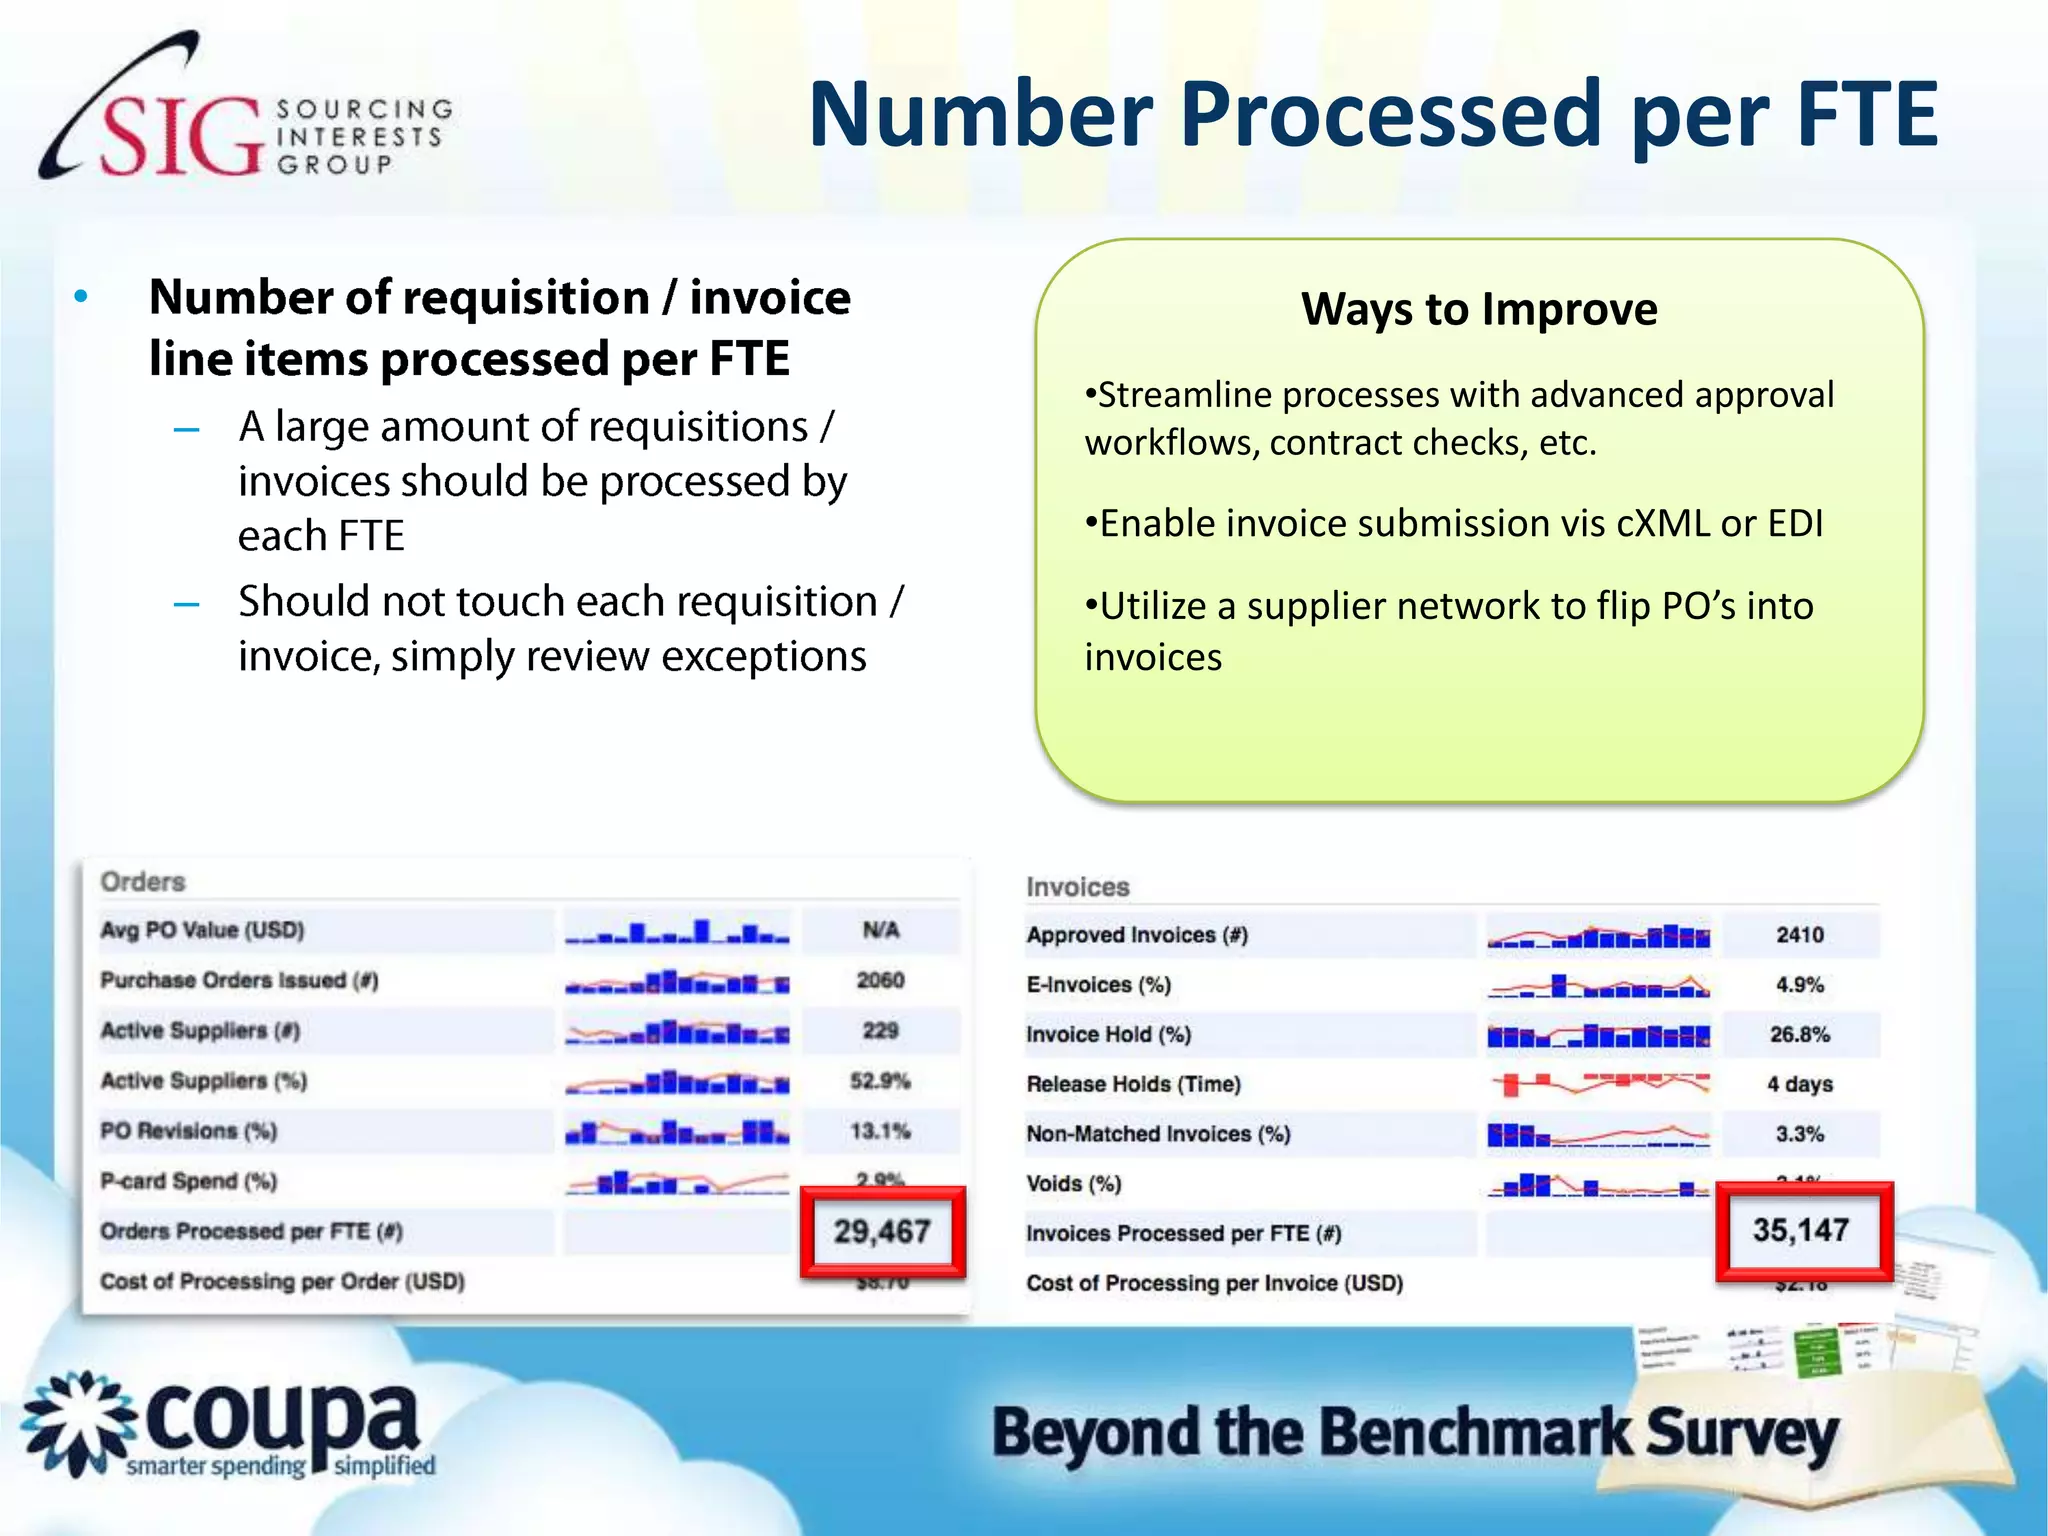
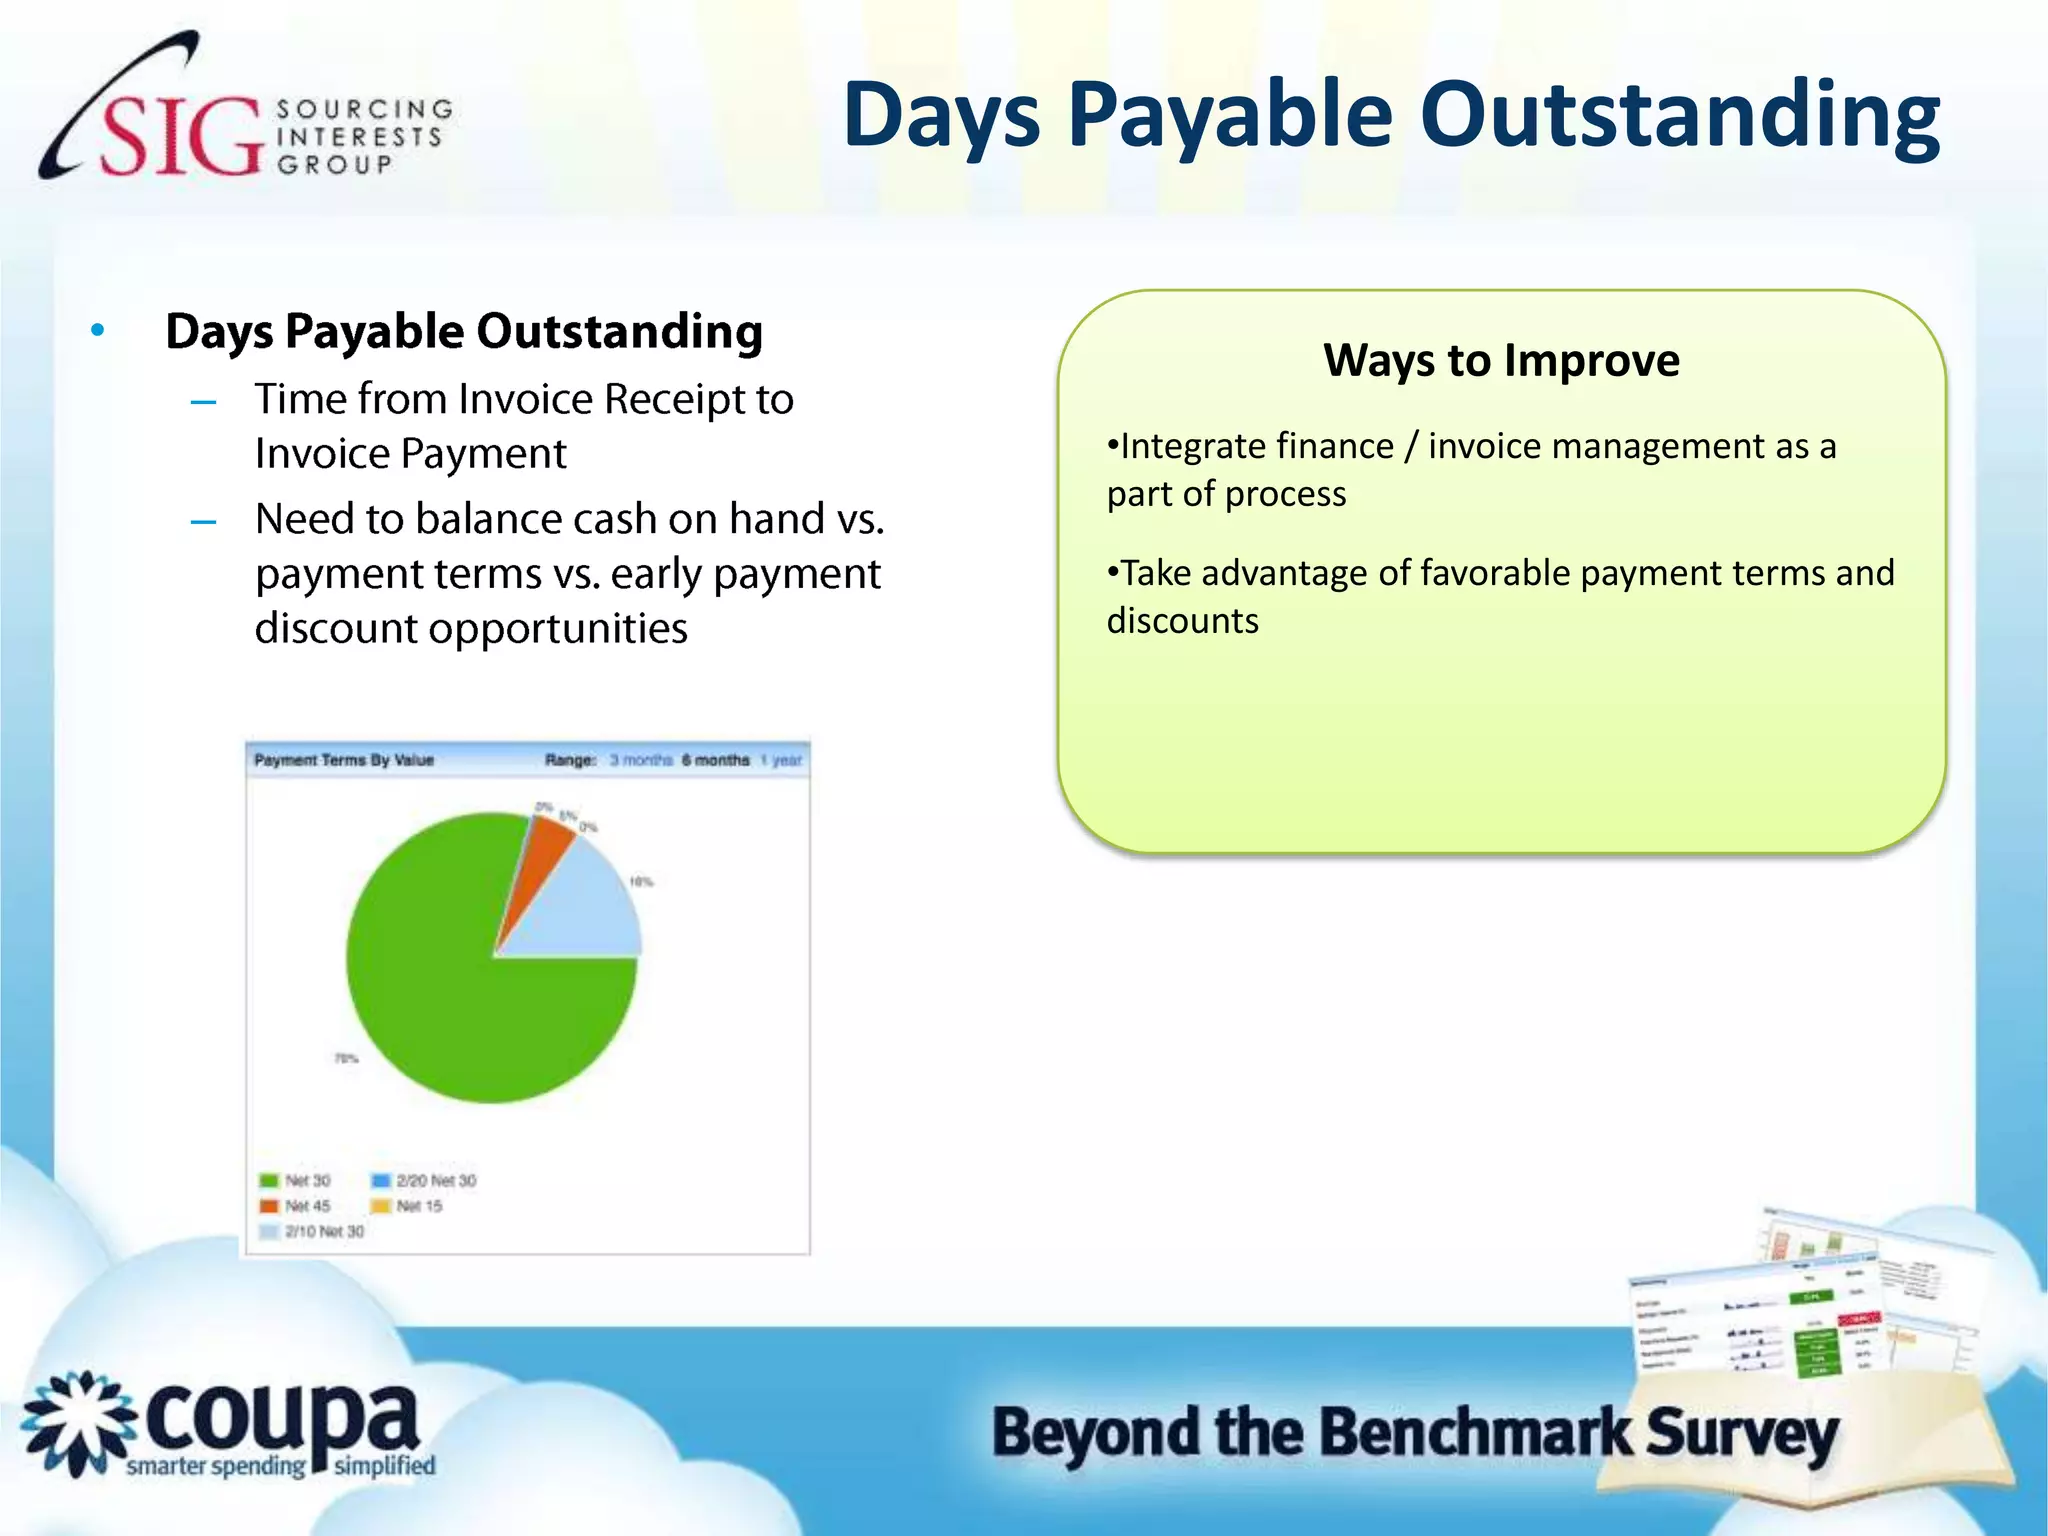

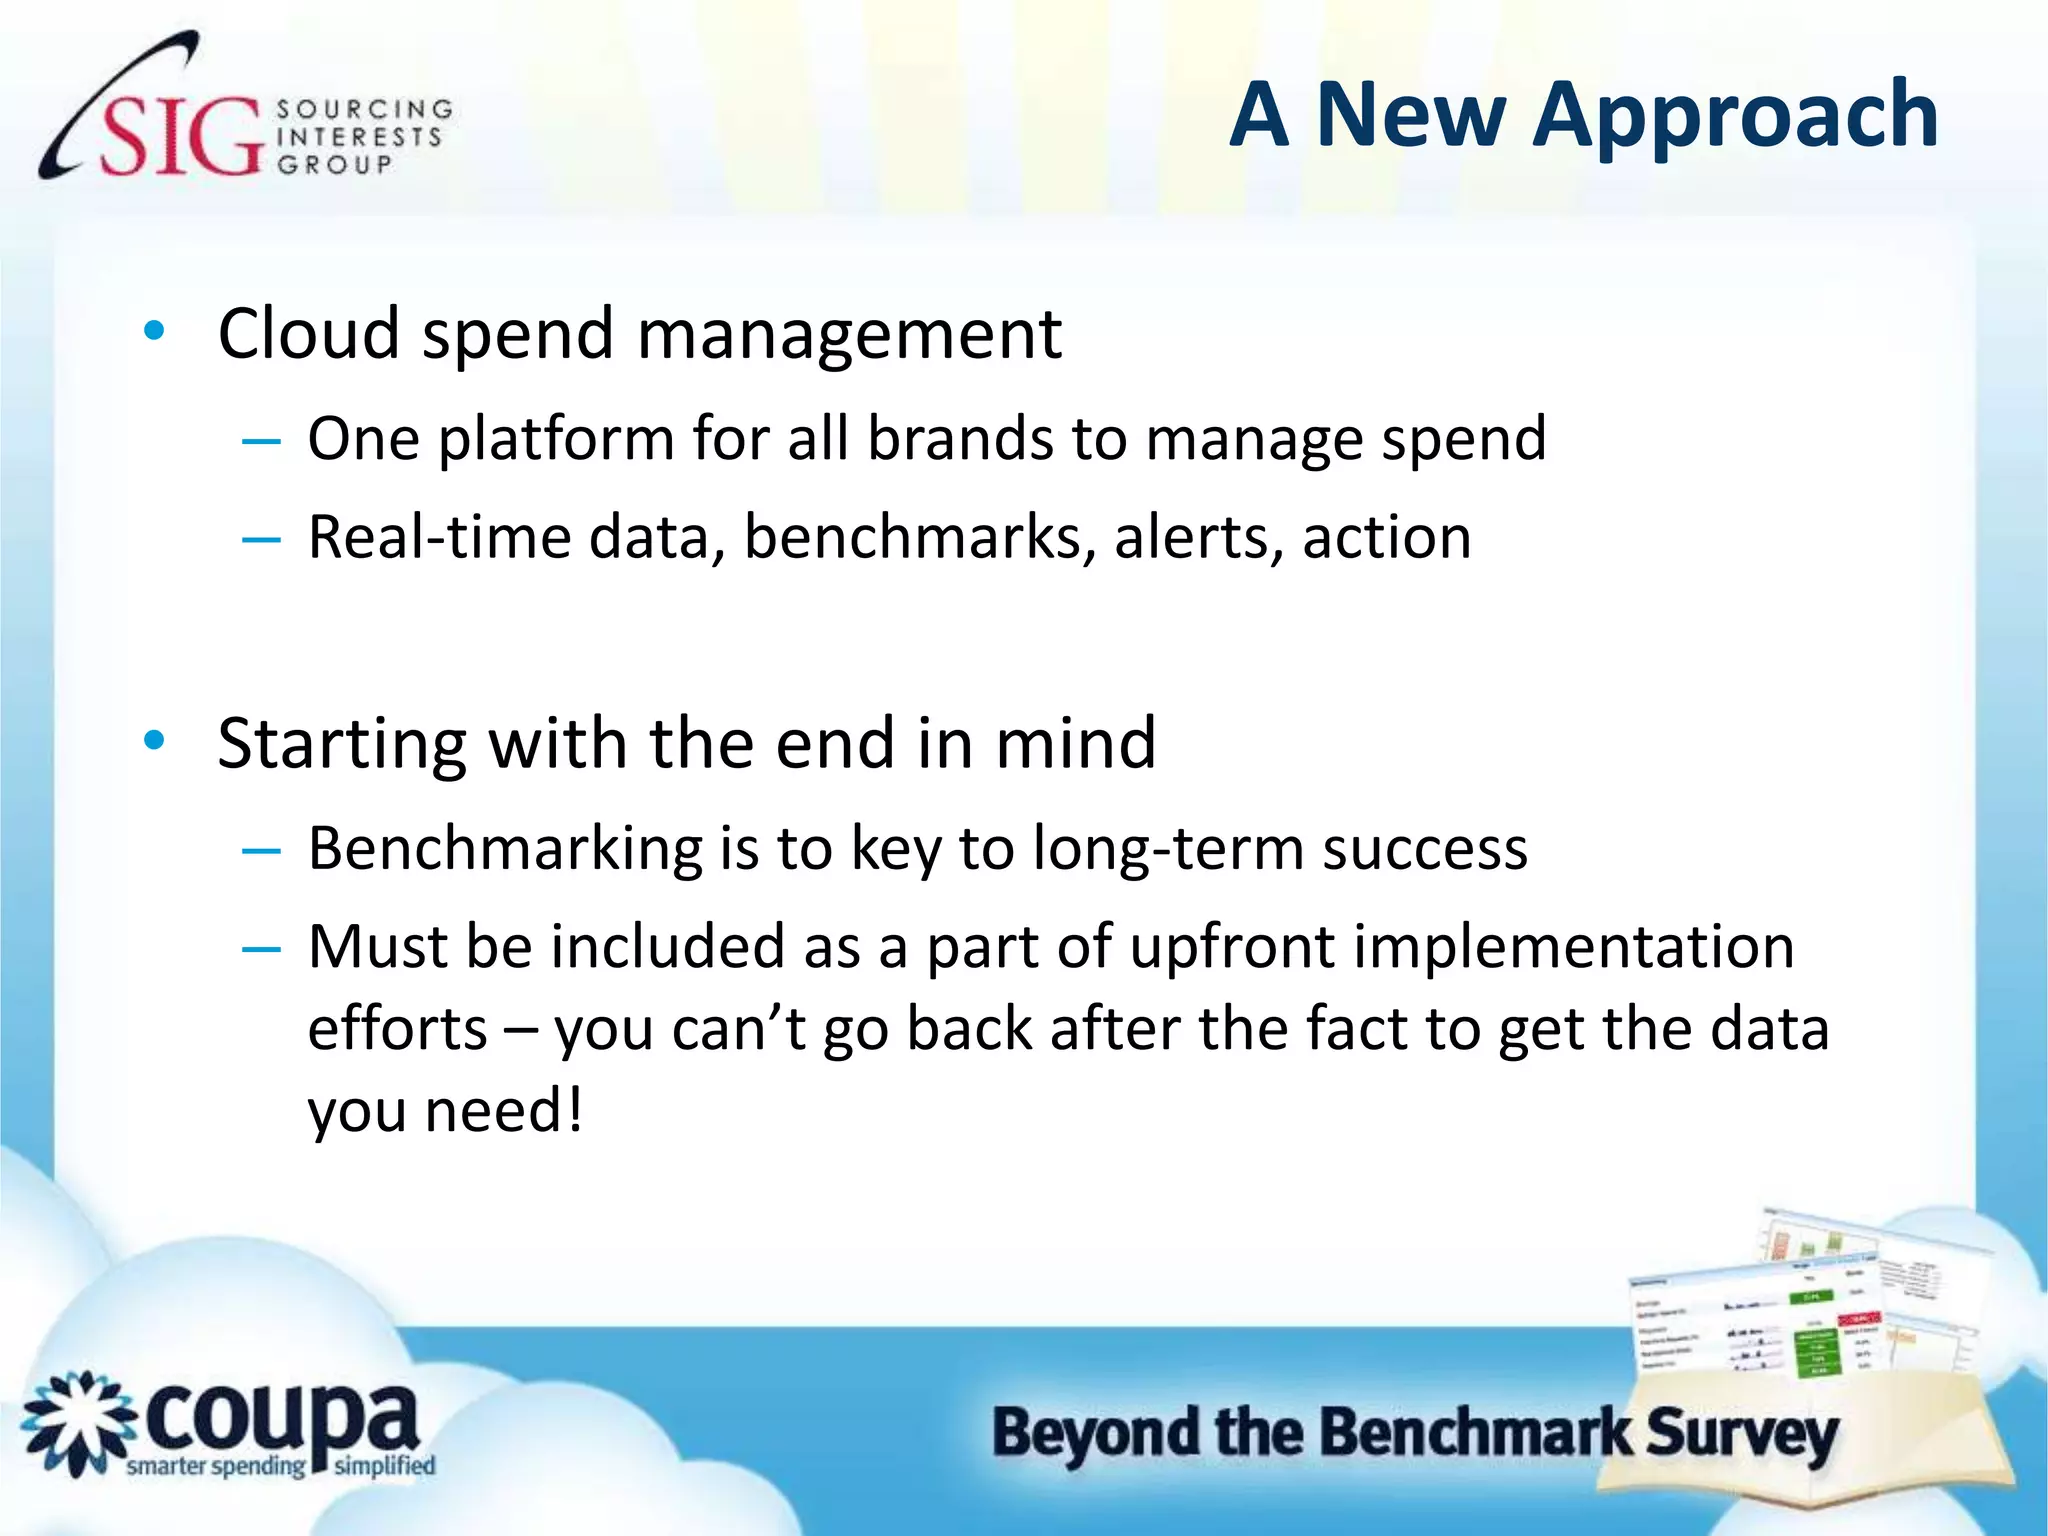
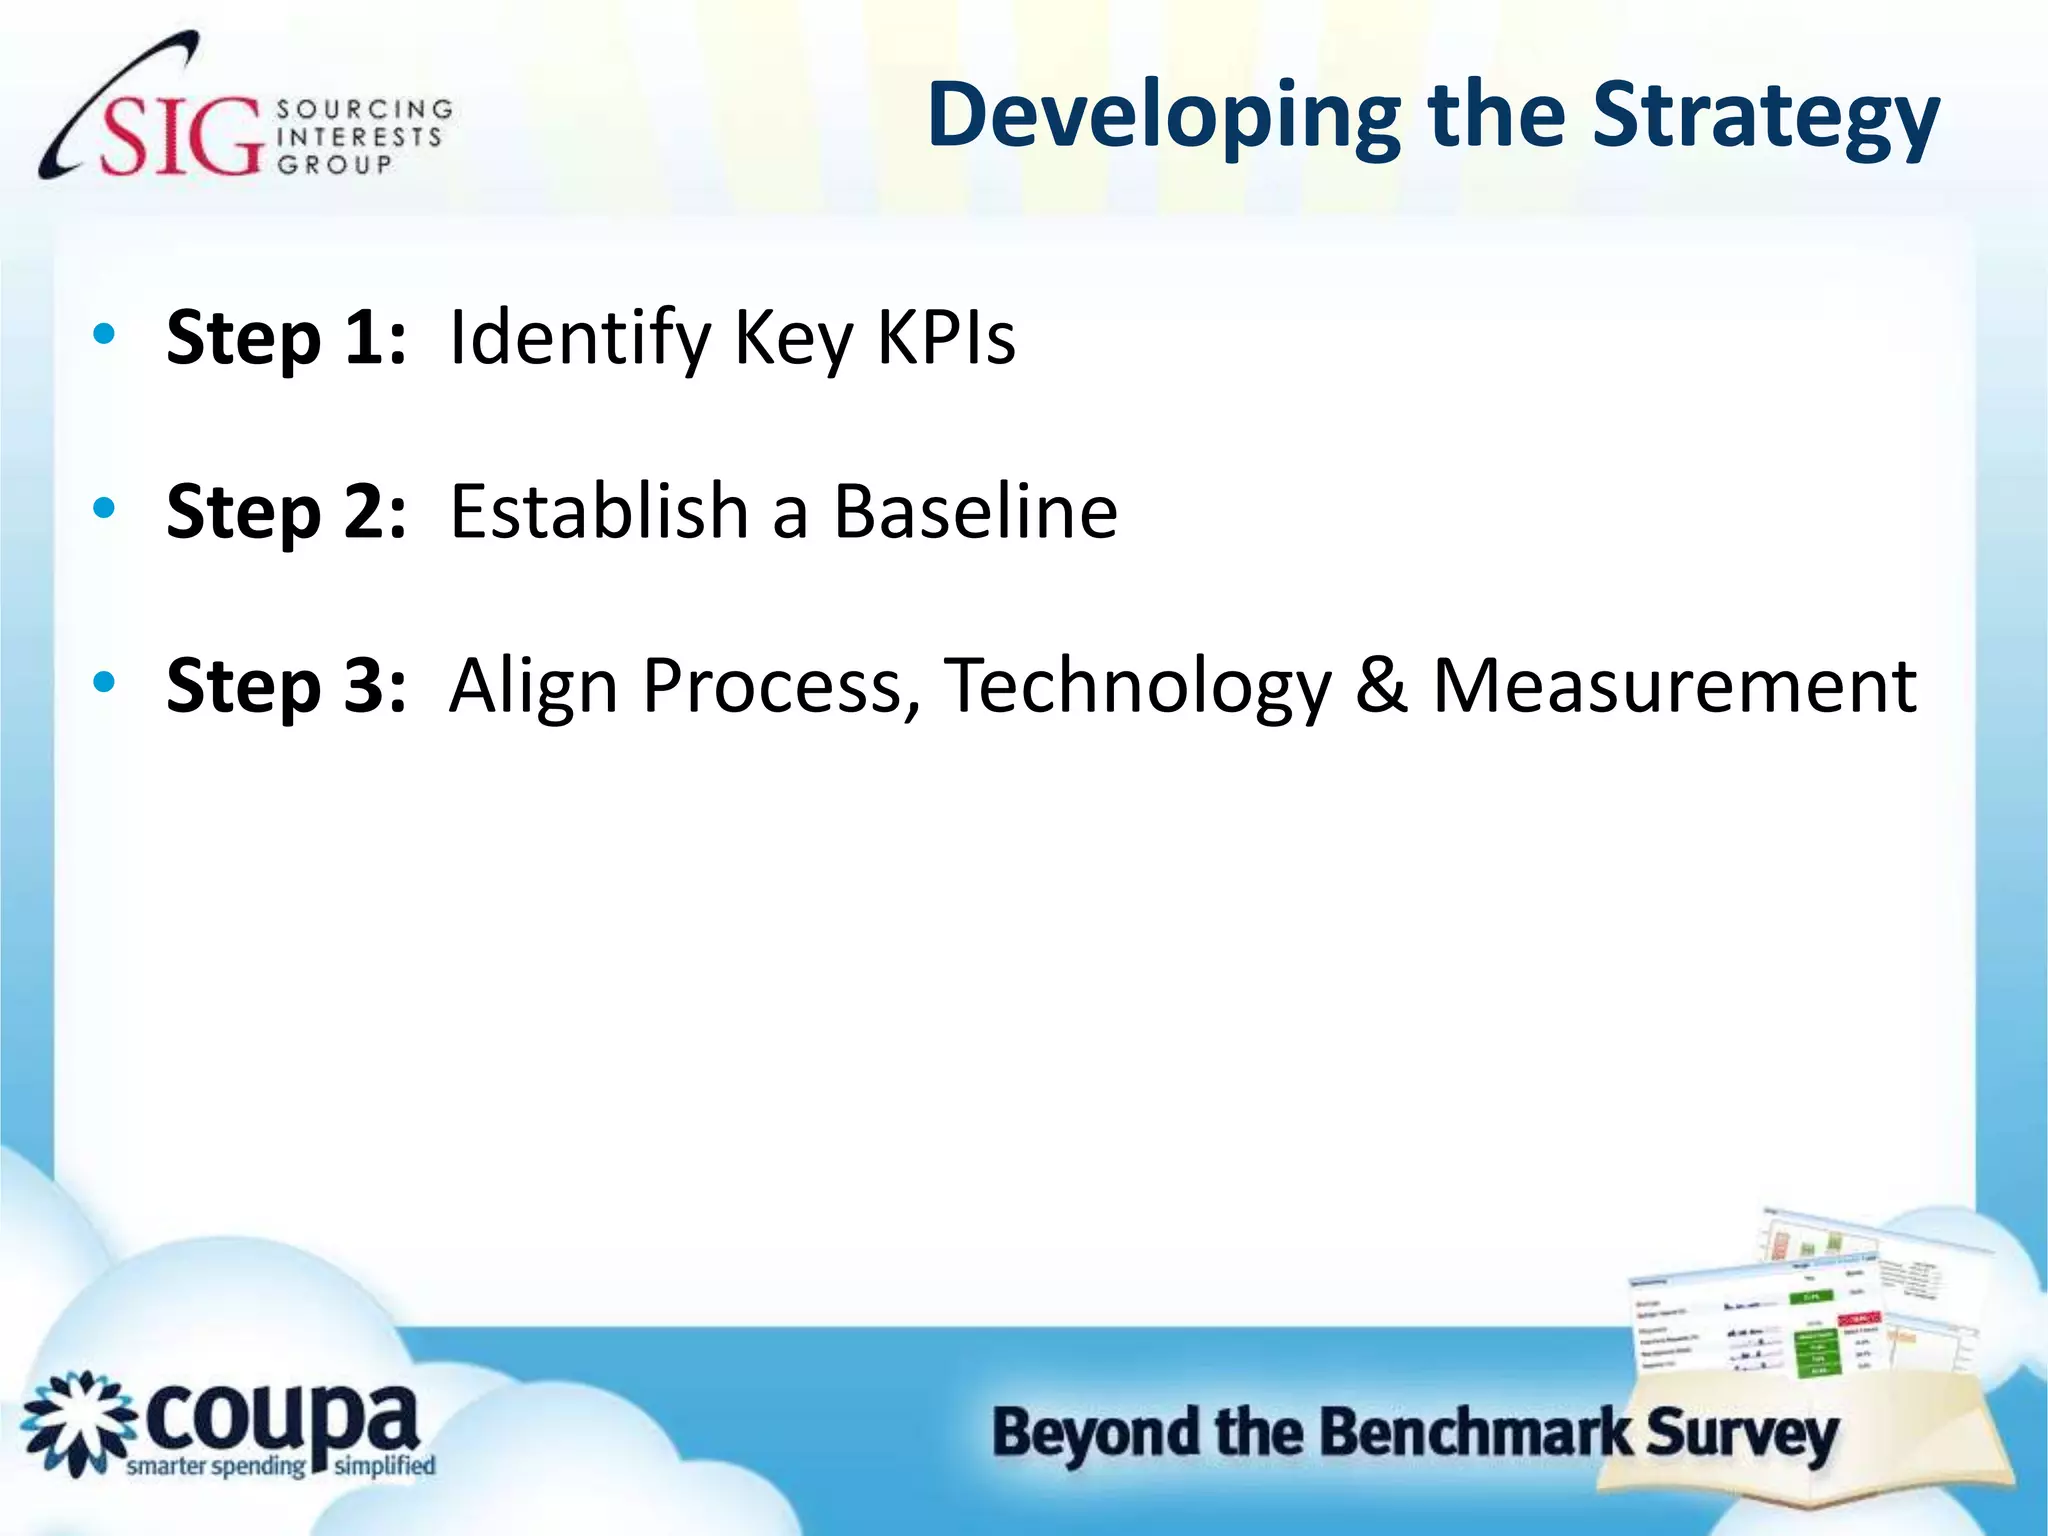
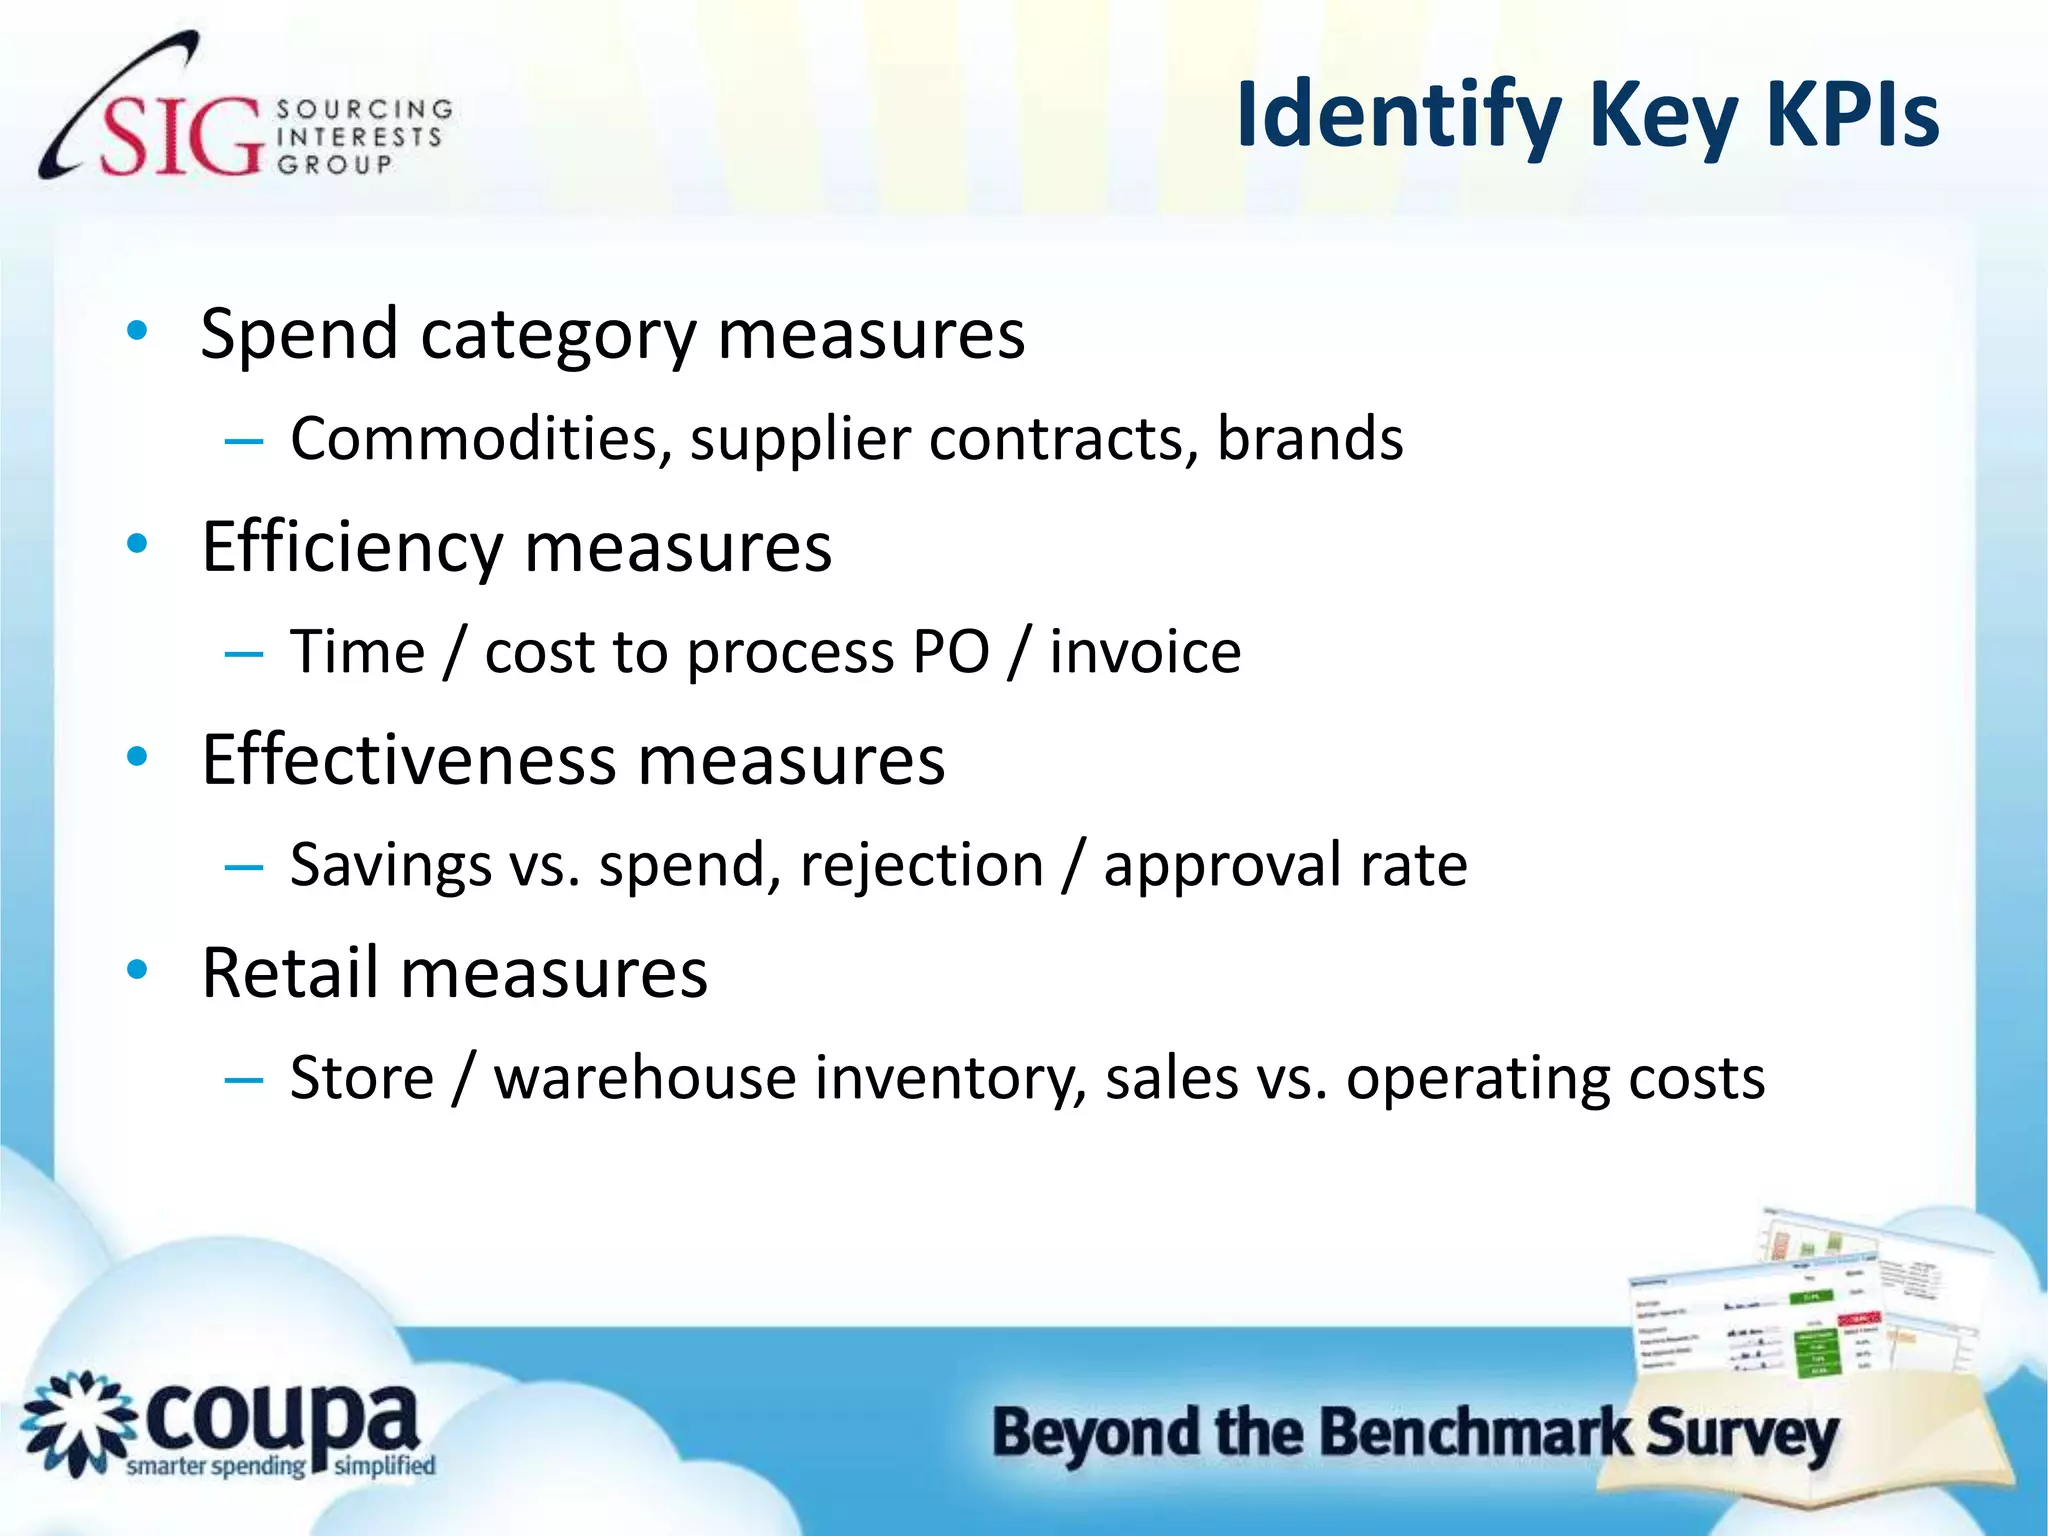
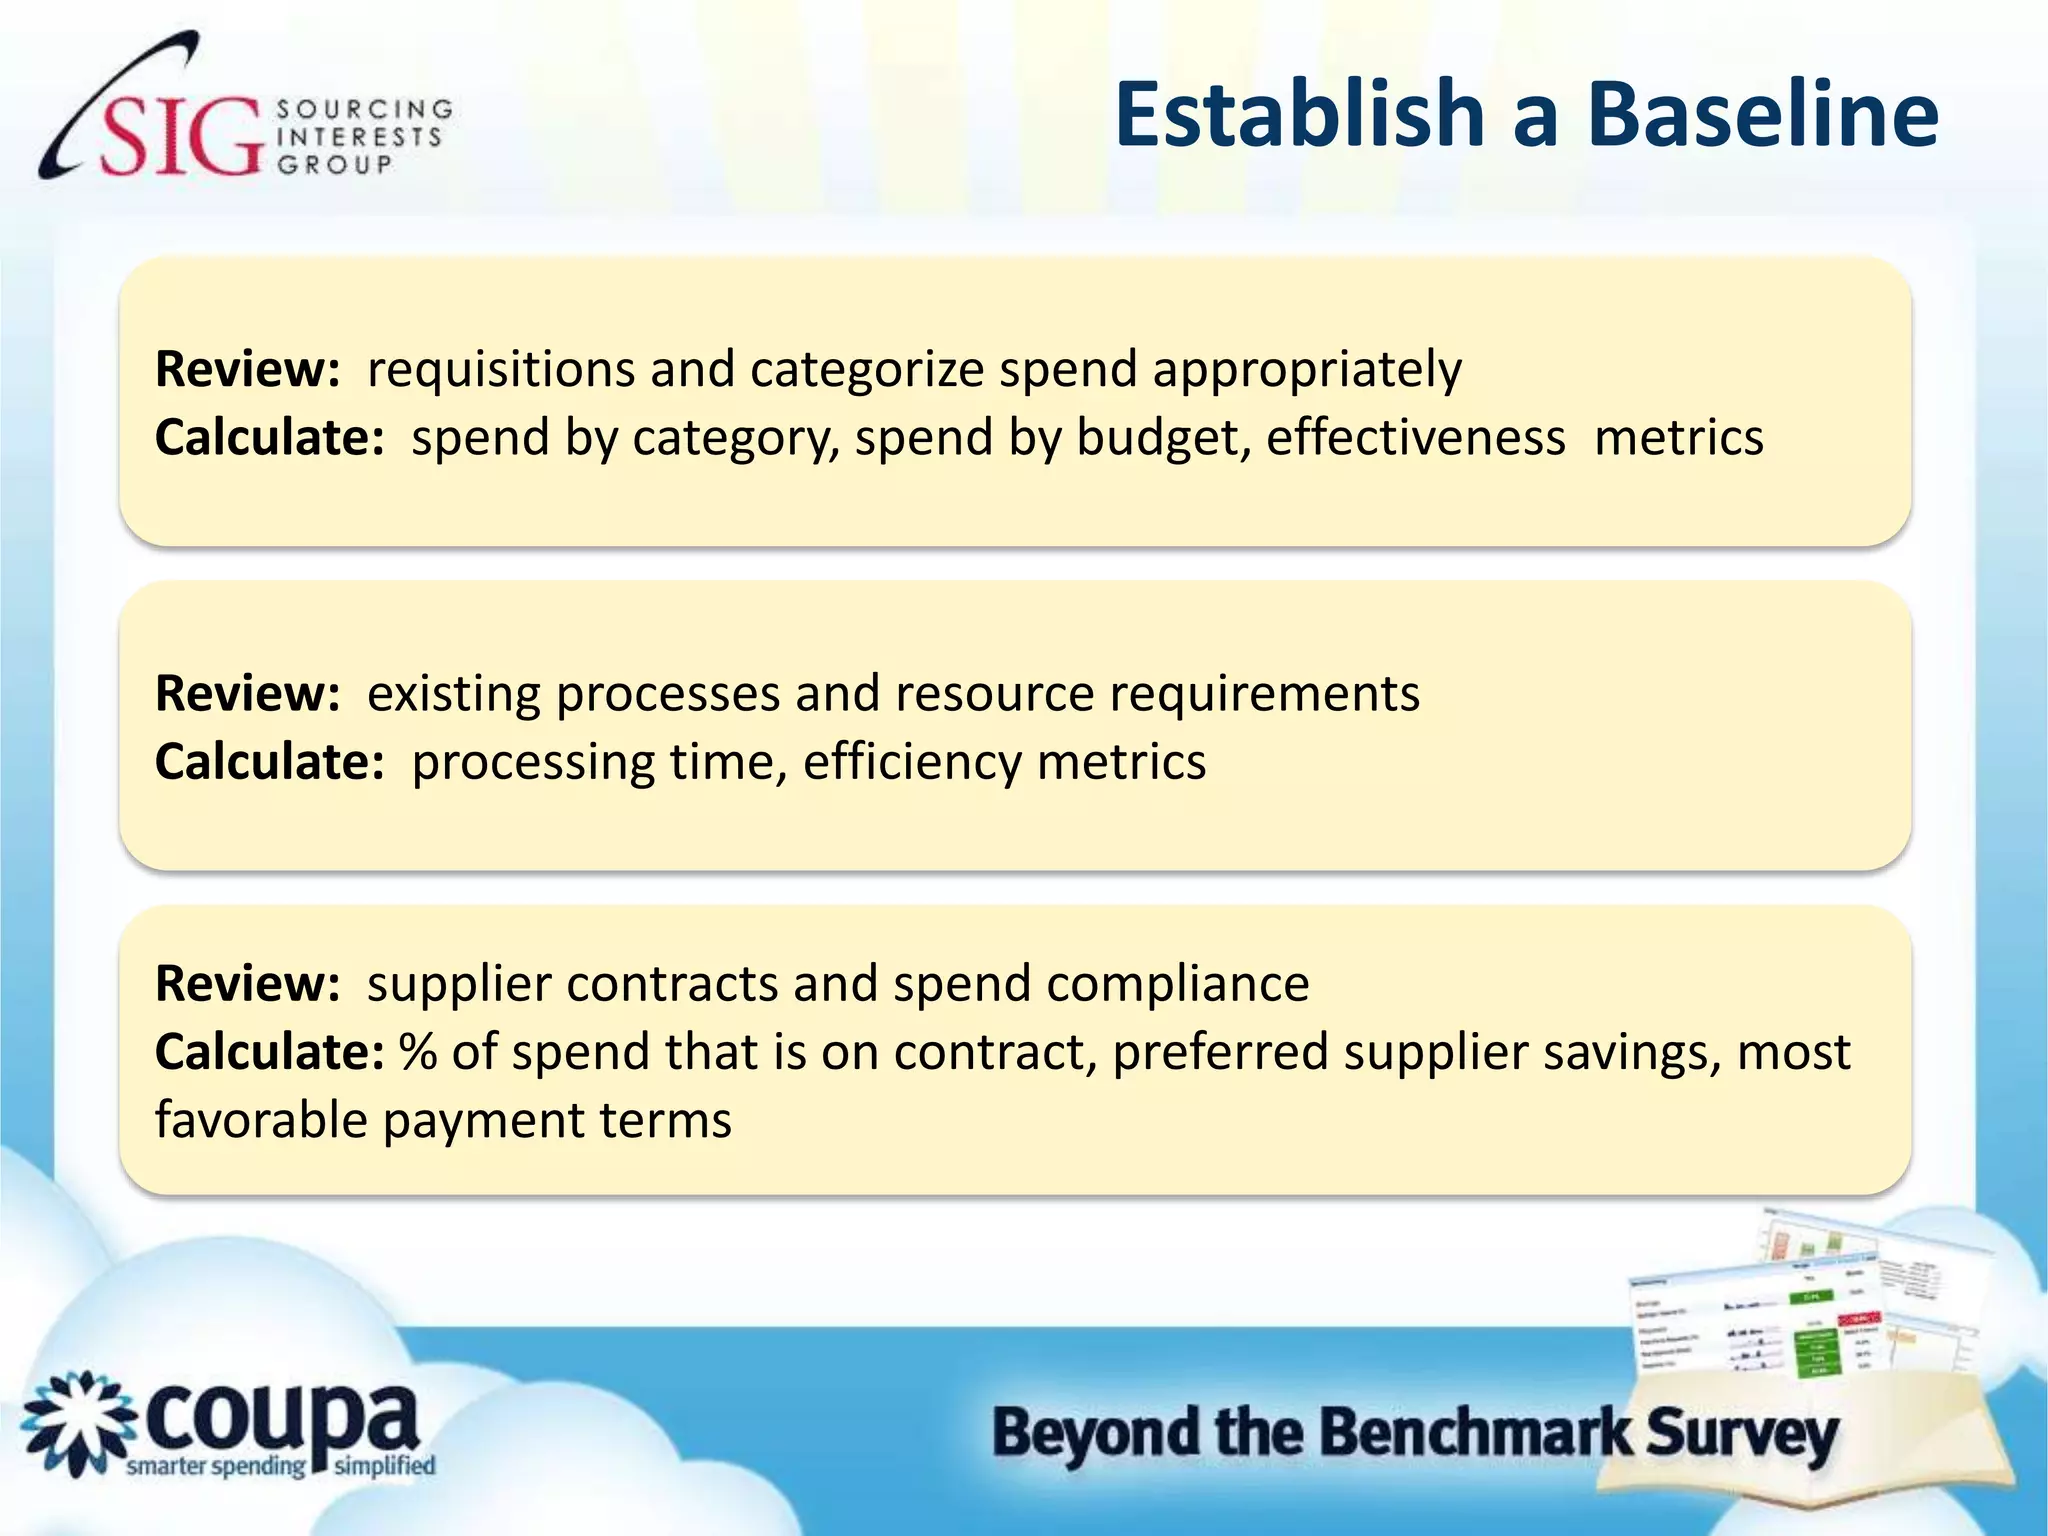
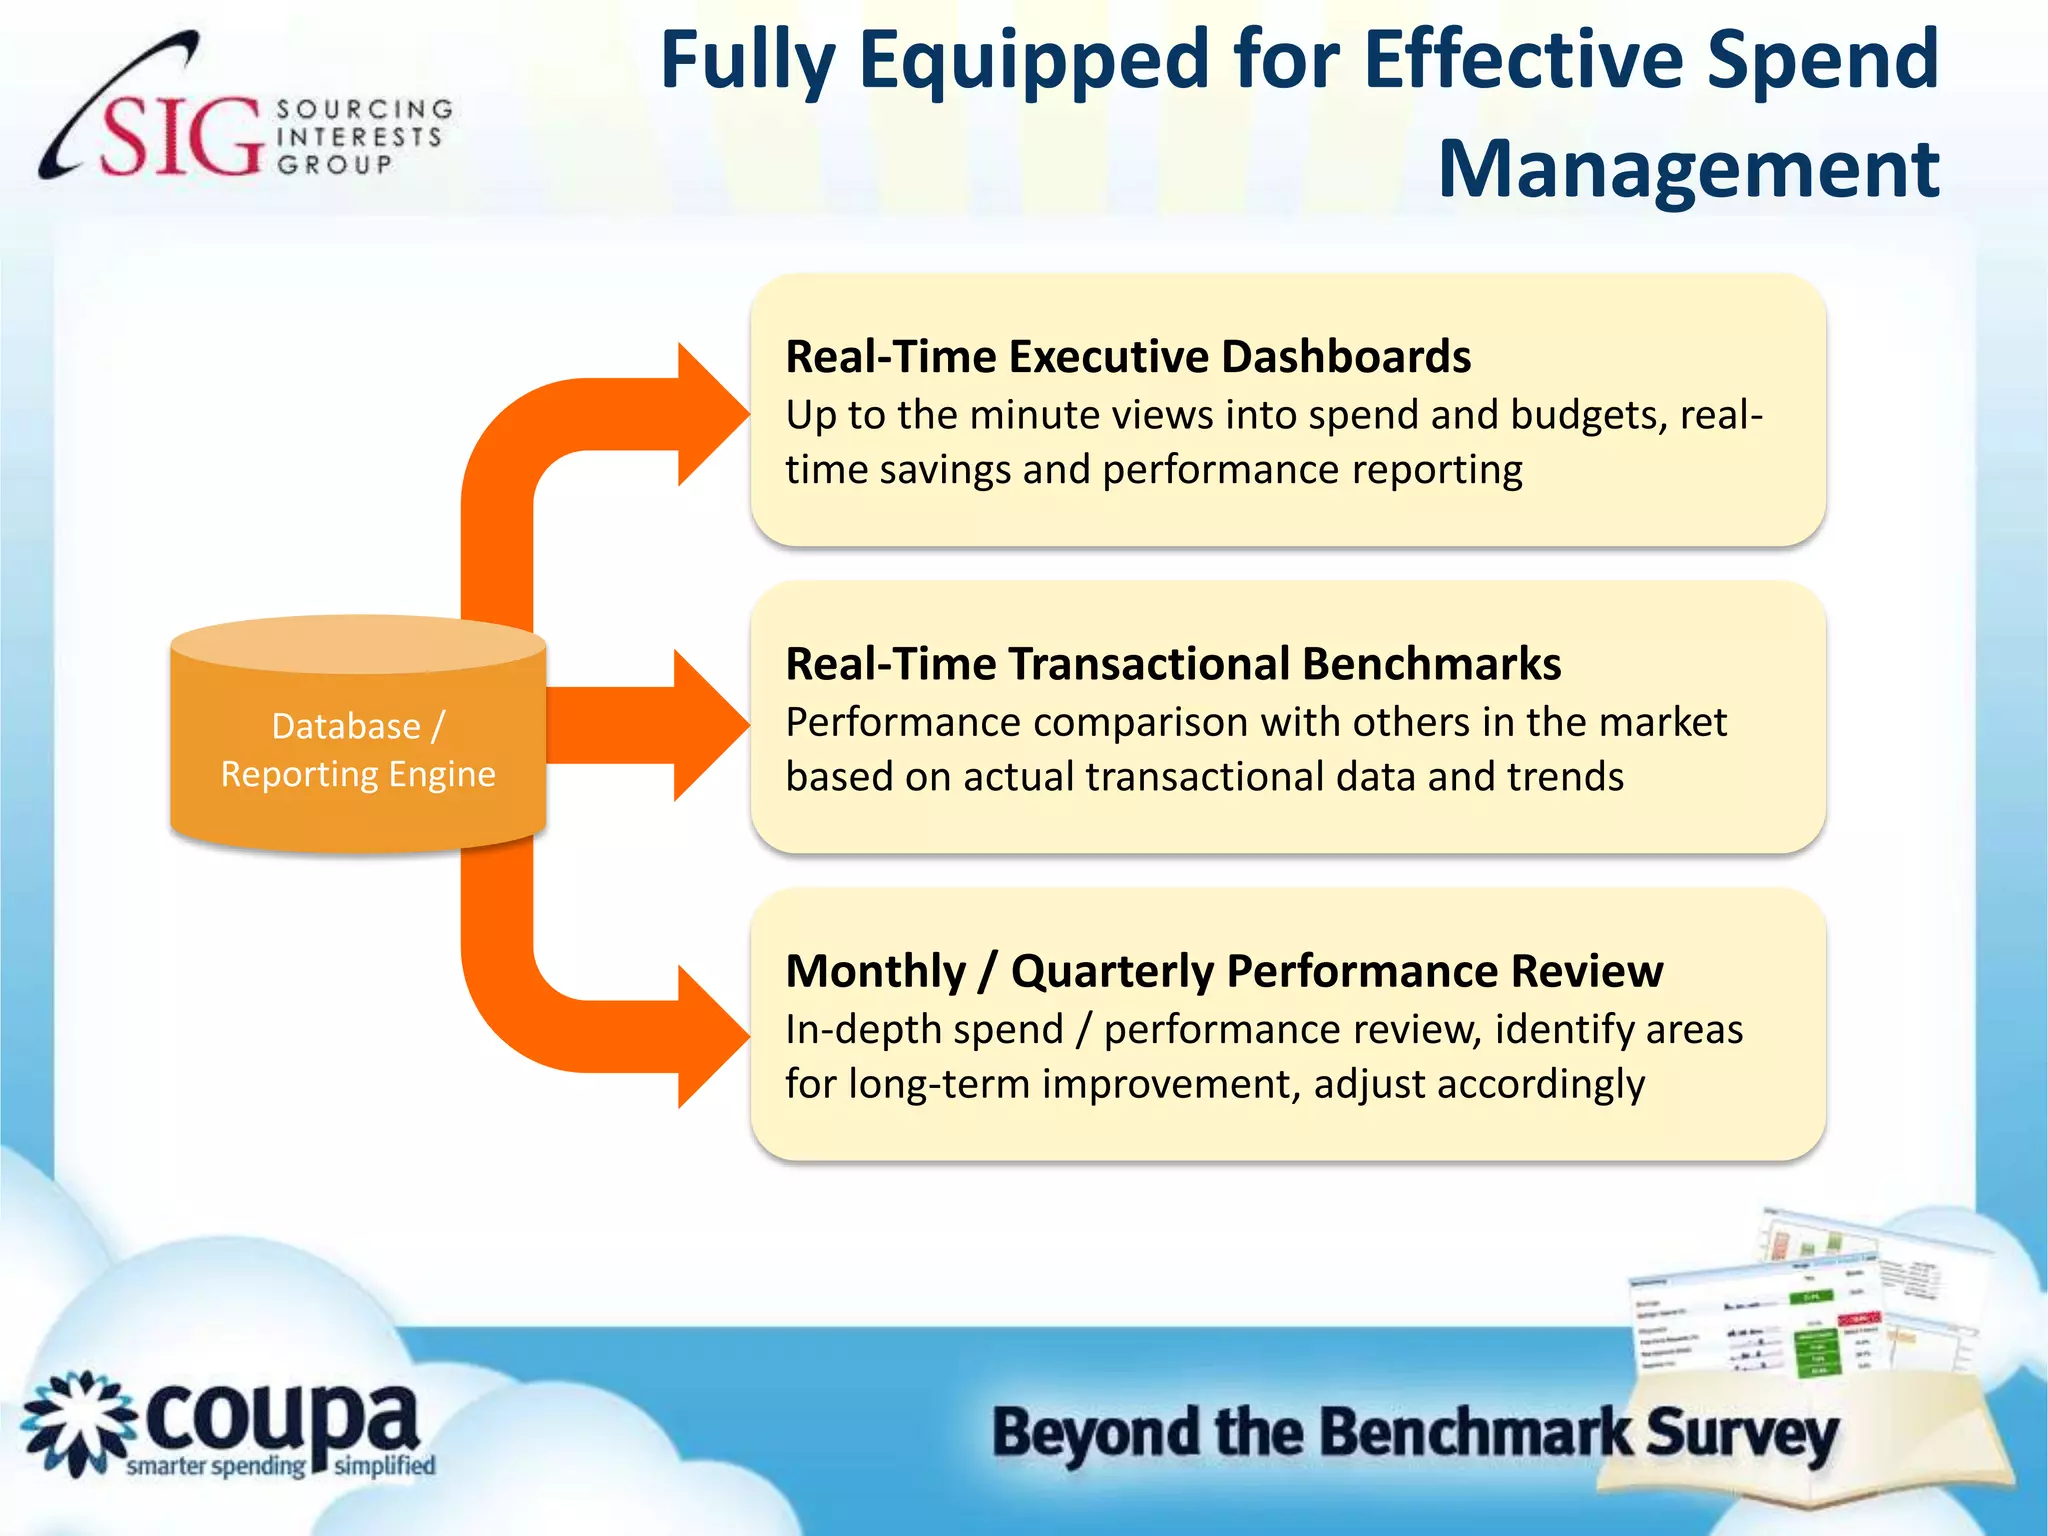


The summary provides an overview of key topics discussed in the document: 1) The document discusses challenges with traditional benchmark surveys and how a transactional, cloud-based approach can provide more actionable insights. 2) It outlines 10 must-measure metrics and KPIs related to procurement efficiency and effectiveness that organizations should track, including approval cycle times, spend under management, and cost savings. 3) The document provides examples of how Williams-Sonoma can develop a benchmarking strategy, such as identifying key KPIs, establishing a baseline, and aligning processes and technology with measurement.


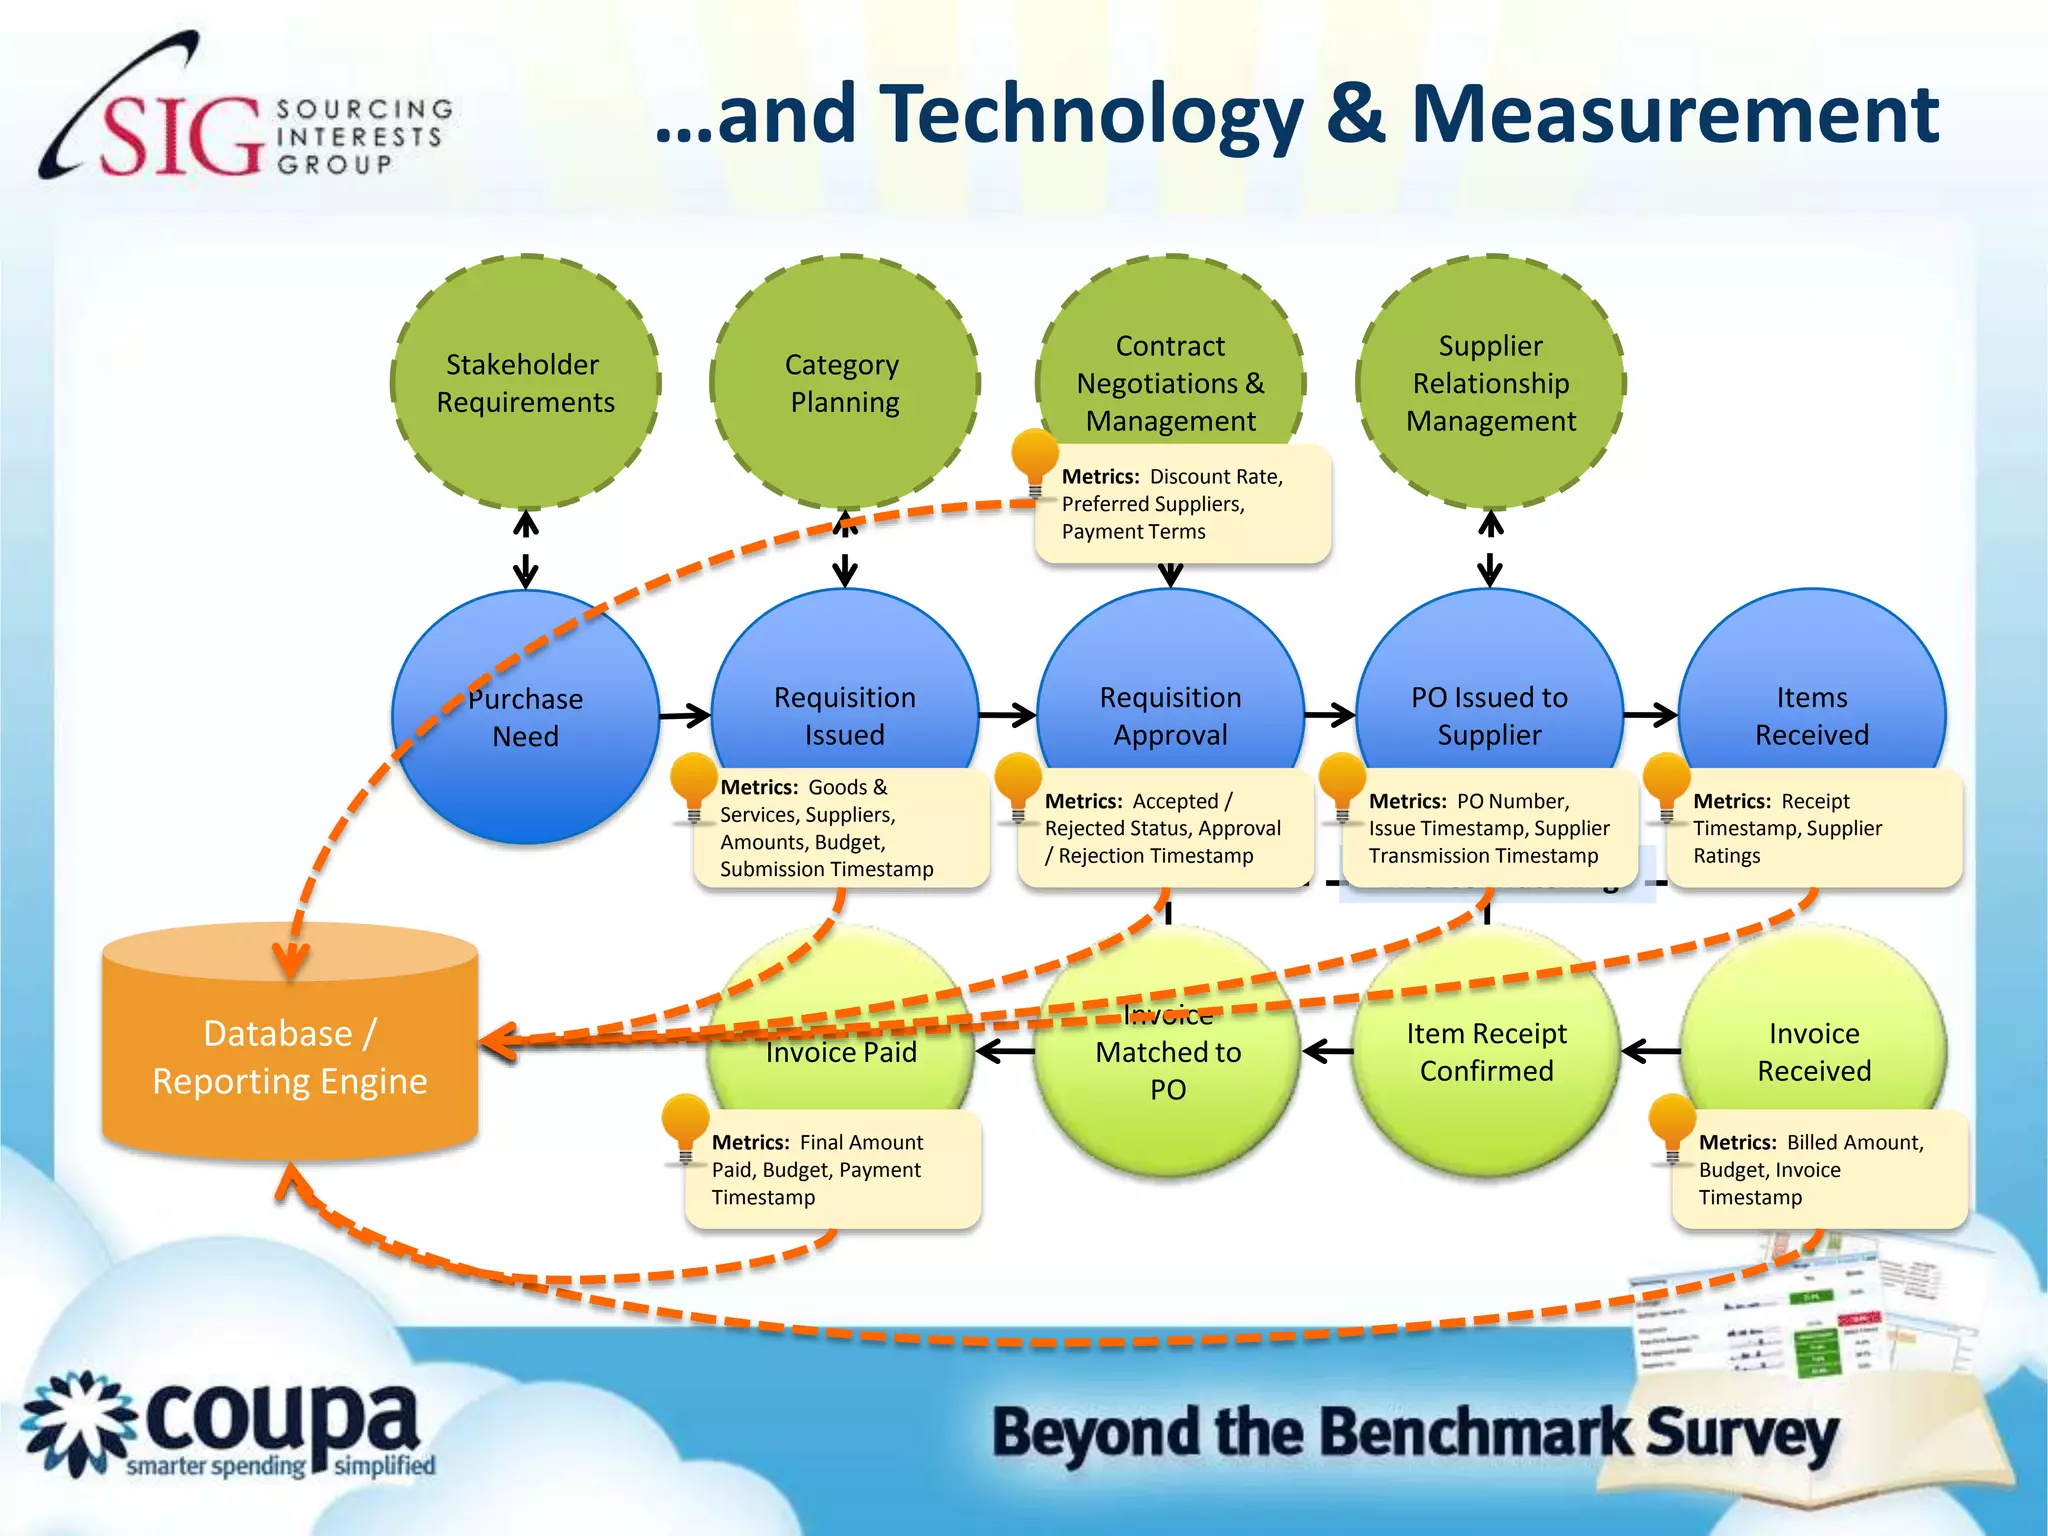
![[2019] week07 enterprise systems](https://cdn.slidesharecdn.com/ss_thumbnails/2019week07-enterprisesystems-191010222538-thumbnail.jpg?width=640&height=640&fit=bounds)


