Downloaded 135 times


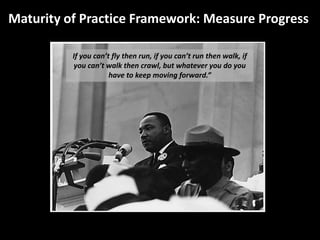
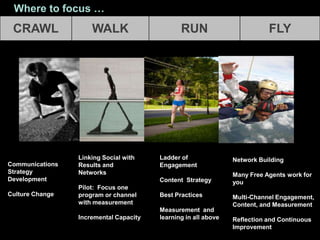
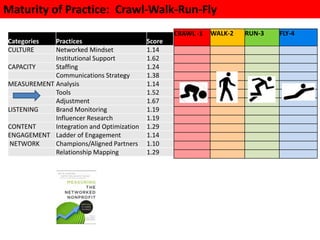
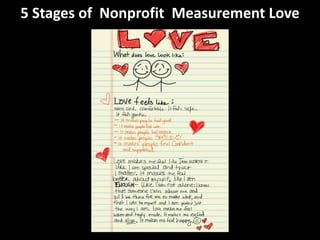


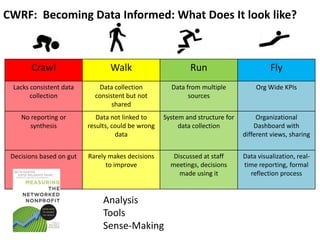

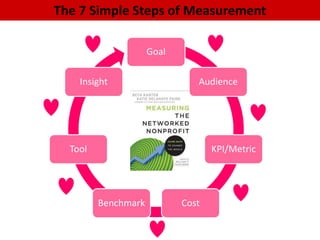
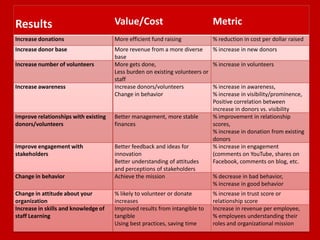
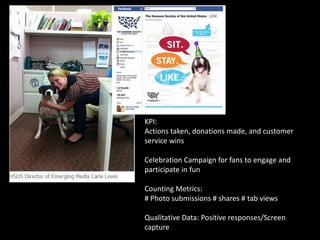
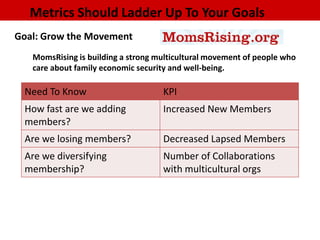
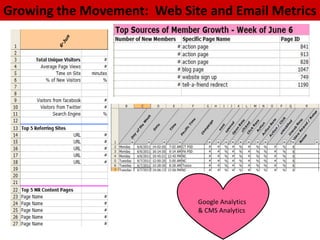
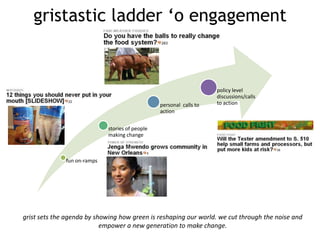

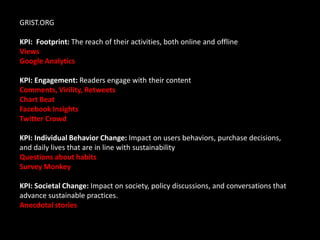
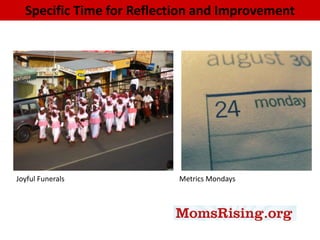
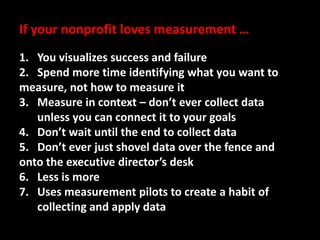

The document outlines a framework for nonprofit organizations to enhance their measurement and evaluation practices in social media and network engagement, emphasizing the importance of a data-informed culture. It describes a maturity model for measurement from 'crawl' to 'fly' stages and provides actionable steps for nonprofits to implement effective measurement strategies. The document encourages continuous improvement and reflection to better align measurement efforts with organizational goals.