Download as PDF, PPTX


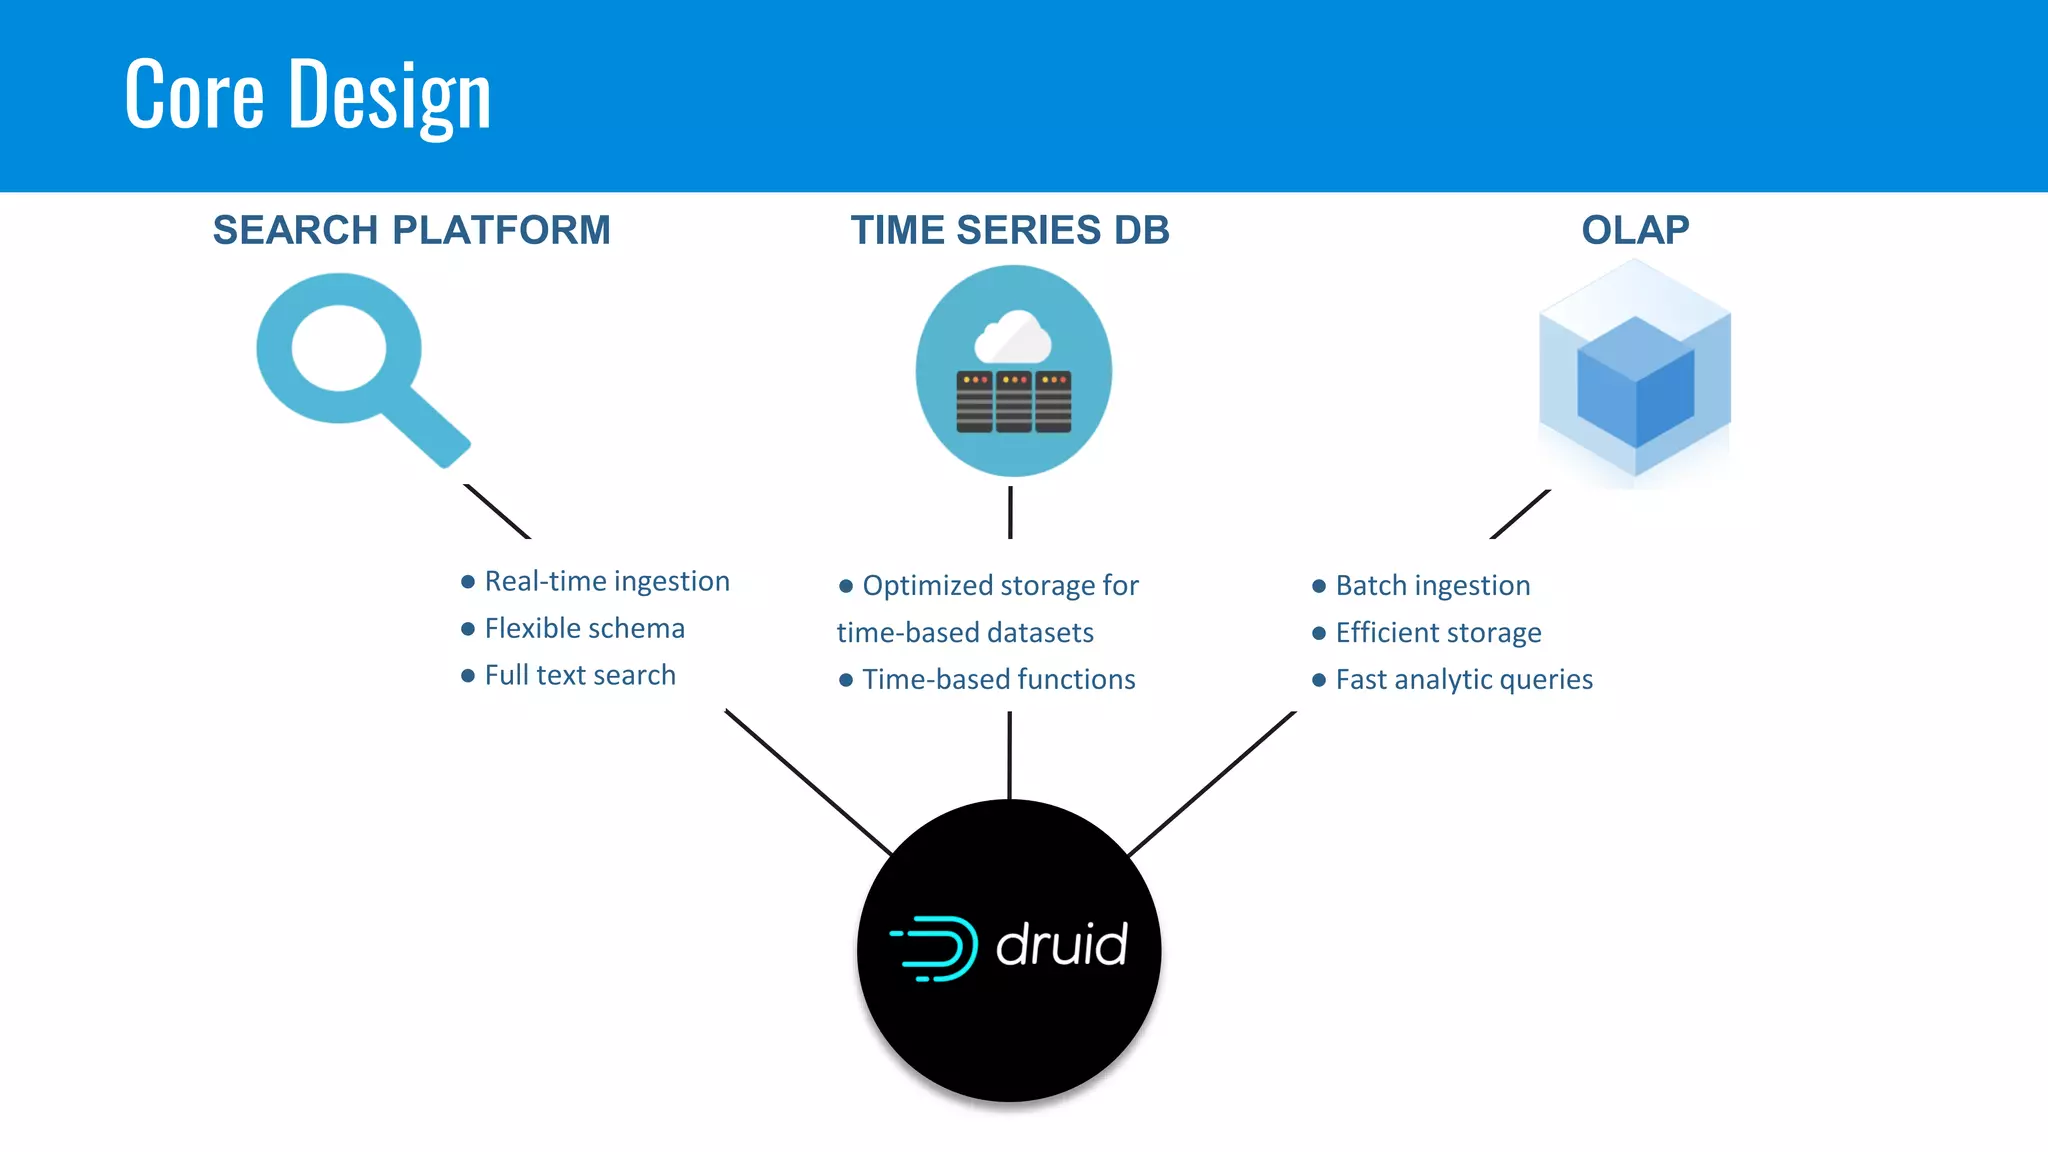
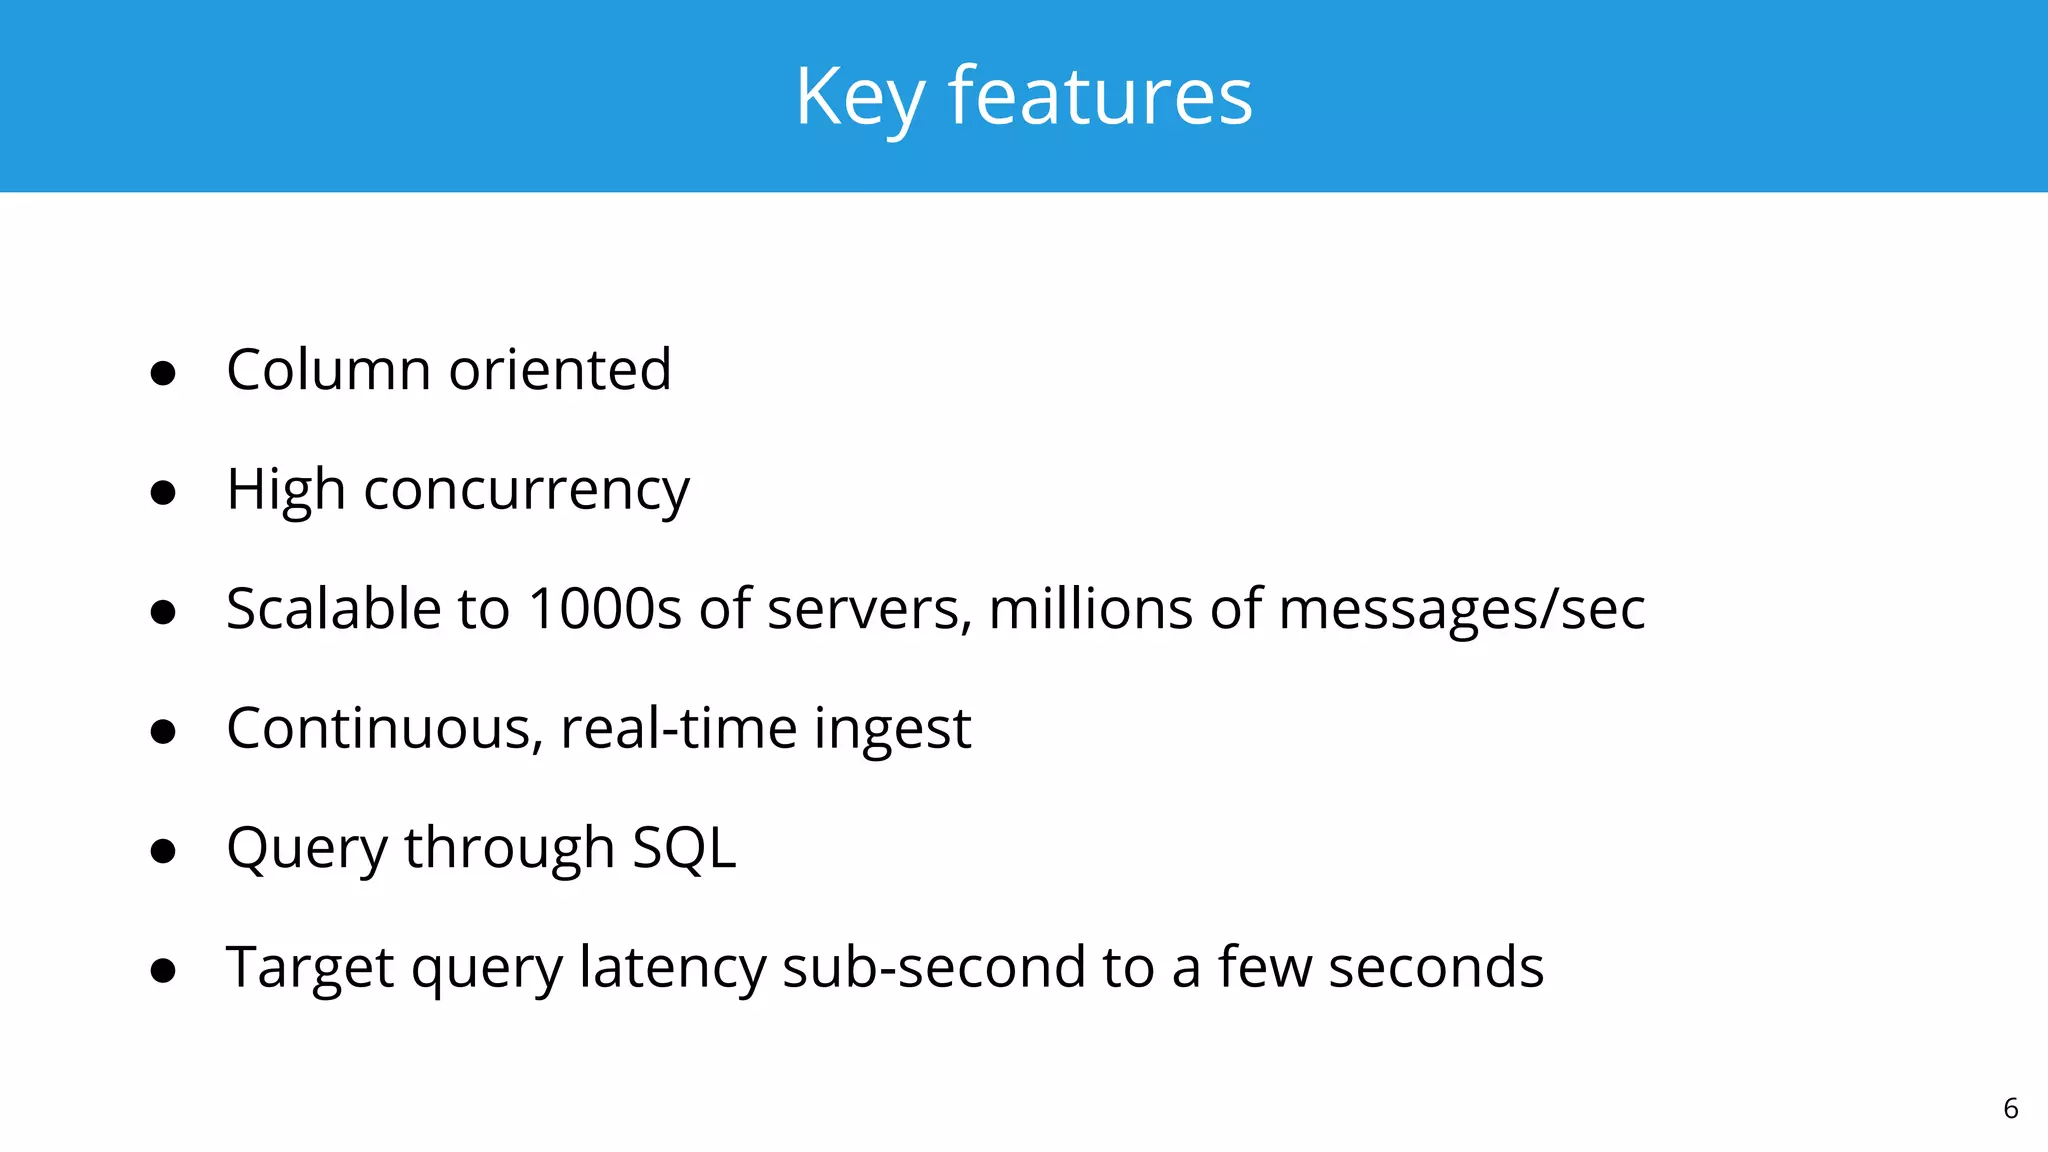
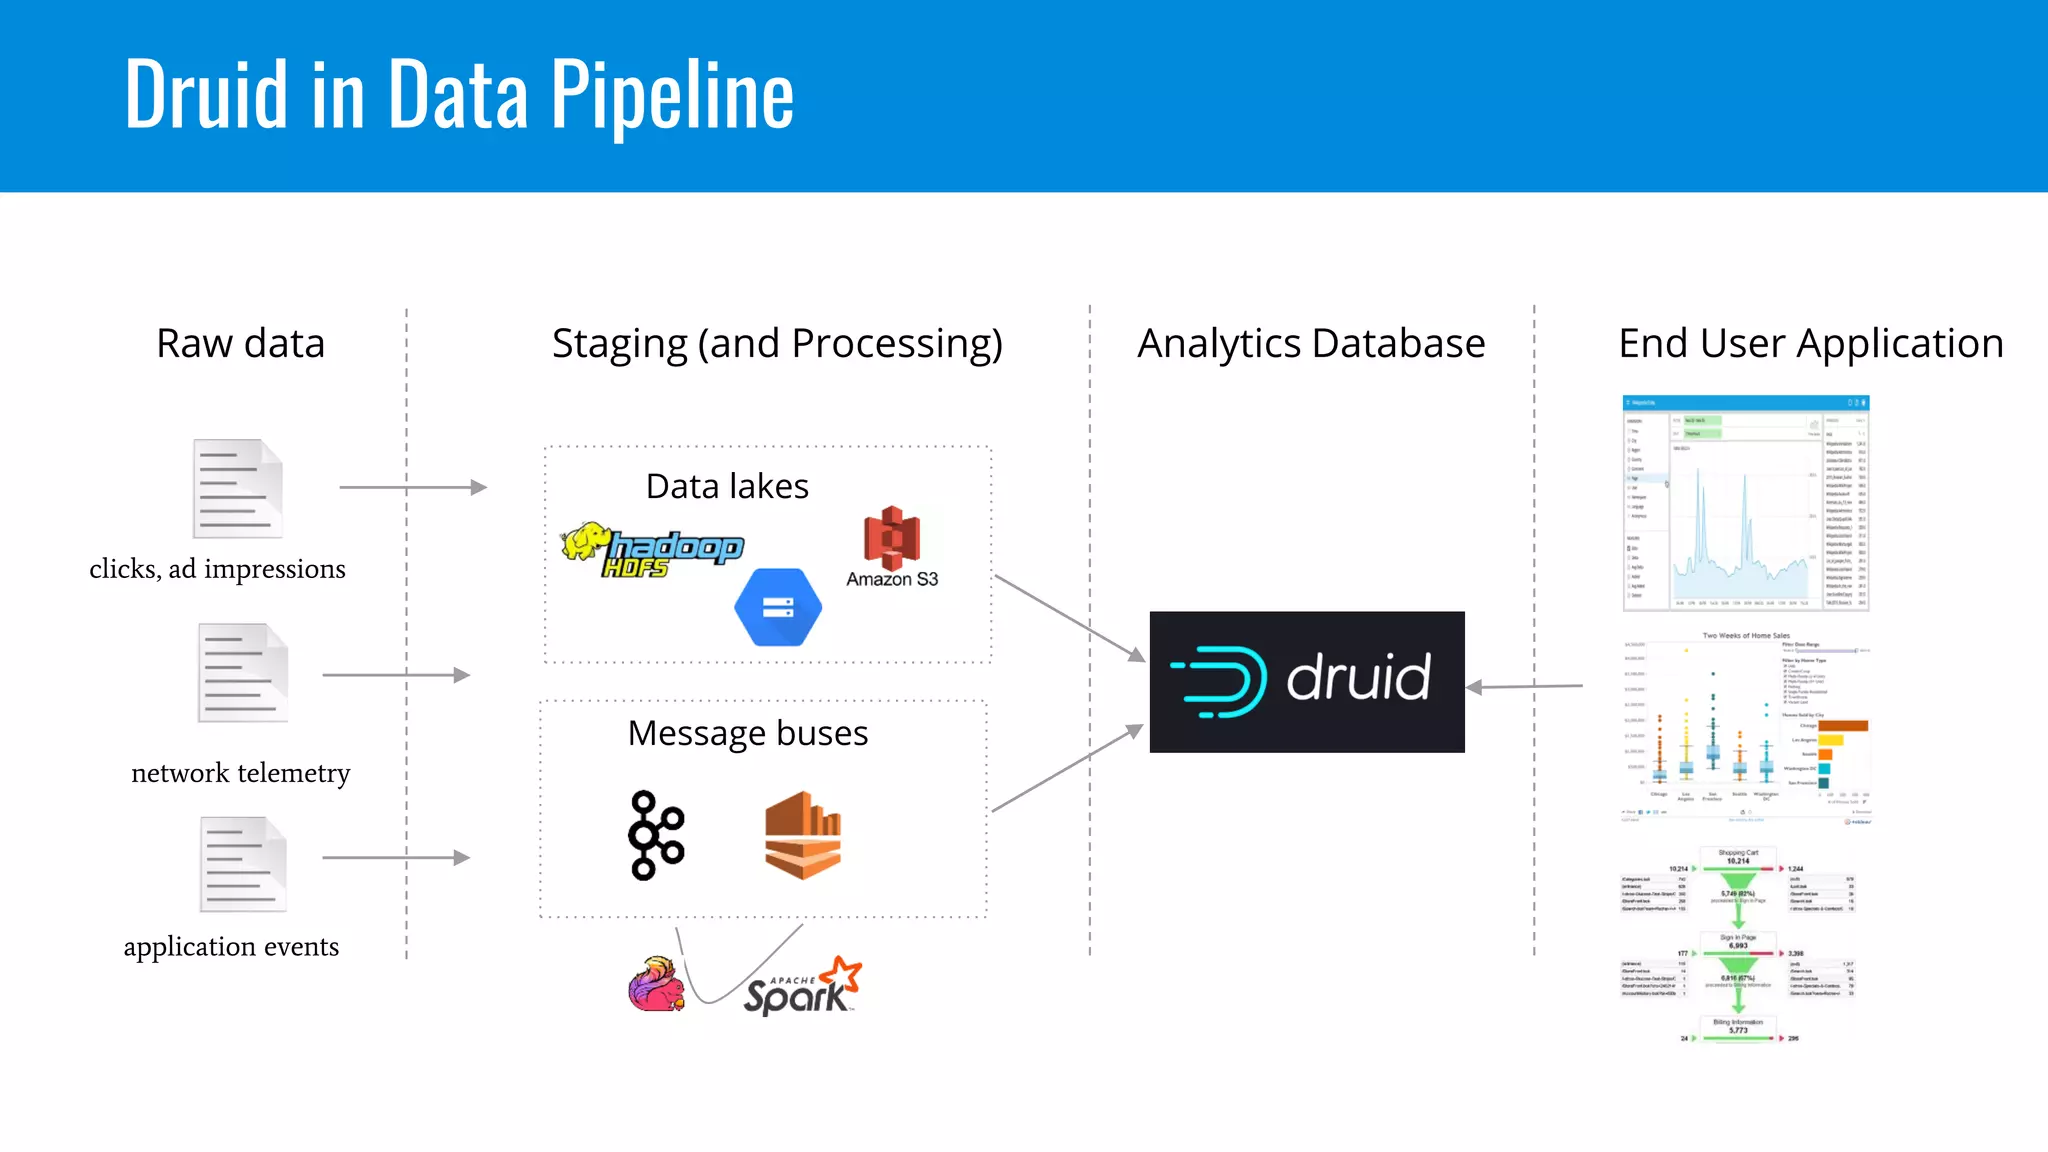
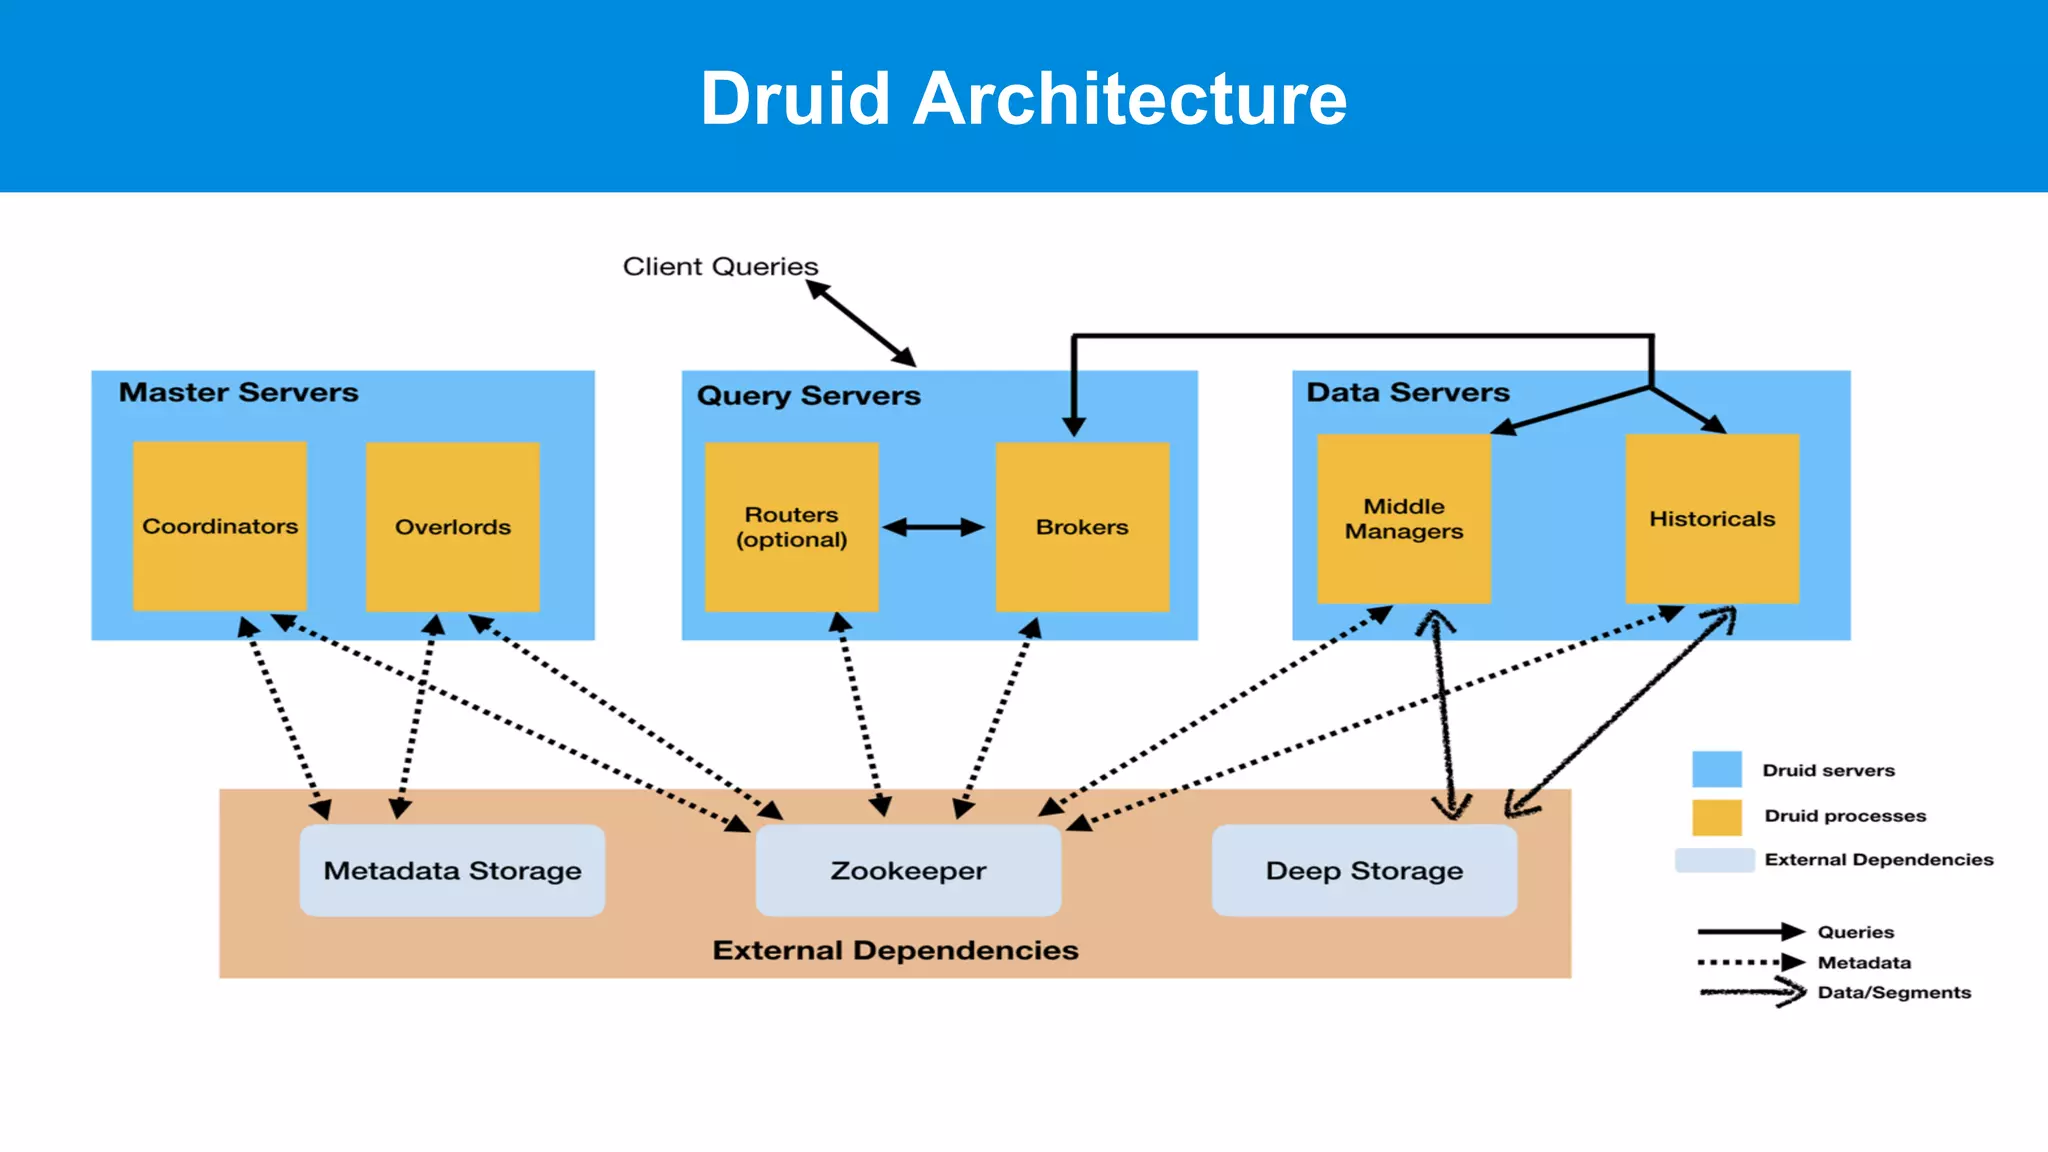
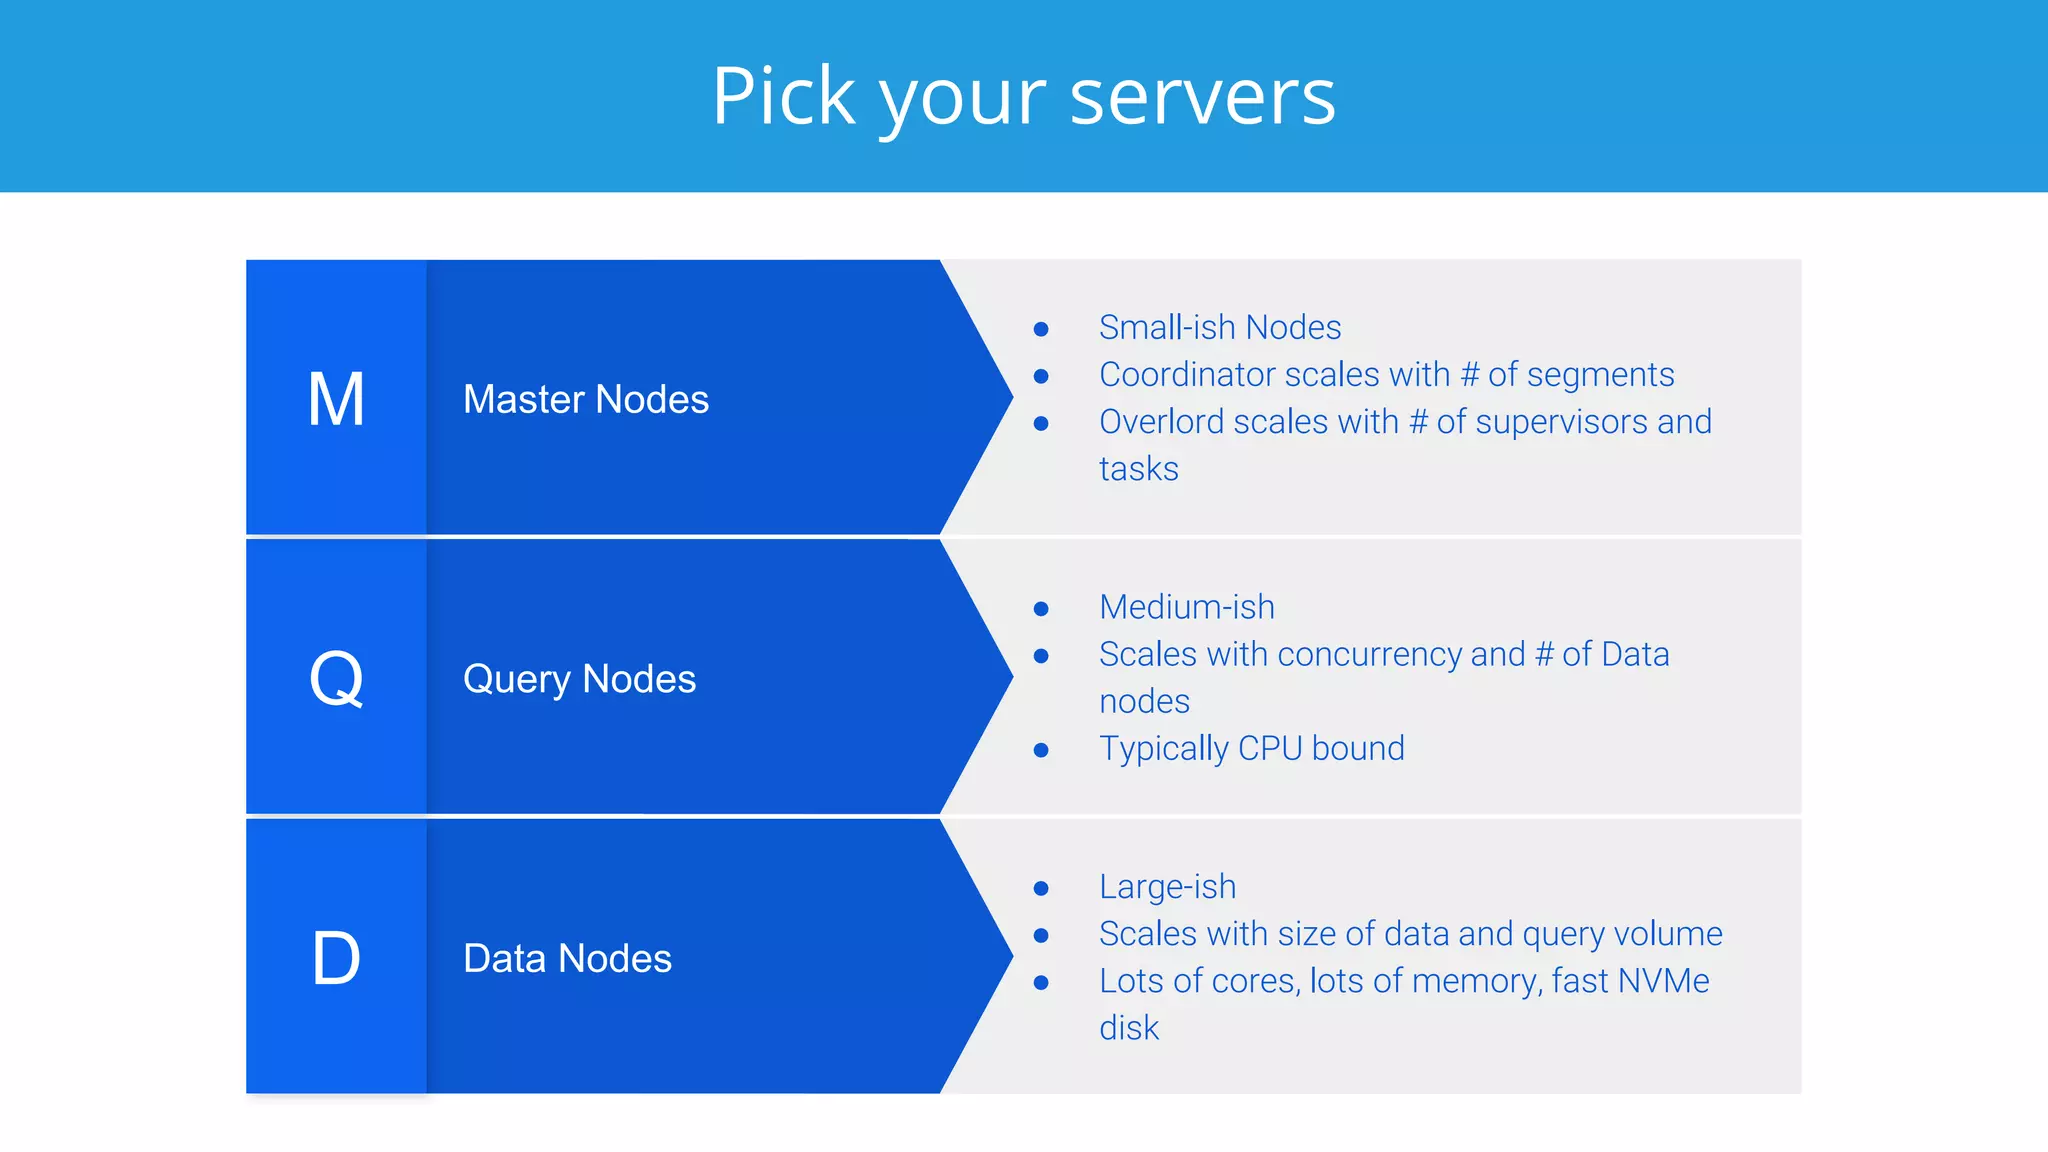
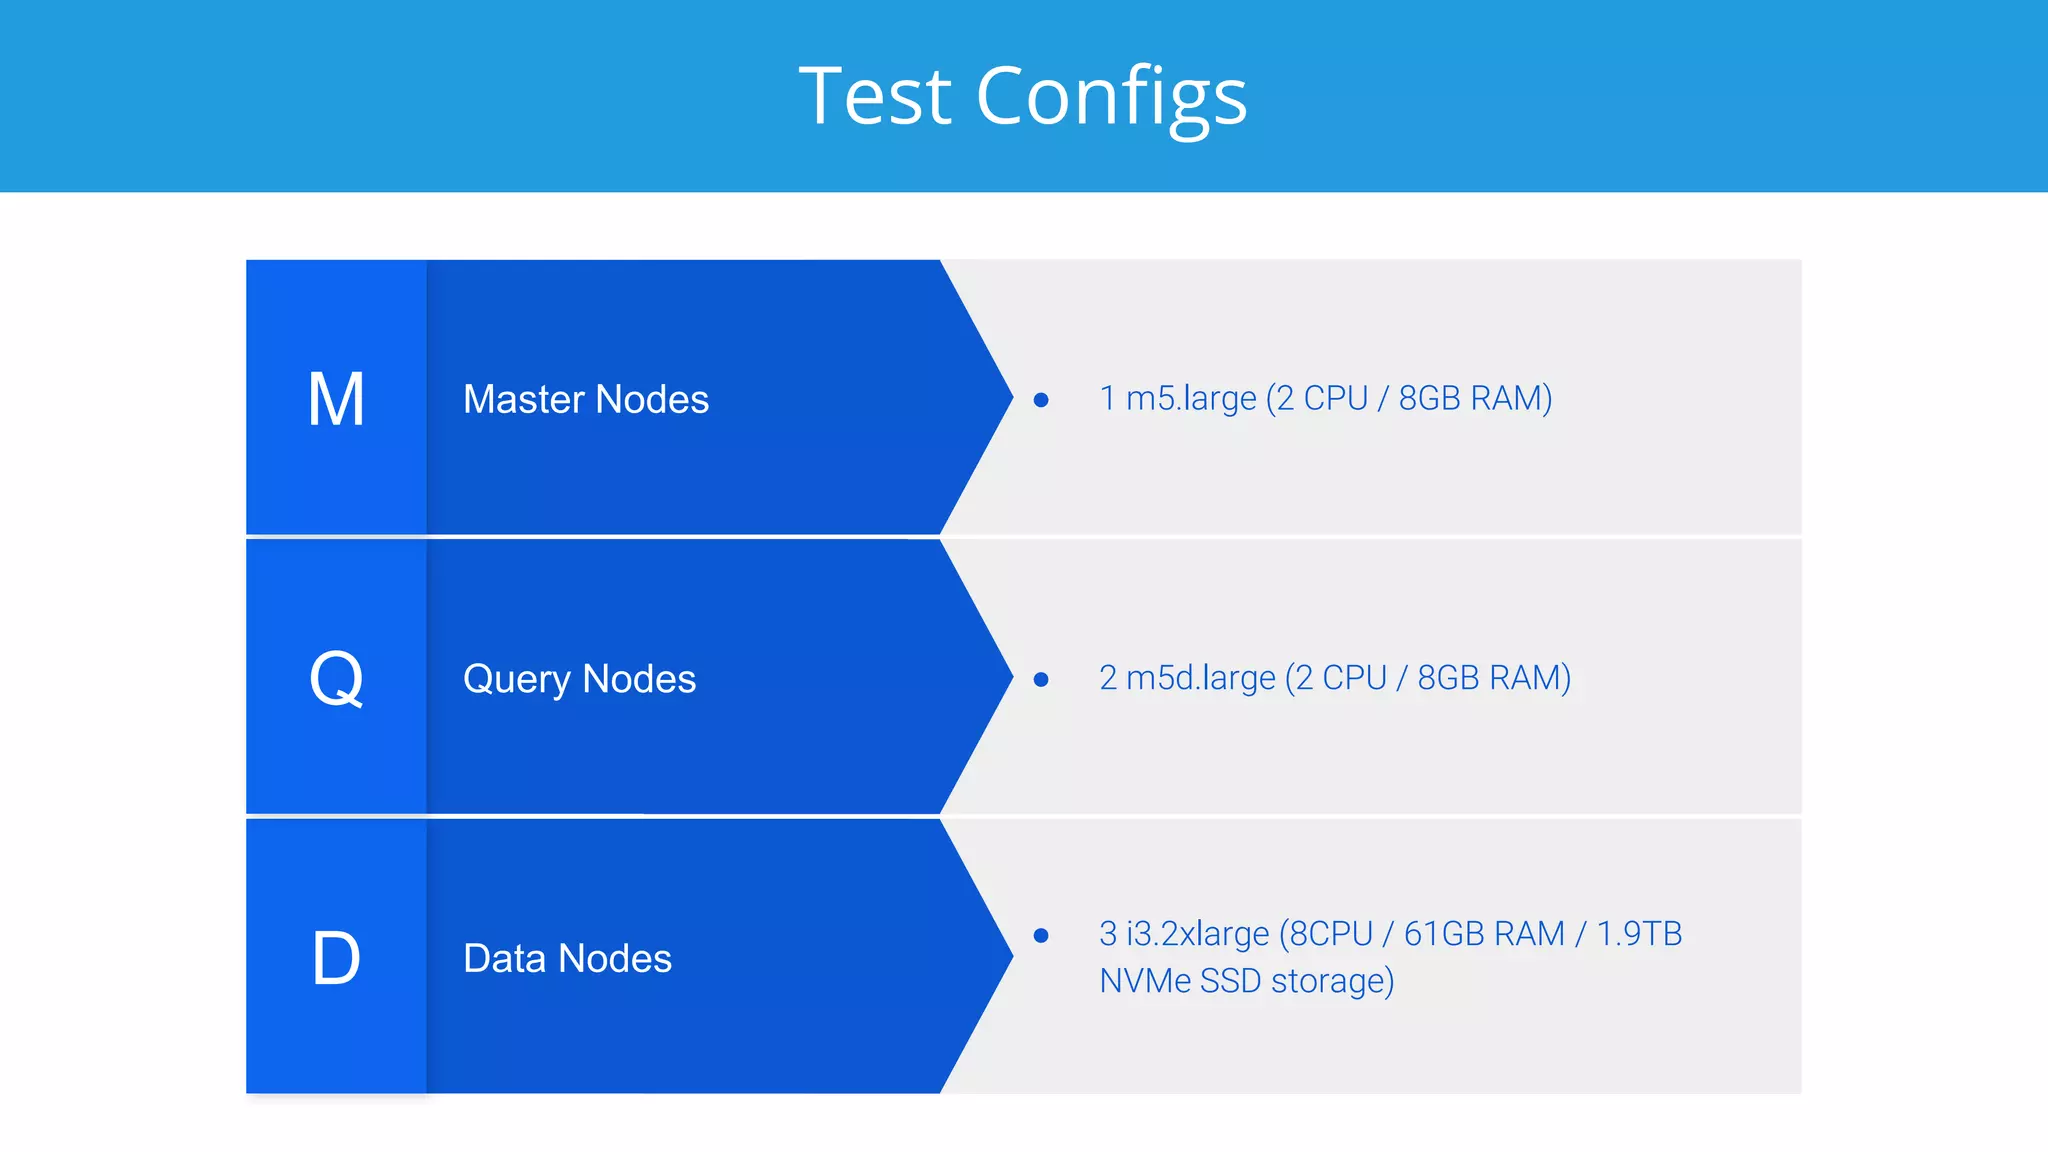
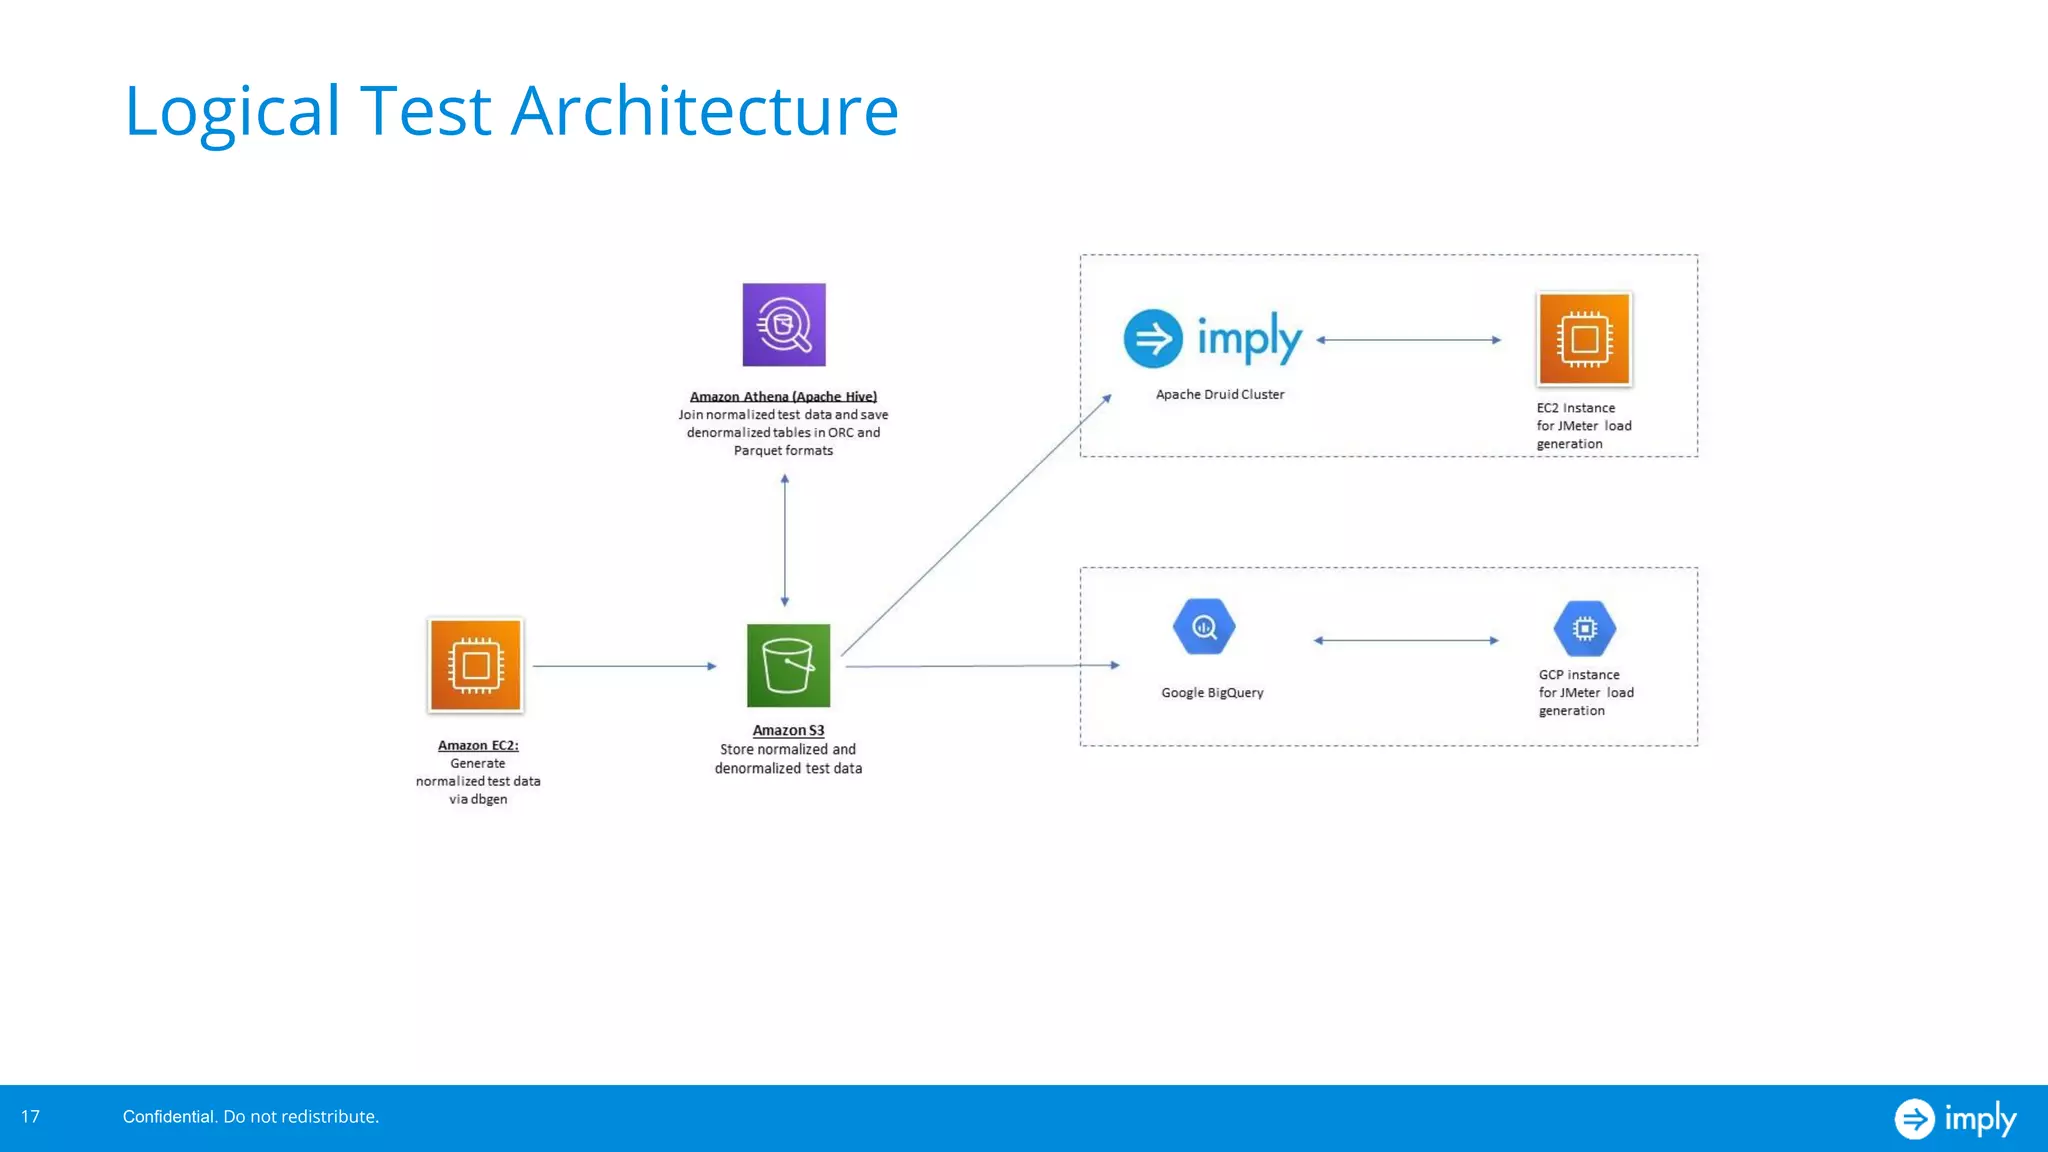
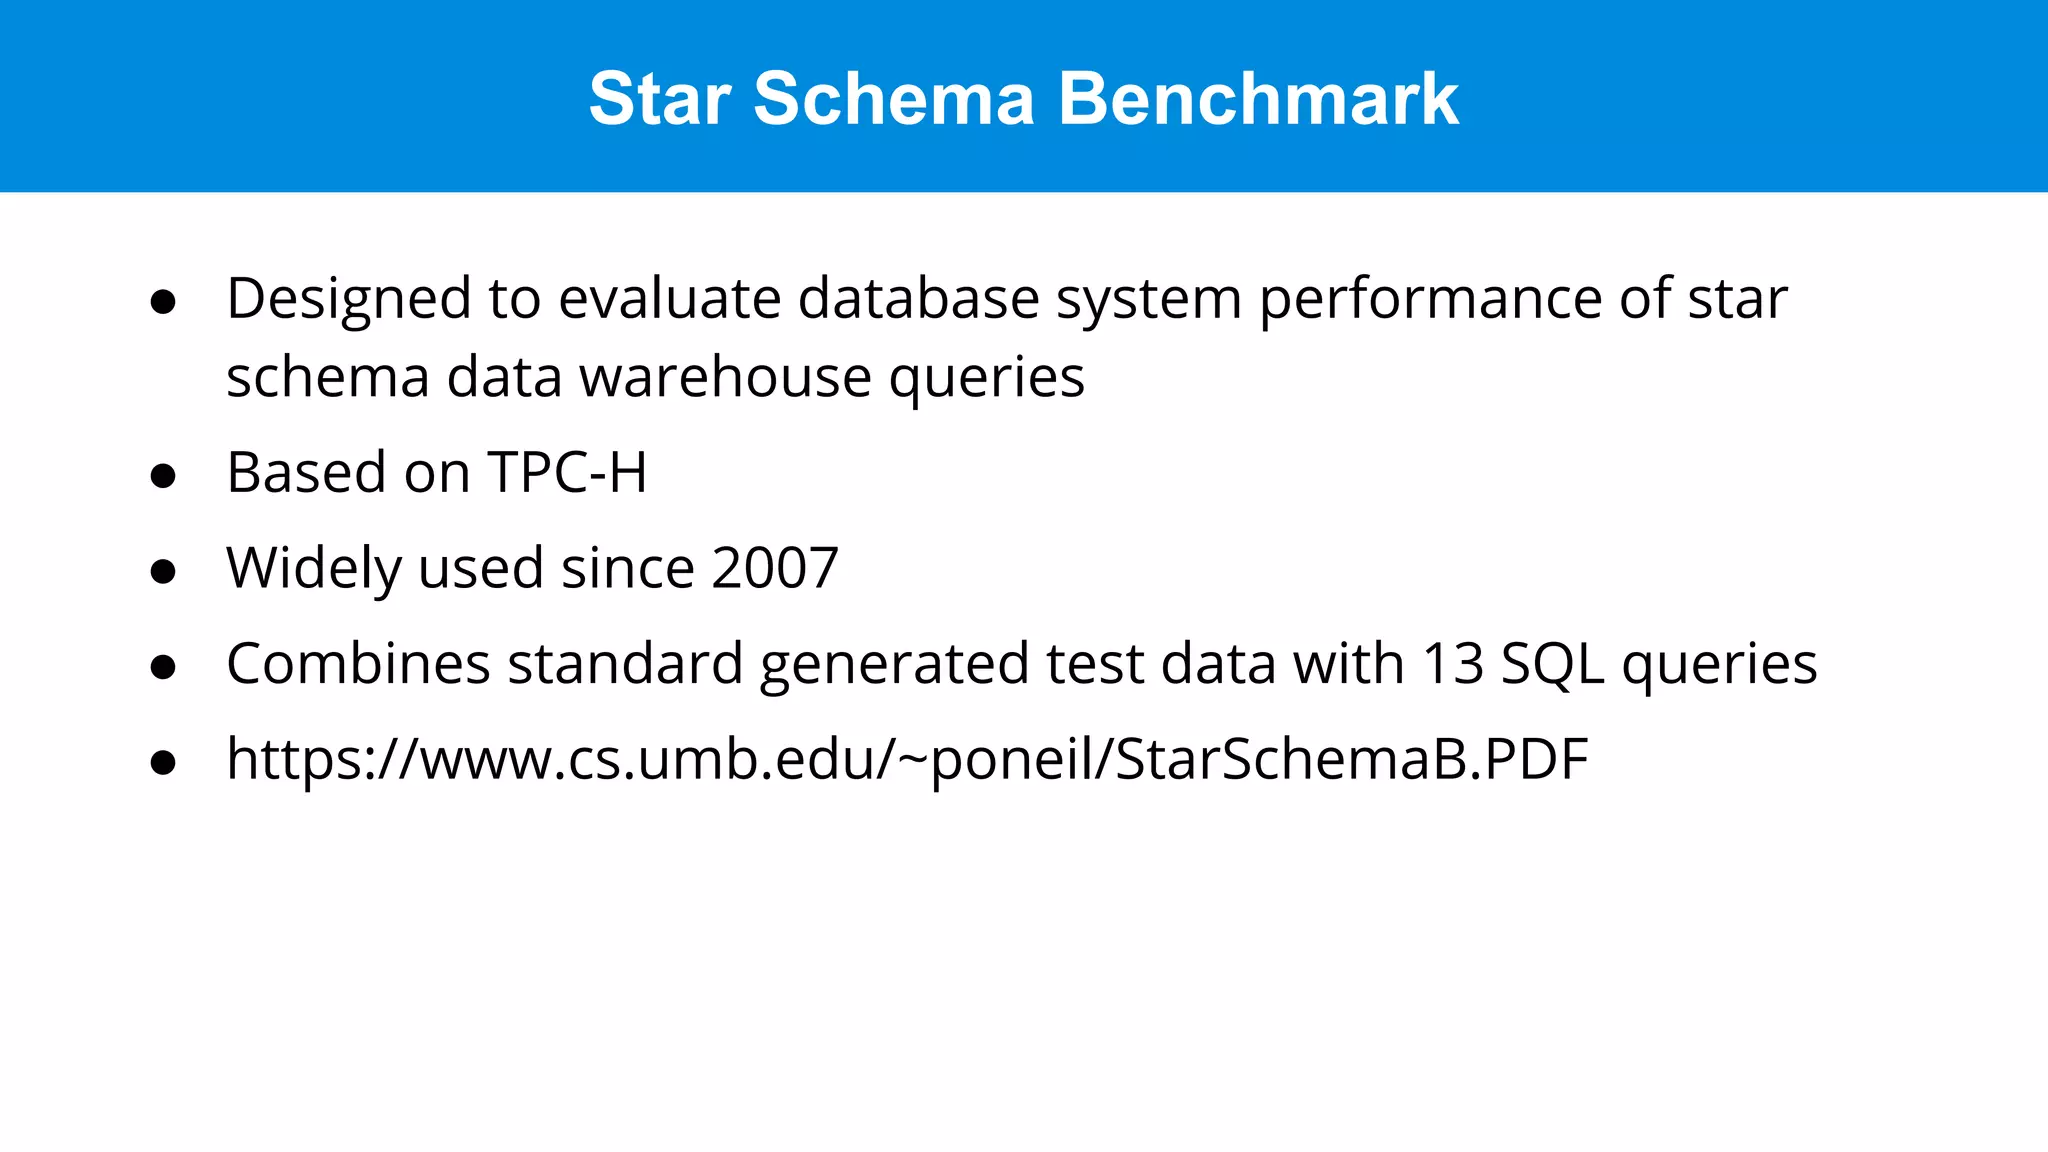
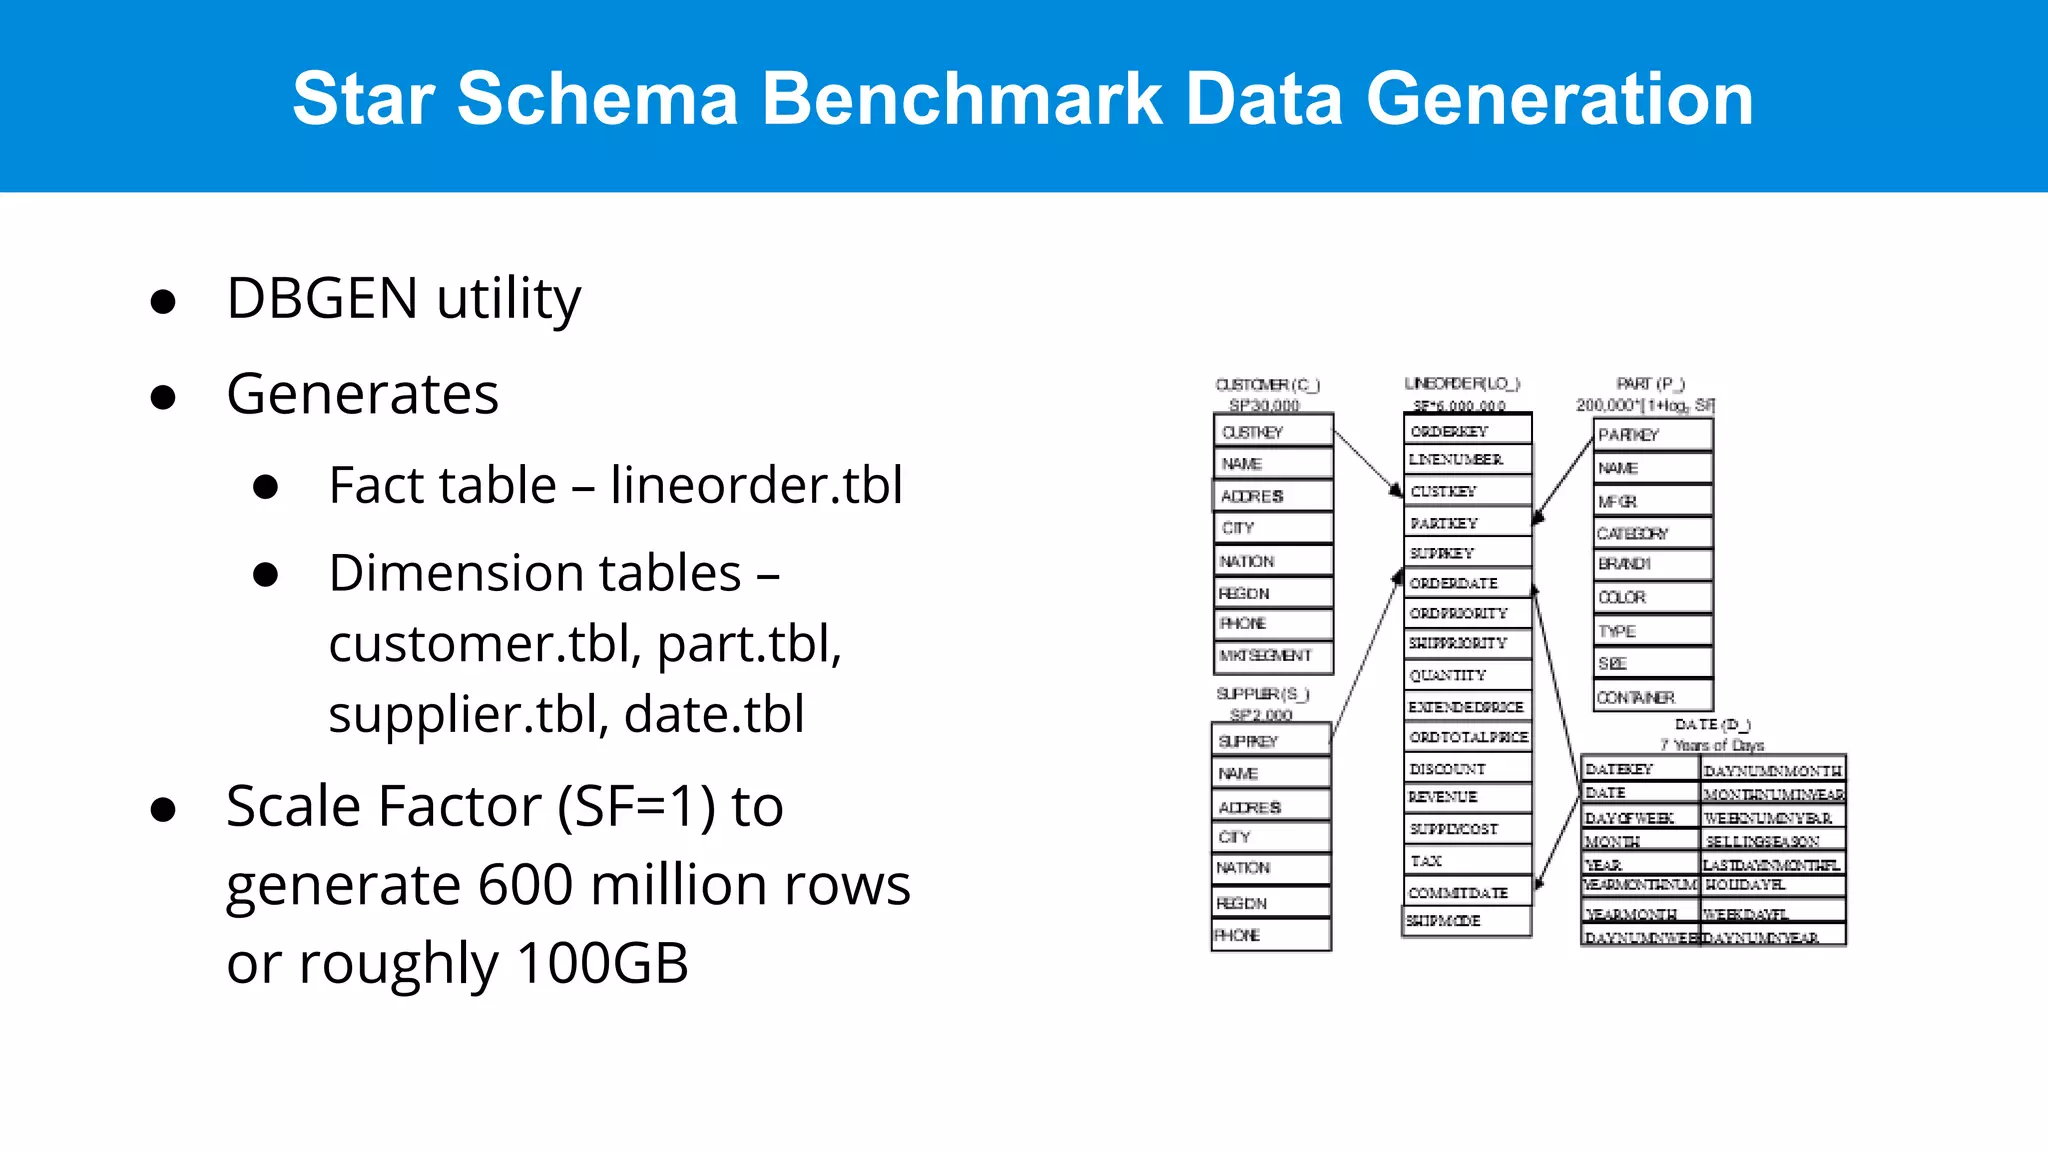
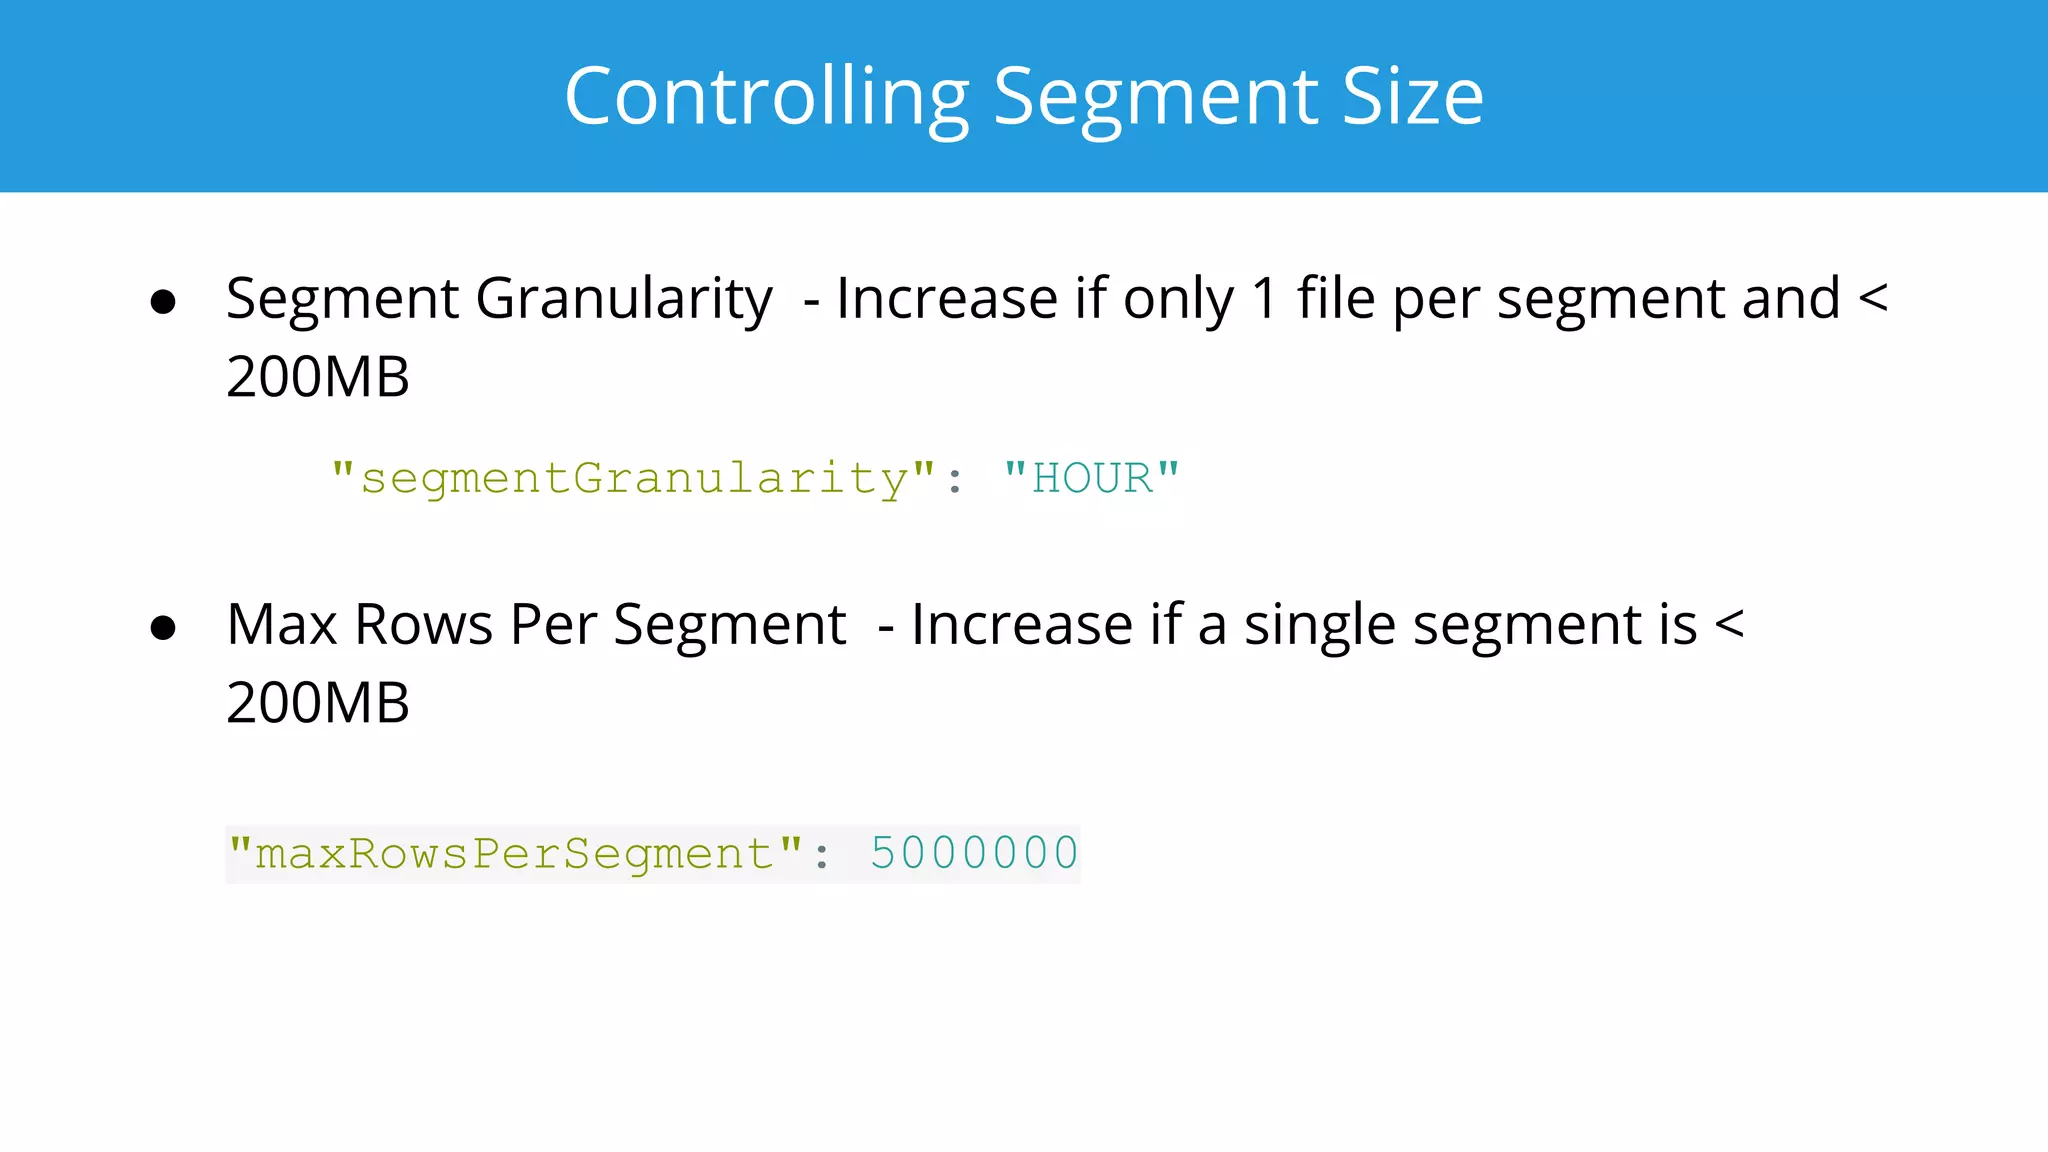
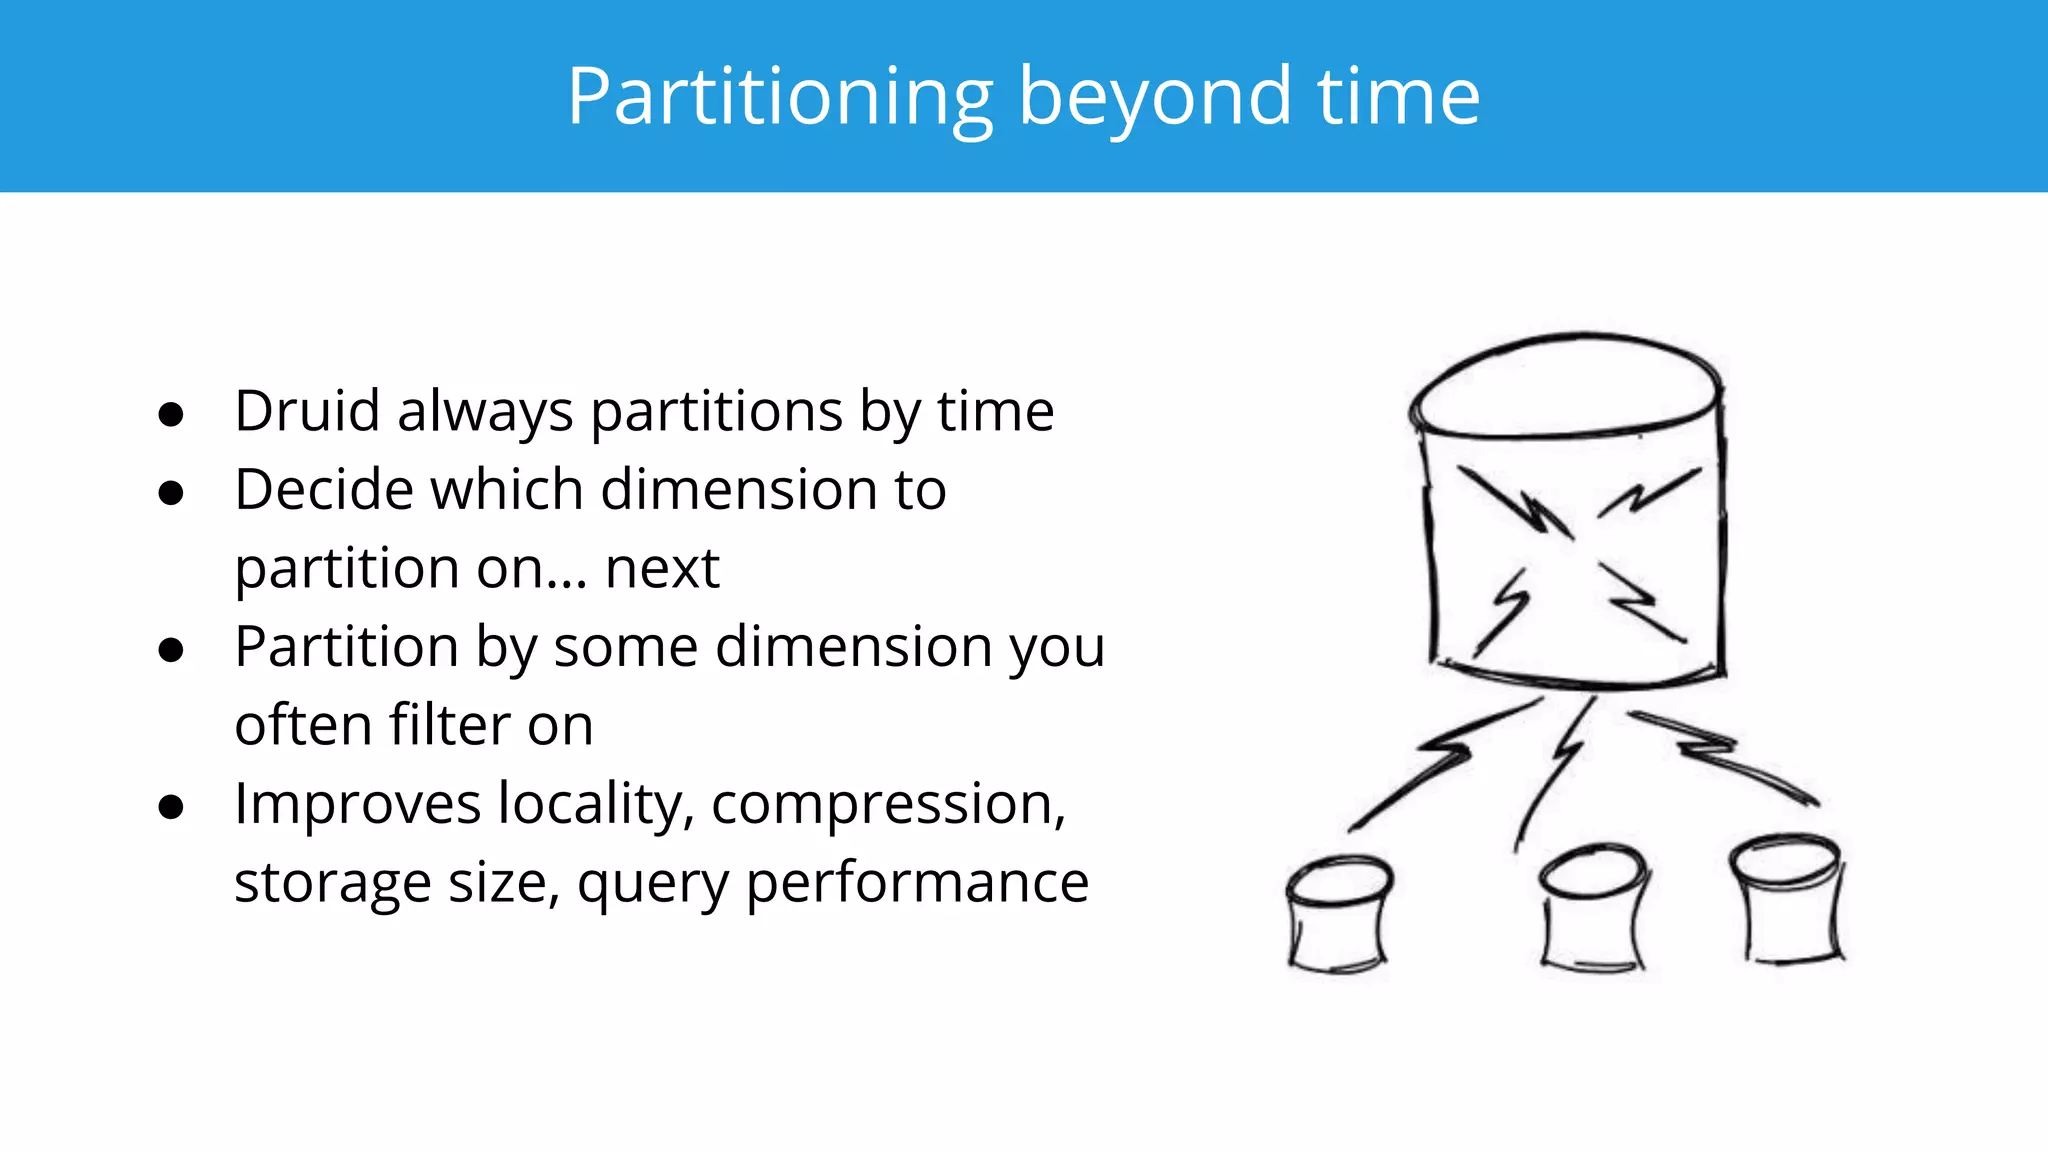
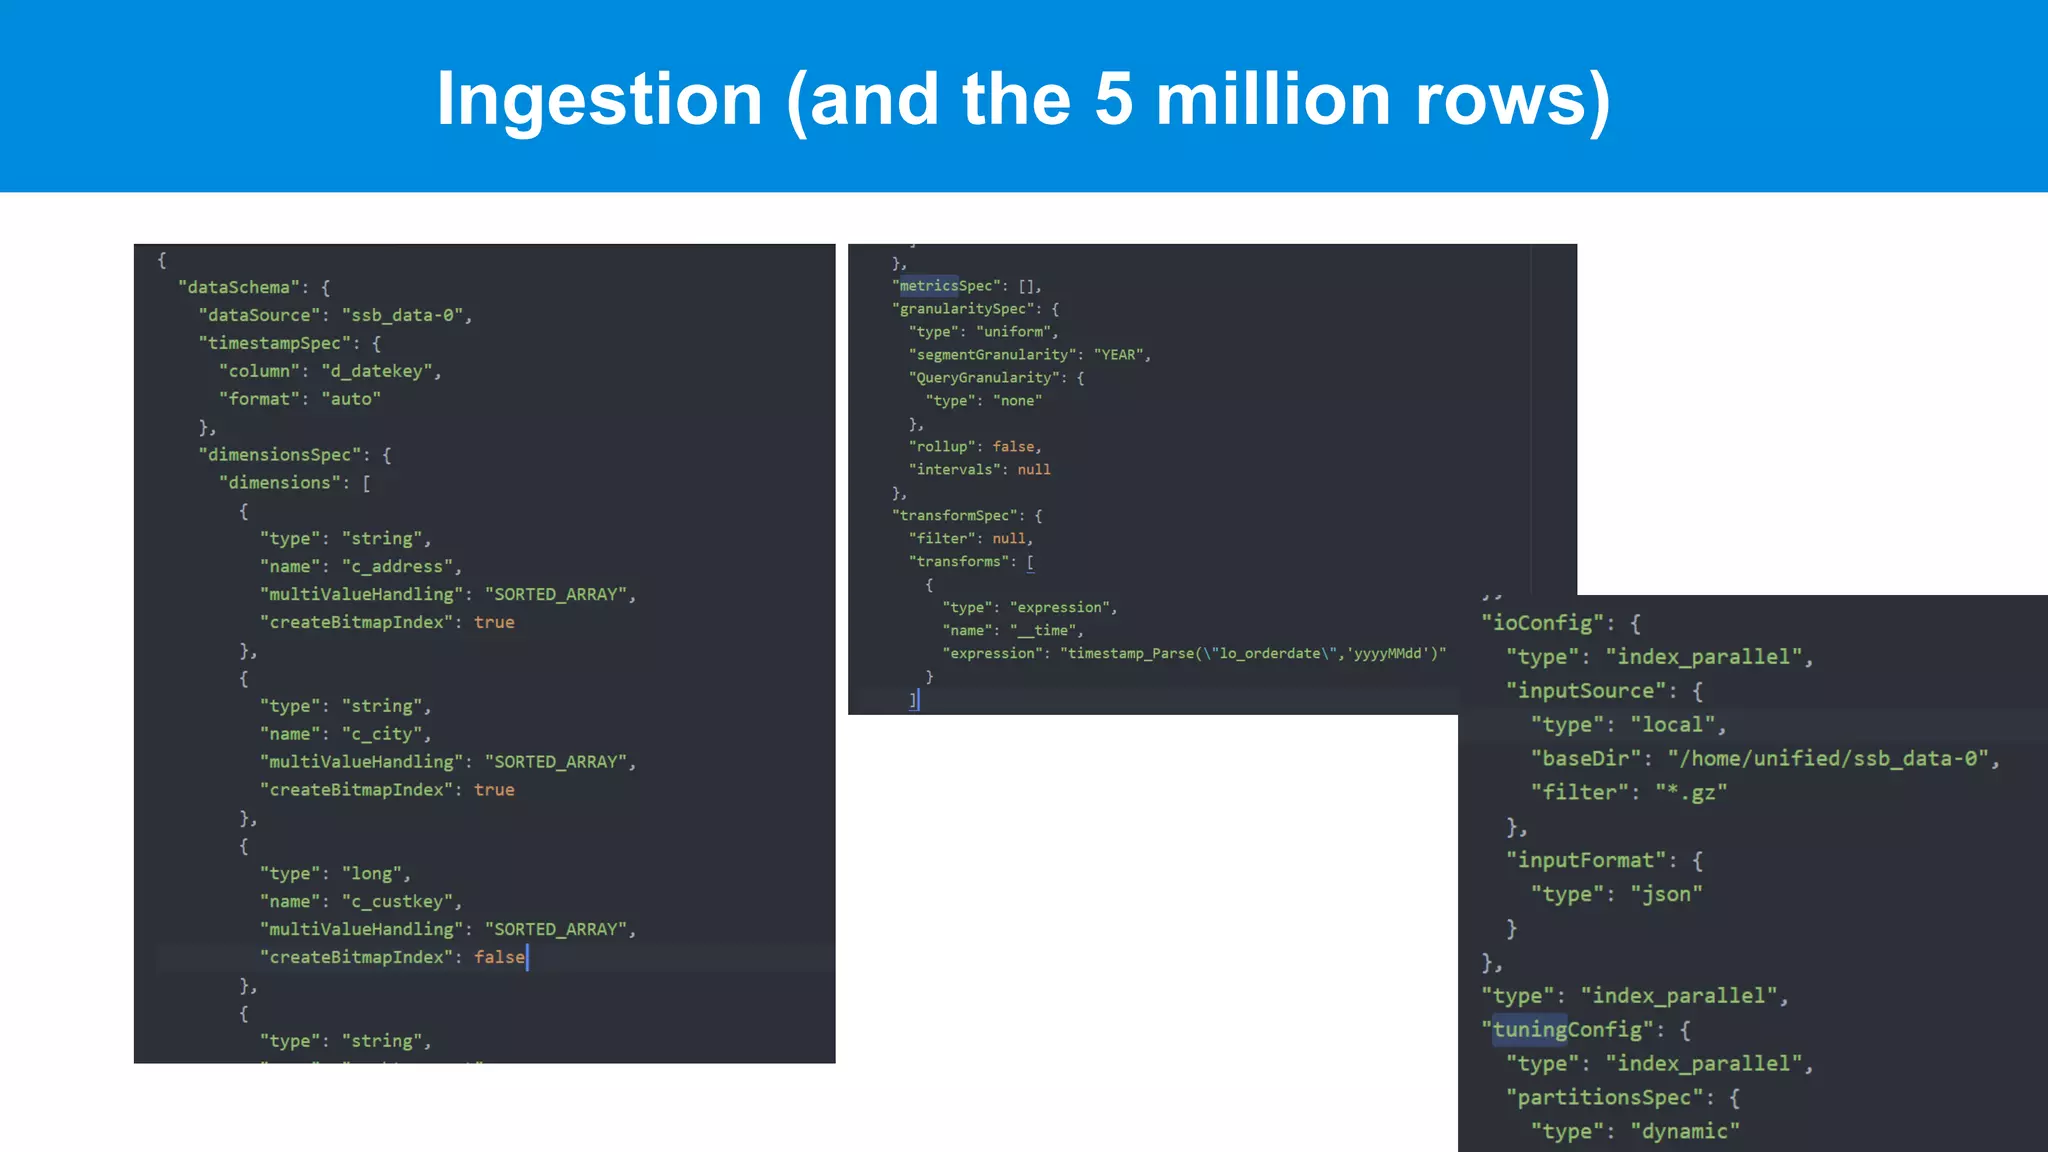
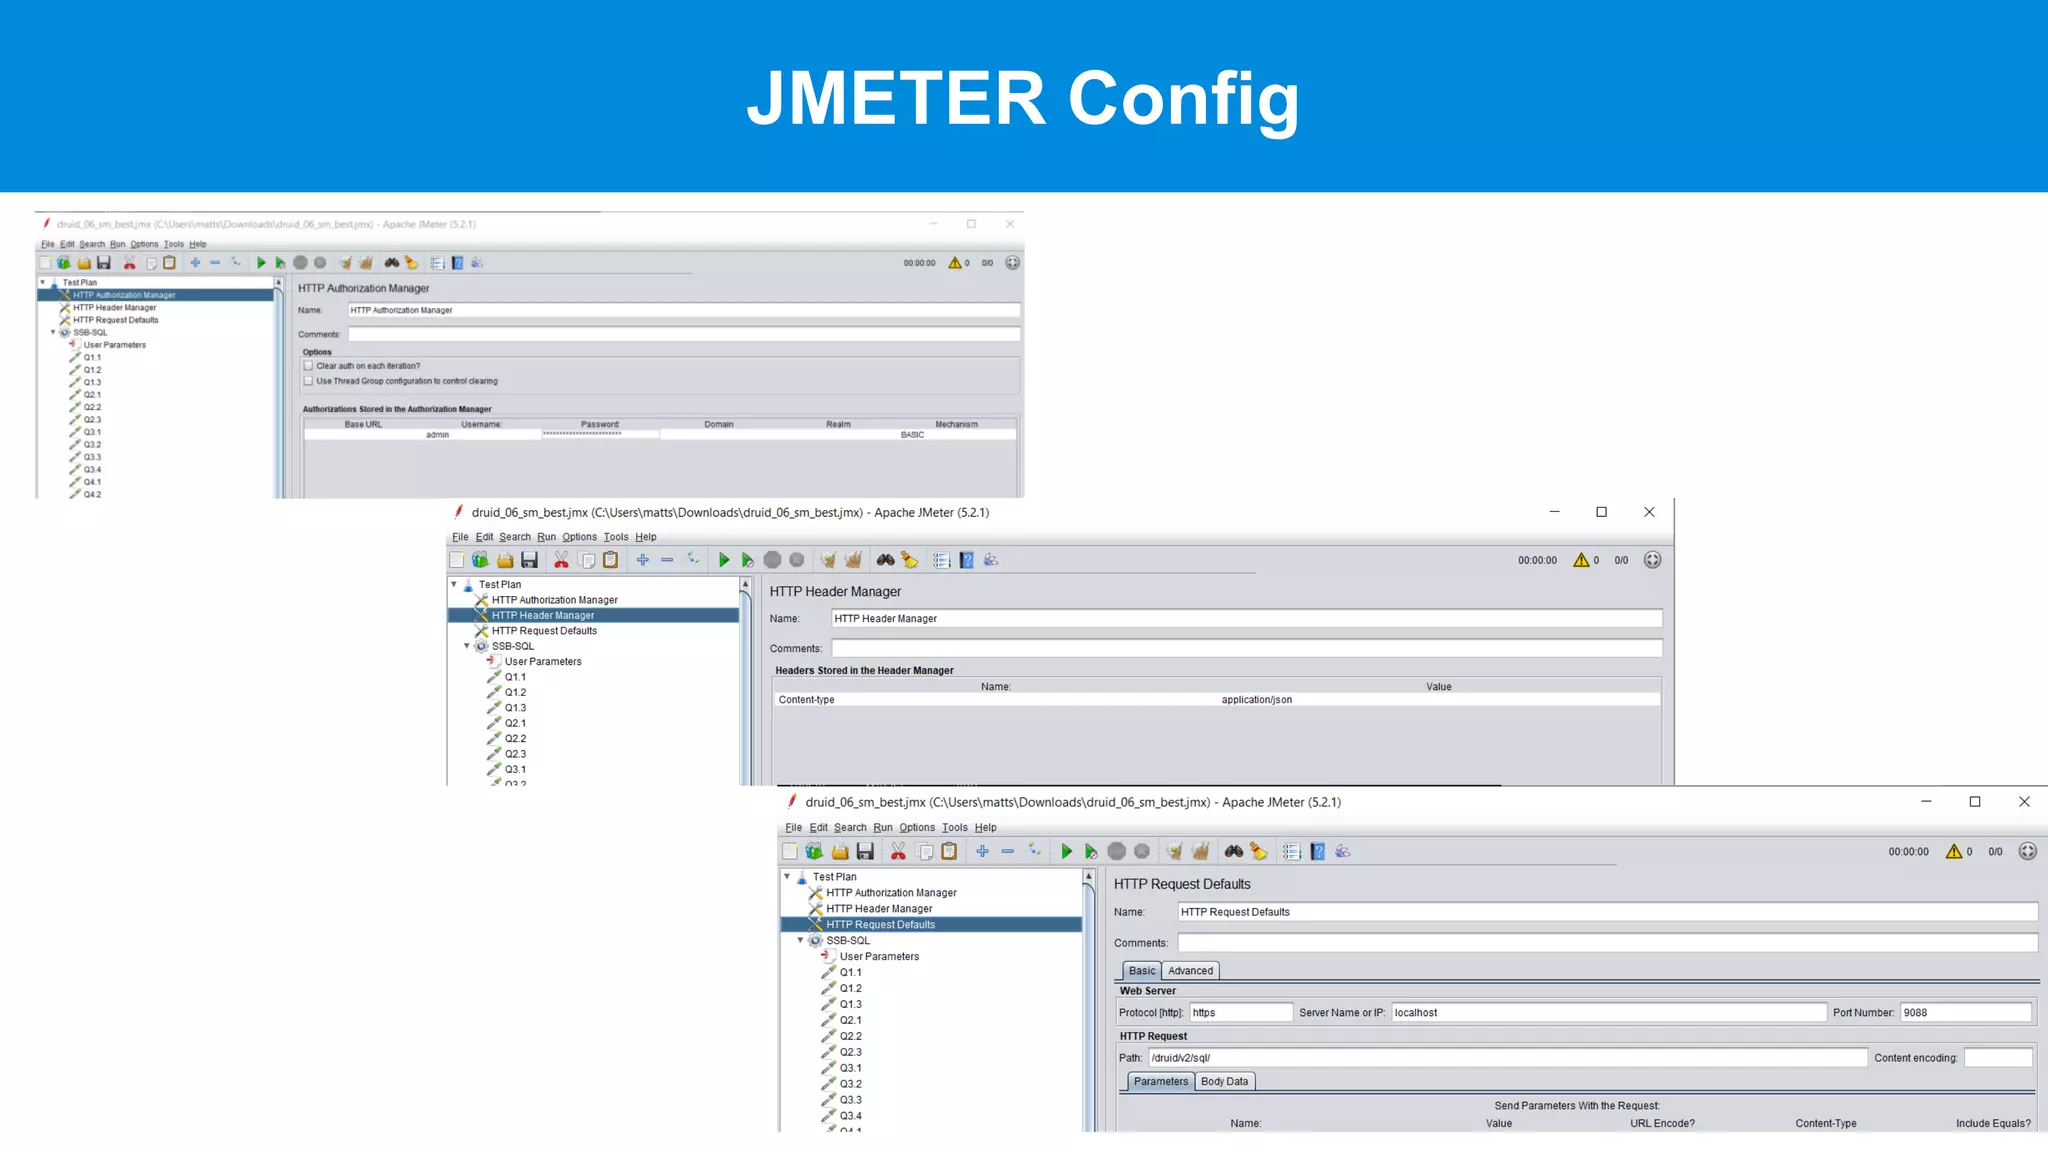
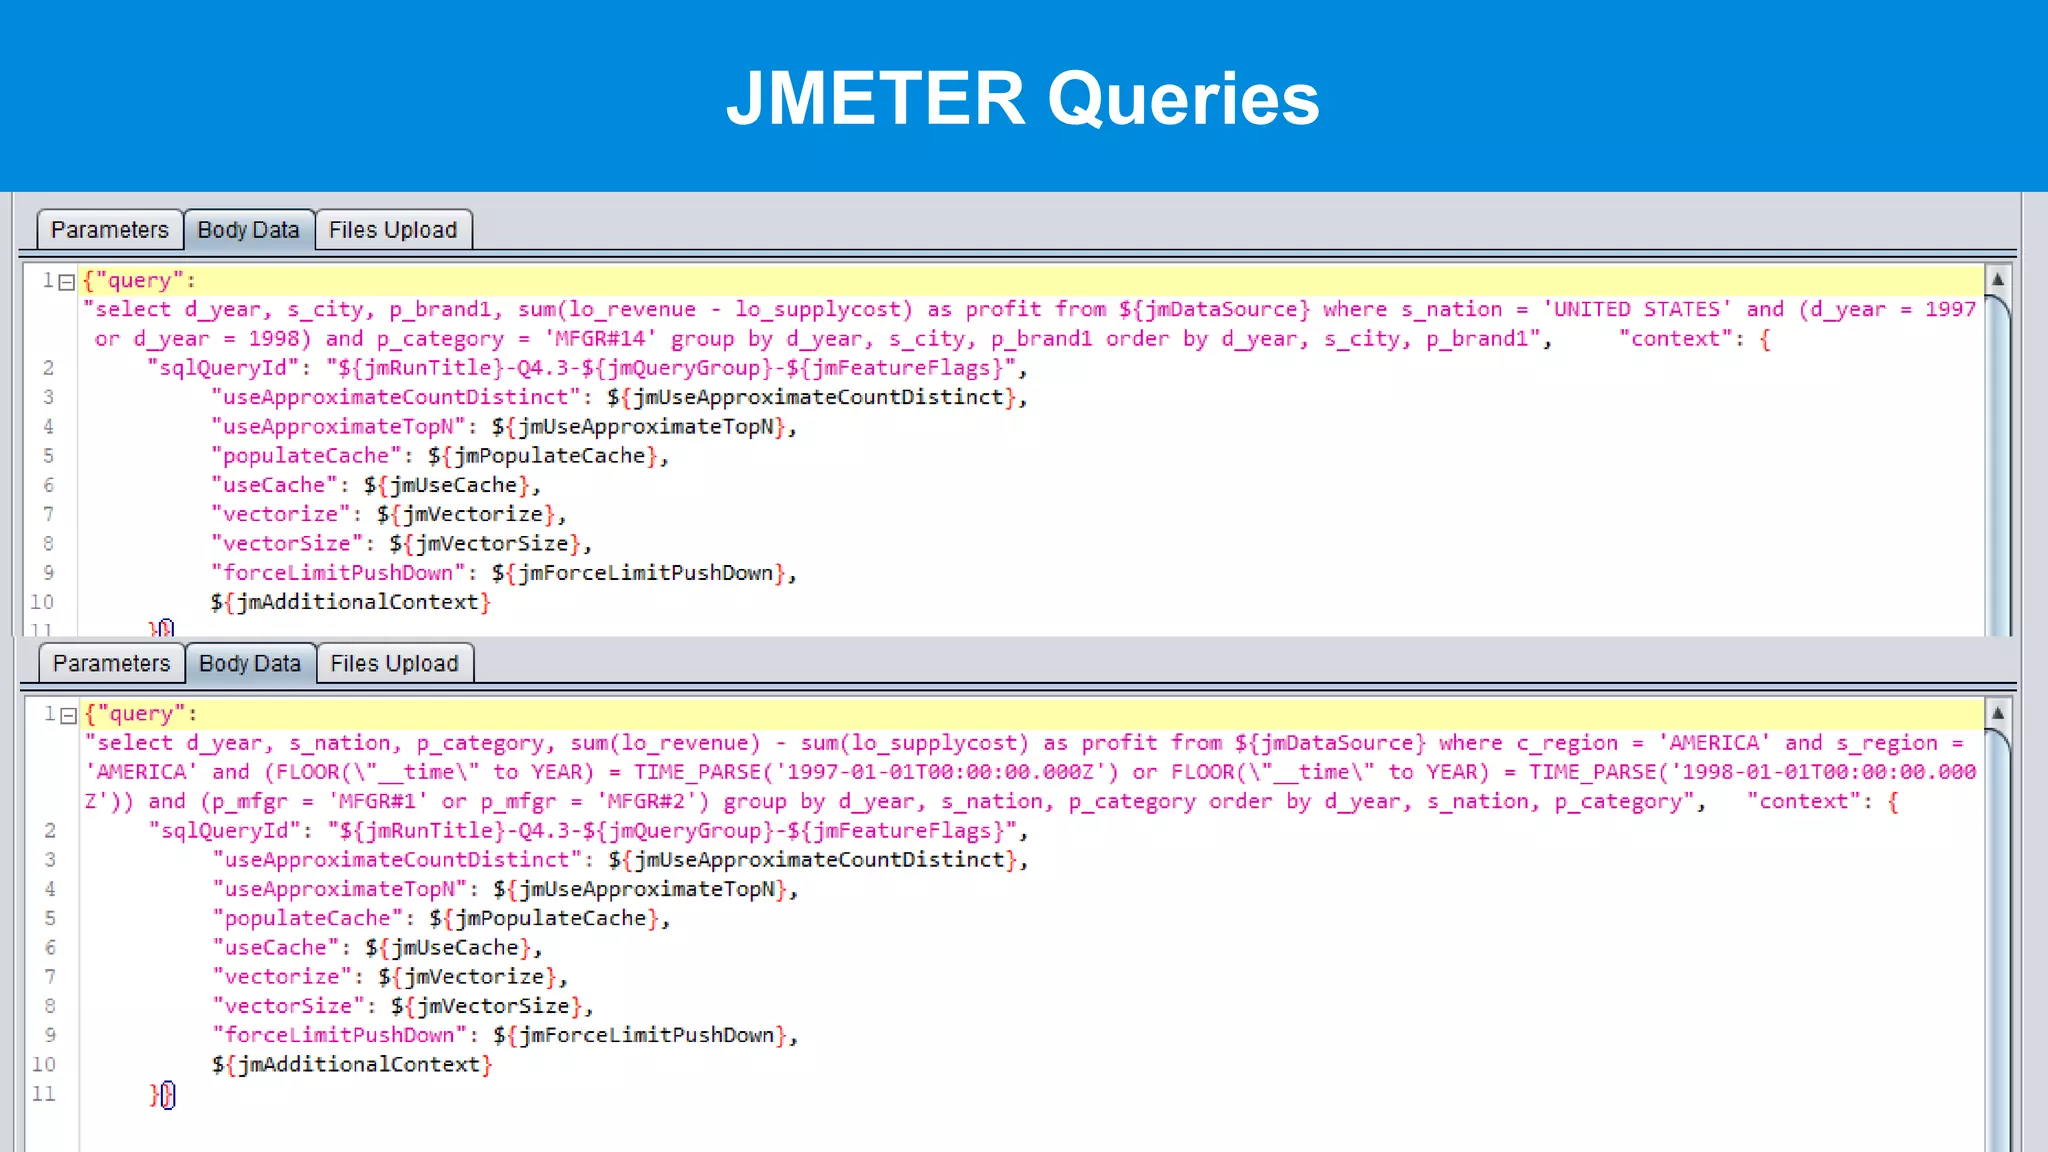
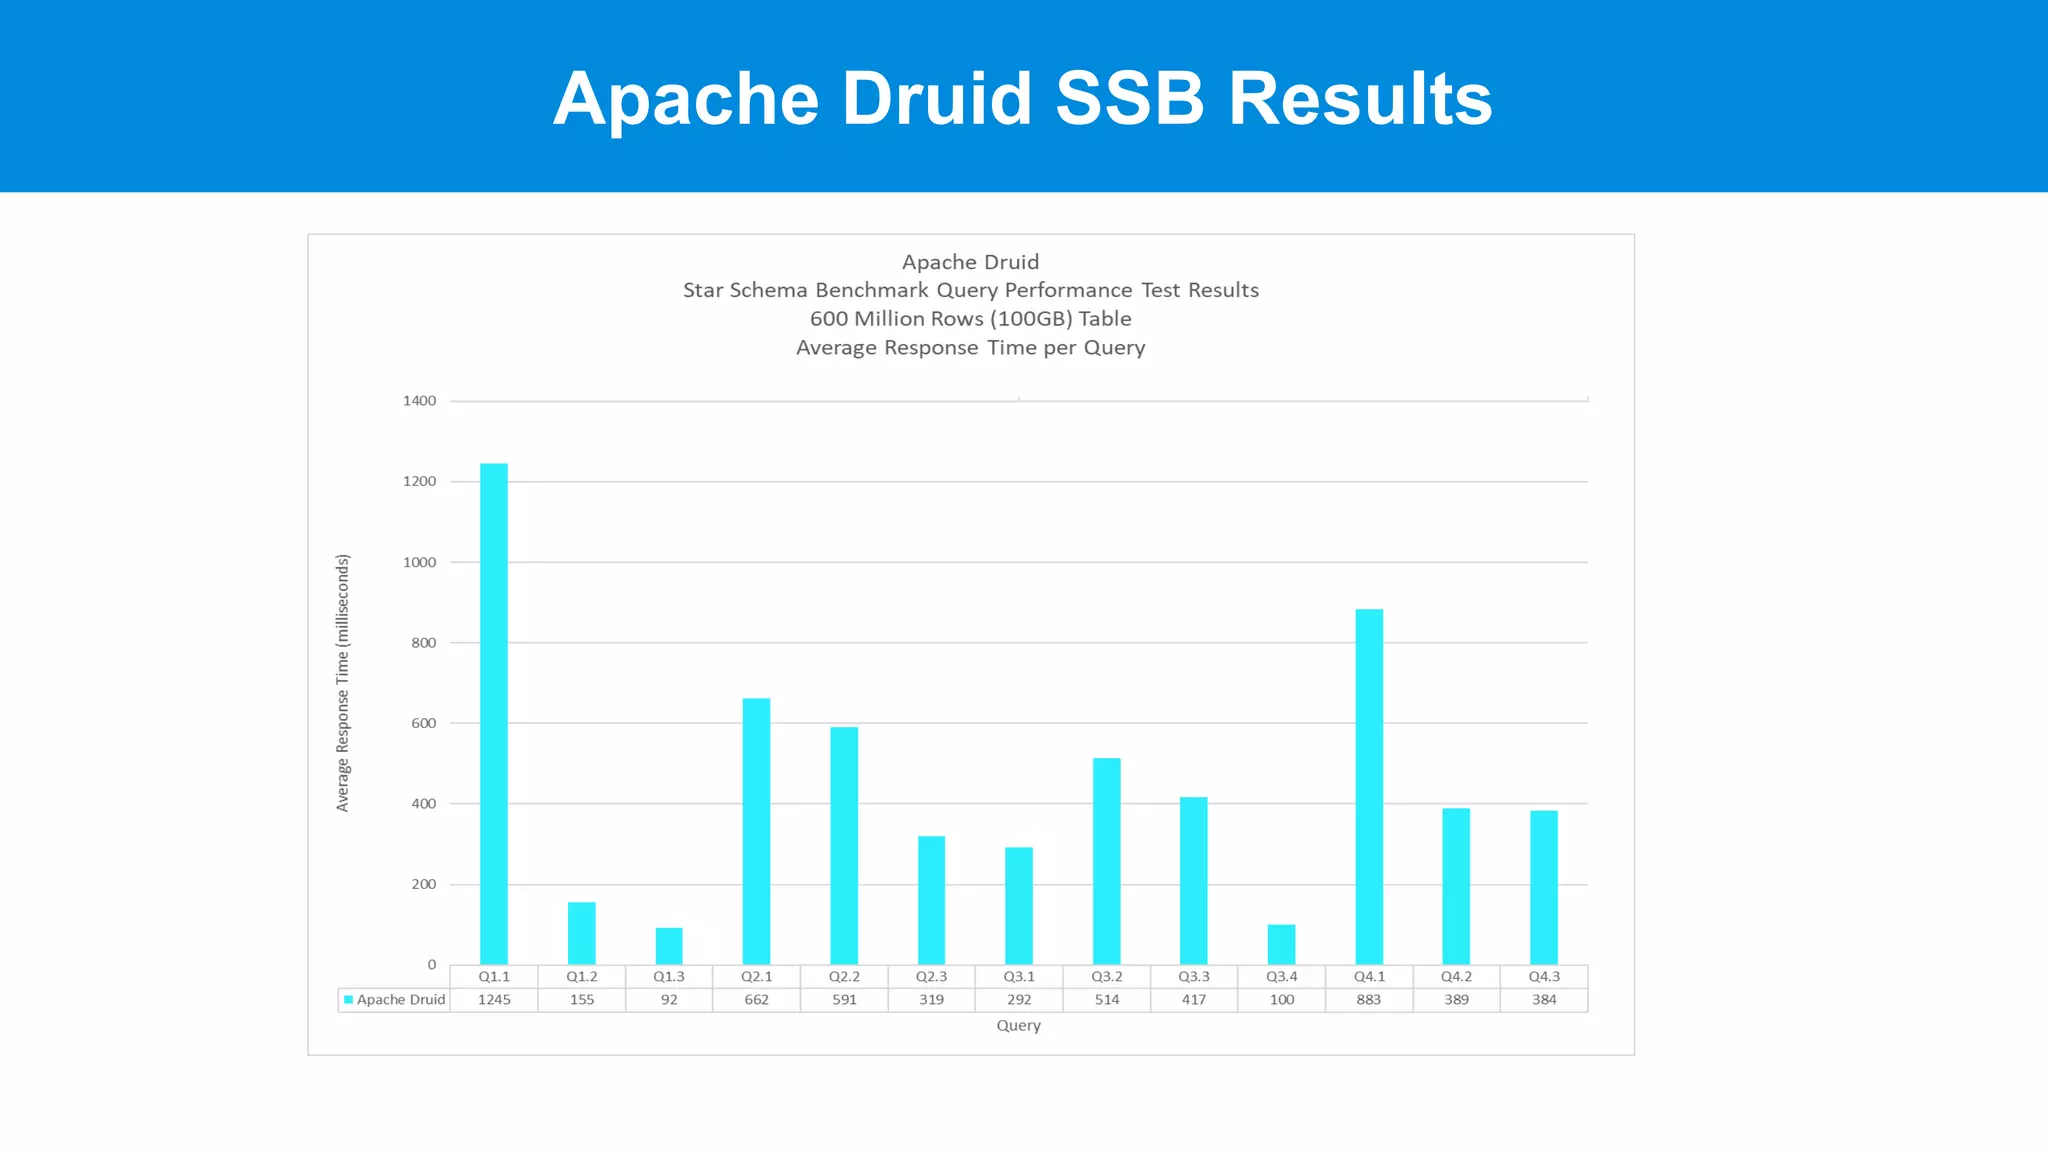
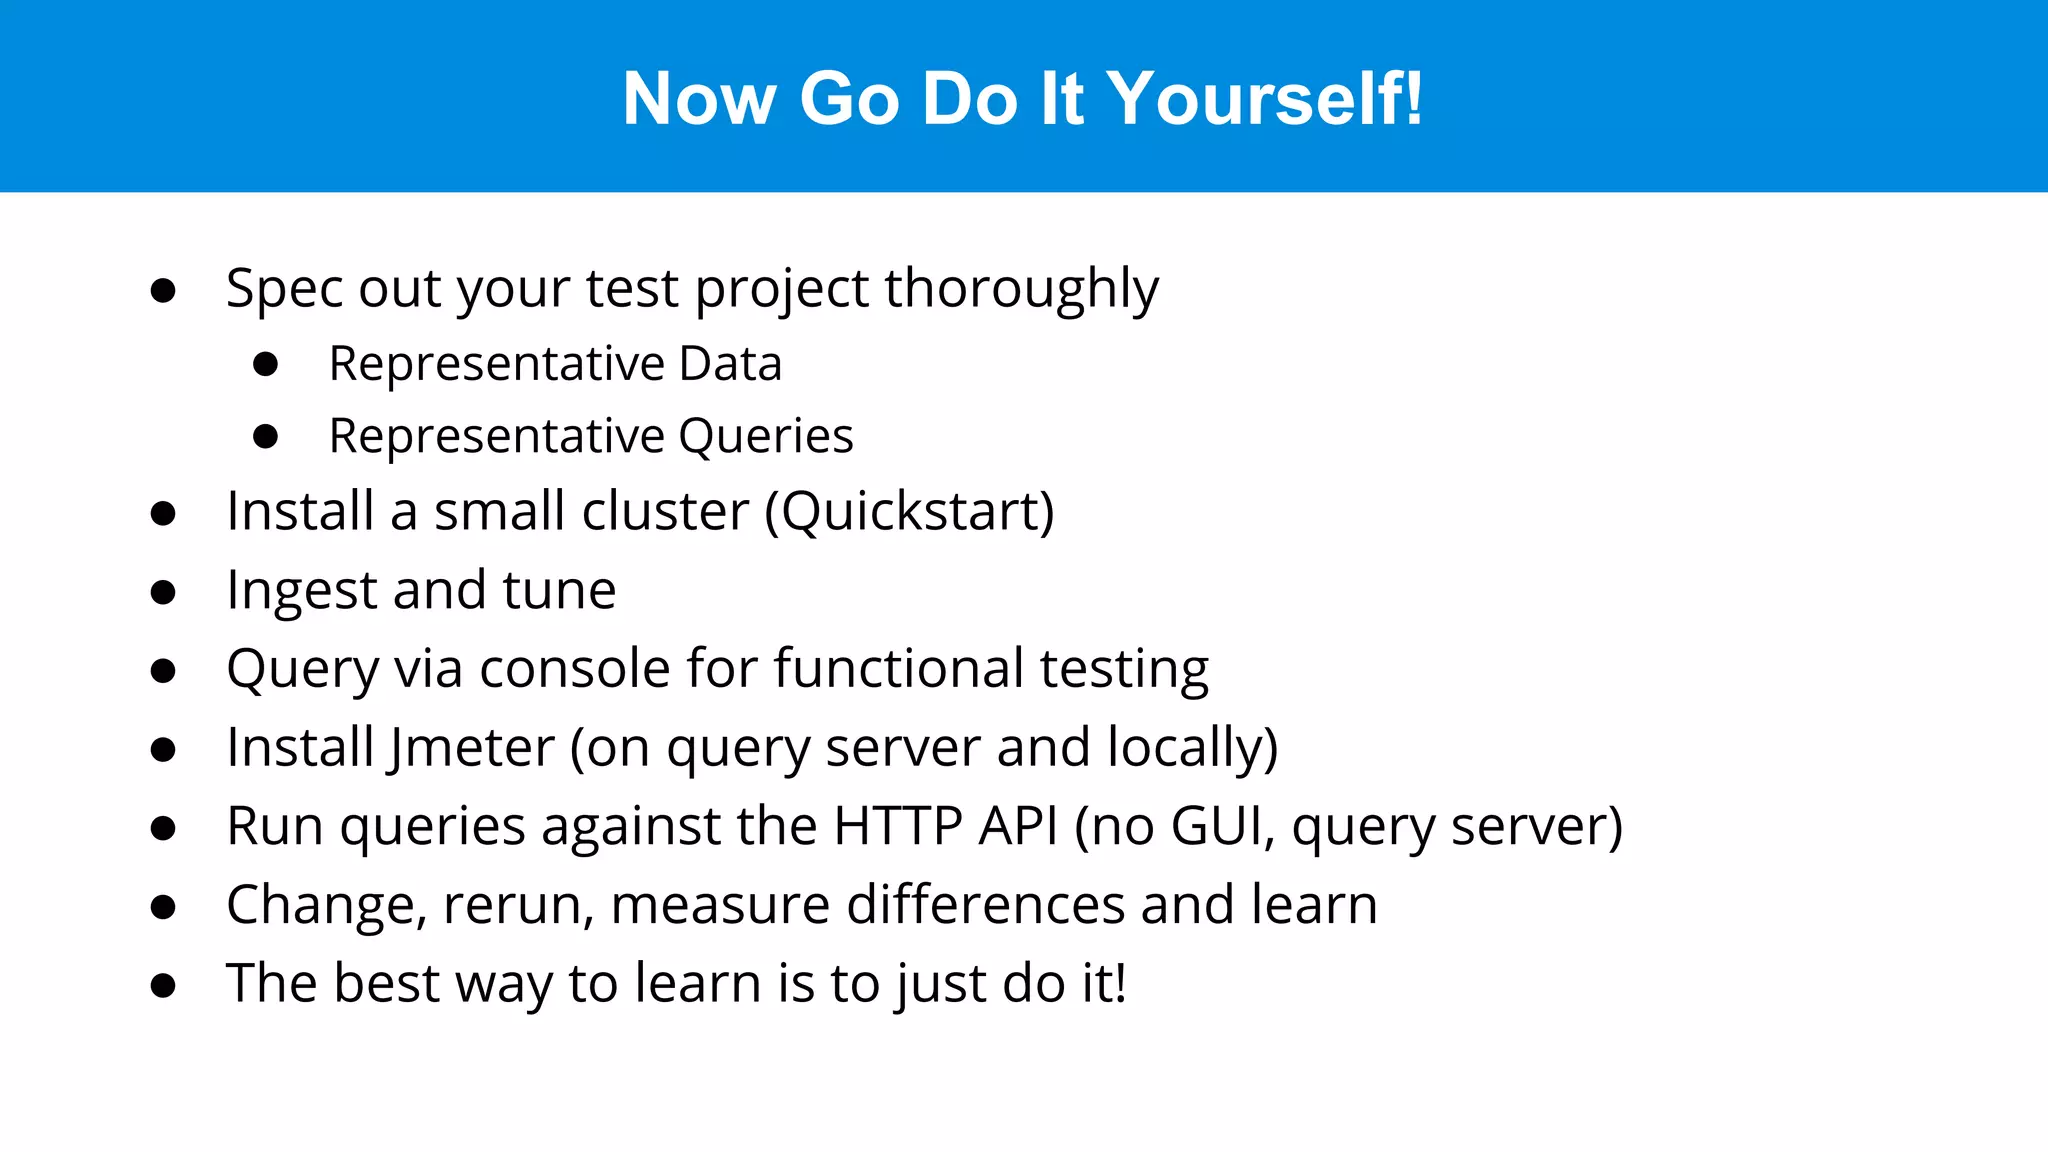
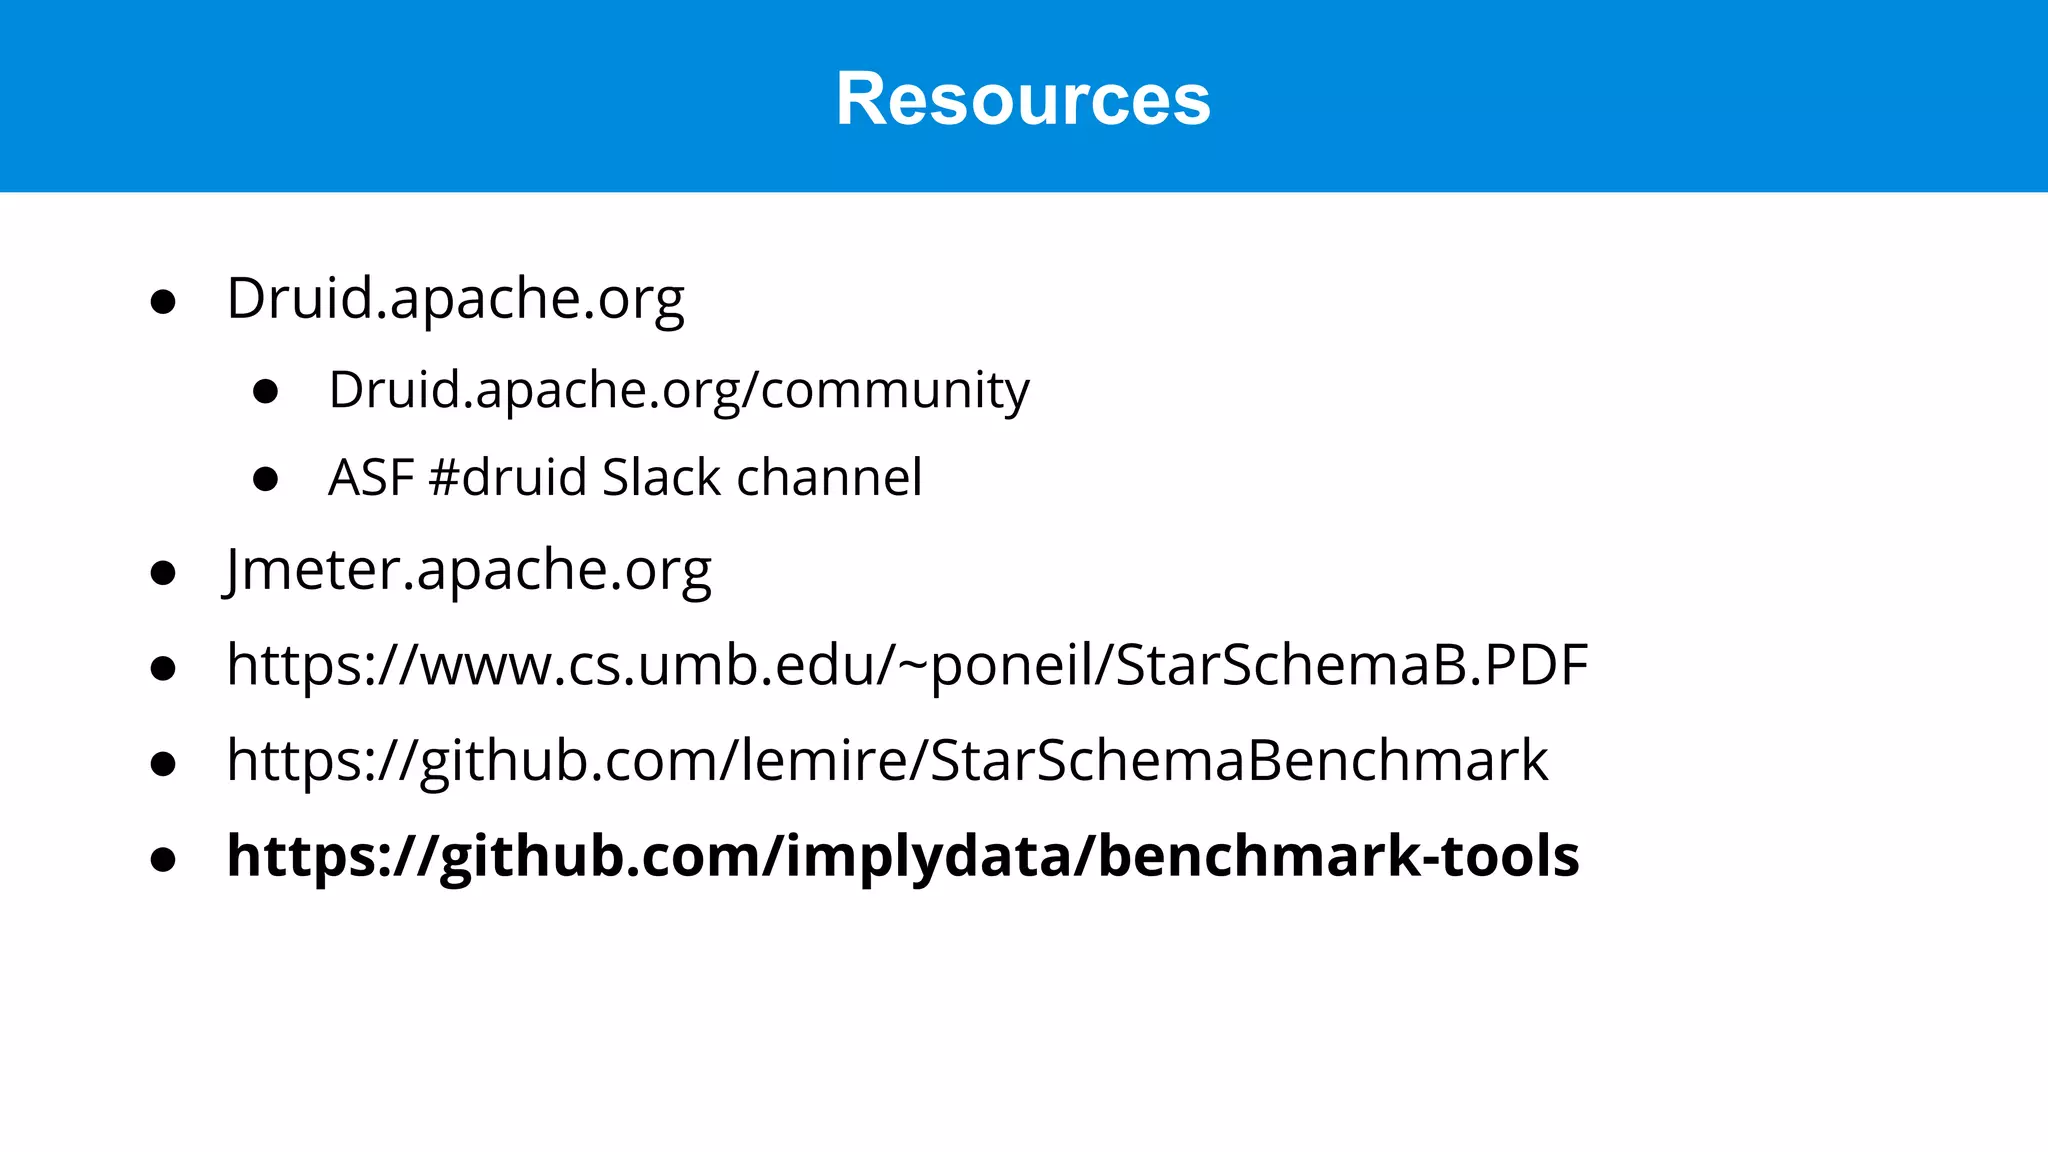

This document discusses benchmarking Apache Druid using the Star Schema Benchmark (SSB). It describes ingesting SSB data into Druid, optimizing queries and segments, running queries using JMeter, and the results. Key aspects covered include partitioning data, controlling segment size, explaining query plans, and configuring JMeter. The document encourages readers to try benchmarking Druid themselves to better learn how to optimize it for their own use cases and data.