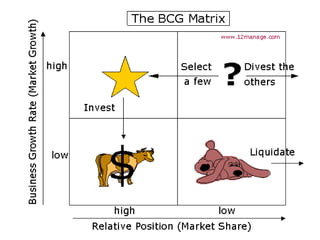
BCG/PORTFOLIO MATRIX
 The Boston Consulting Group is a leading management         consulting firm which developed and popularized the growth  share matrix.
It was first propounded by Bruce Henderson of the Boston Consulting Group in the early 1970’s.
It is also known as BCG matrix , Boston Consulting Group Matrix, BCG Growth-Share Matrix or Matrix Quadrants.
This helps the company allocate resources and is used as an analytical tool in brand marketing, product management, strategic management, and portfolio analysis.It is based on the assumption that a company can classify its business units into four categories based on combinations of market growth and market share.
The basic idea behind it is that bigger the market share a product has or the faster a product grows, the better it is for the company.41352768
In the above diagram the eight circles represent the current sizes and positions various business units in an imaginary company.
 The size of the circle represent the dollar volume of each business.
Thus we can see that circles 5 and 6 are the two largest business.
The location of each business unit indicates its market growth and relative market share.
The market growth indicates the annual growth rate of the market in which the business operates.
The Growth share matrix has been divided into four cells each indicating a different type of business.QUESTION MARKSTARSCASH COWSDOGS

Bcg new

  • 1.
  • 2.
    The BostonConsulting Group is a leading management consulting firm which developed and popularized the growth share matrix.
  • 3.
    It was firstpropounded by Bruce Henderson of the Boston Consulting Group in the early 1970’s.
  • 4.
    It is alsoknown as BCG matrix , Boston Consulting Group Matrix, BCG Growth-Share Matrix or Matrix Quadrants.
  • 5.
    This helps thecompany allocate resources and is used as an analytical tool in brand marketing, product management, strategic management, and portfolio analysis.It is based on the assumption that a company can classify its business units into four categories based on combinations of market growth and market share.
  • 6.
    The basic ideabehind it is that bigger the market share a product has or the faster a product grows, the better it is for the company.41352768
  • 7.
    In the abovediagram the eight circles represent the current sizes and positions various business units in an imaginary company.
  • 8.
    The sizeof the circle represent the dollar volume of each business.
  • 9.
    Thus we cansee that circles 5 and 6 are the two largest business.
  • 10.
    The location ofeach business unit indicates its market growth and relative market share.
  • 11.
    The market growthindicates the annual growth rate of the market in which the business operates.
  • 12.
    The Growth sharematrix has been divided into four cells each indicating a different type of business.QUESTION MARKSTARSCASH COWSDOGS