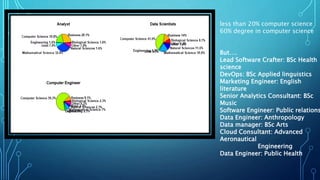
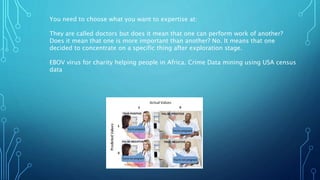
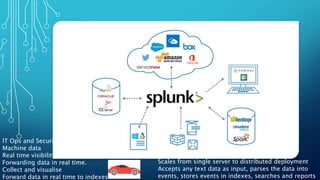
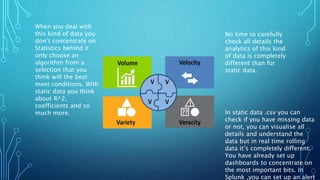
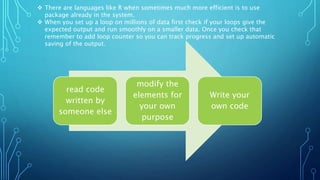
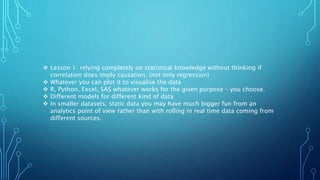
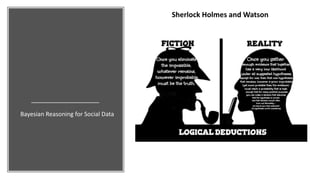
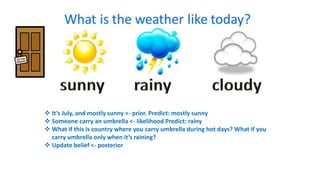
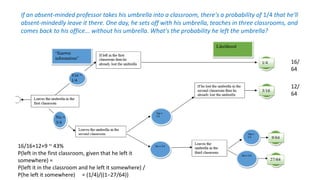
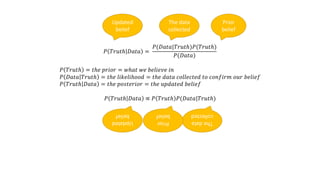
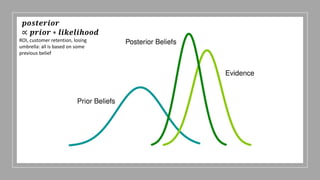
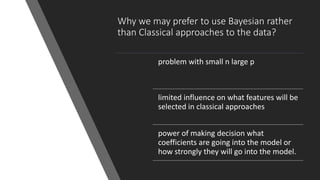
The document discusses insights from analyzing LinkedIn profiles related to data professions, exploring various roles, backgrounds, and the importance of specialization in the field. It highlights lessons learned in data engineering and analytics, including the application of Bayesian reasoning for decision-making under uncertainty. Furthermore, it emphasizes the differences in approaches between static and real-time data analytics, showcasing the significance of statistical thinking and practical application of tools like R and Python.
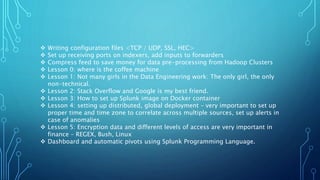


![Big Data [sorry] & Data Science: What Does a Data Scientist Do?](https://cdn.slidesharecdn.com/ss_thumbnails/dslatcloudmsevent20130125-130126065651-phpapp01-thumbnail.jpg?width=640&height=640&fit=bounds)