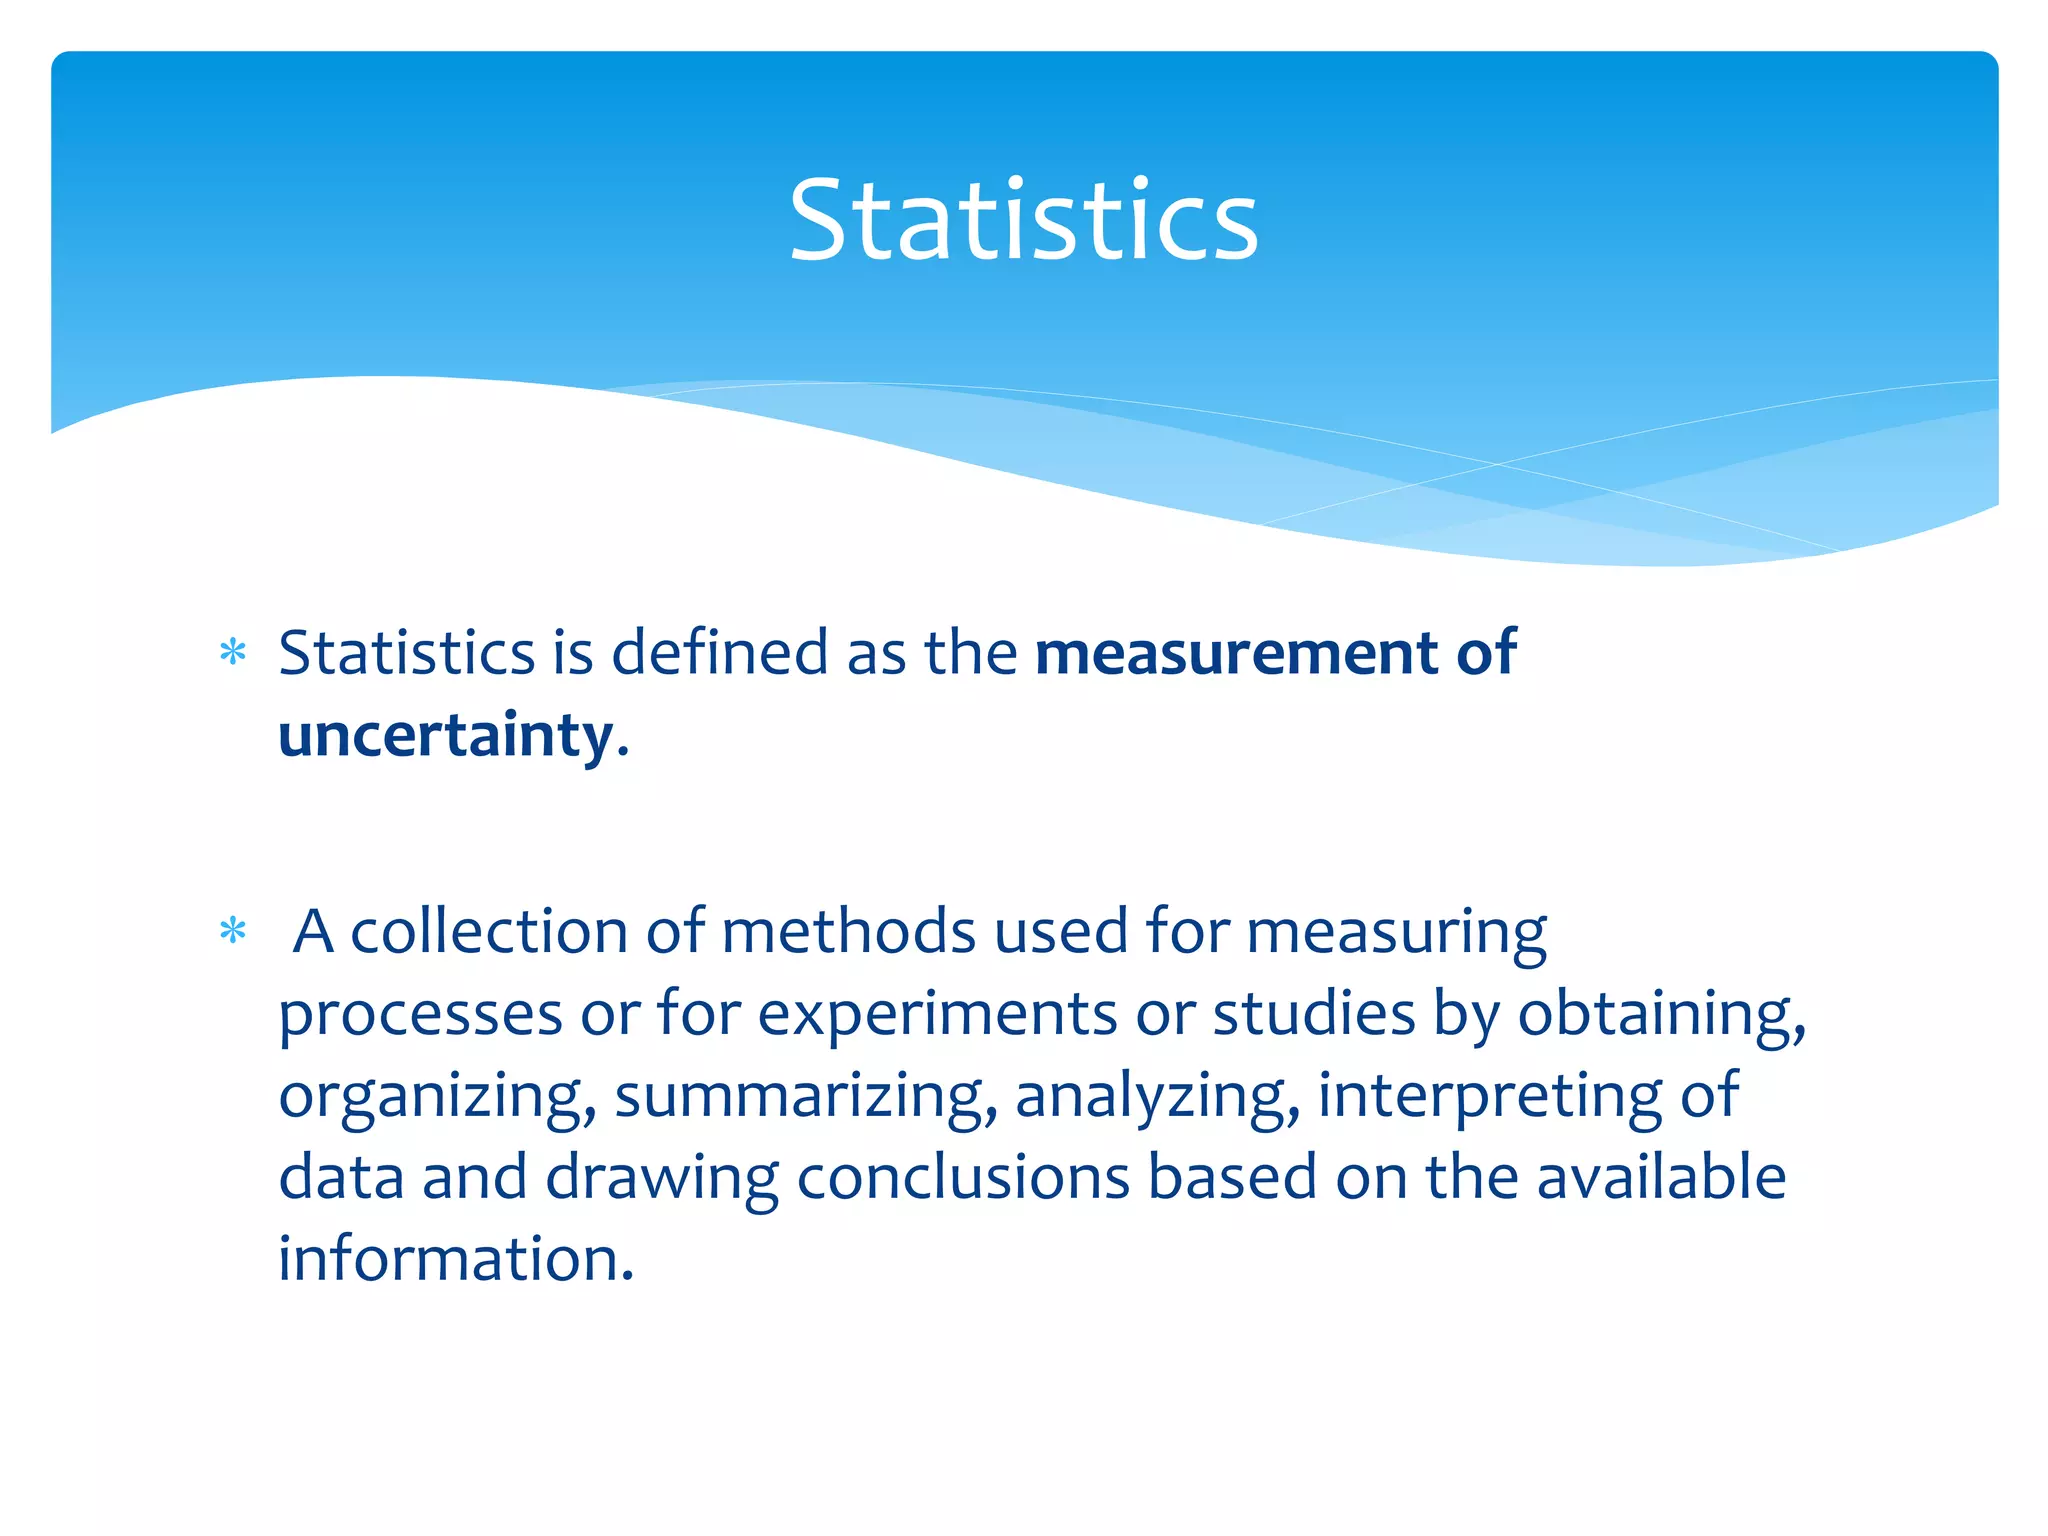
Basics of Statistics
Prepared and Presented by
MN Kiranmai, BSC RN, MSC Psychology
QPS OFFICER
Quality and patient Safety
KSA
 Data can be defined as a representation of facts,
concepts or instructions in a formalized manner
which should be suitable for communication,
interpretation or processing by human or electronic
machine.
 Information is organized or classified data which has
some meaningful values for the receiver. Information
is the processed data on which decisions and actions
are based.
What is the difference between Data and
Information?
Processing of data with meaningful value results in
information that enhances decision making
 Statistics is defined as the measurement of
uncertainty.
 A collection of methods used for measuring
processes or for experiments or studies by obtaining,
organizing, summarizing, analyzing, interpreting of
data and drawing conclusions based on the available
information.
Statistics
 Descriptive
 Inferential
 Descriptive Stats: Descriptive statistic will describe
that set of measurements.
 Inferential Stats: Uses data gathered from a sample to
make inferences about the larger population from
which the sample was drawn.
Types of Statistics
Differences Between Descriptive And
Inferential Stats
Qualitative Data and Quantitative Data
Types of data
Types of Qualitative and Quantitative
Data
 Scales of measurements:
1. Nominal Scale (Qualitative)
2. Ordinal Scale (Qualitative)
3. Interval Scale (Quantitative)
4. Ratio (Quantitative)
Scales to measure Qualitative and
Quantitative Data
Each single data variable has a
meaning in Statistics
VARIABLES HAVE MEANING
 Discrete data can
be numeric -- like
numbers of apples --
but it can also be
categorical -- like
red or blue, or male
or female, or good
or bad.
Discrete Data
 Continuous data are
not restricted
to defined separate
values, but can
occupy any value
over a continuous
range
Continuous Data
 POPULATION AND
SAMPLE: Population
is everyone or
everything designated
for study with
common
characteristics. Sample
is a subset or a part of
population.
CHARECTERISTICS OF DATA
 CENTRAL
TENDENCY: THE
TYPICAL VALUE
OF
REPRESENTING
THE “MIDDLE
VALUE” OR
AVERAGE OF
THE DATA
CHARECTERISTICS OF DATA
 VARIATION: It
informally
measures how
far a set of
numbers or
values in the
data are spread
out or dispersed
from their mean
like range,
variance,
coefficient of
variance and
standard
deviation
CHARECTERISTICS OF DATA
 DISTRIBUTION :
It is a listing or
function
showing all the
possible values
or intervals of
the data and
how often they
occur usually
represented a
“bell curve”.
CHARECTERISTICS OF DATA
 UNUSUAL
VALUES OR
OUTLIERS:
Outliers are values
that are far from
normal distribution
representing
‘problem areas” .
CHARECTERISTICS OF DATA
 REPRESENTS FACTS
 SIMPLIFIES INFORMATION SUPPORTED BY DATA
 ASSISTS IN CLASSIFYING DATA
 AIDS IN COMPARISION OF DATA AND EXPLAINS THE CAUSES
OF CHANGE IN RESULTS
 HELPS TO UNDERSTAND RELATIONSHIPS BETWEEN DIFFERENT
OCCURANCES OR PHINOMENA
 TESTS THE HYPOTHESIS
 FACILITATES DECISION MAKING PROCESS BY PRESENTING THE
TRENDS, TENDENCIES AND OUTCOMES
 DERIVES VALID INFERENCES
FUNCTIONS OF STATISTICS
 OBSERVATIONAL AND
EXPERIMENTAL:
 Observational studies include
studying certain characteristics of
the sample with out attempting
to modify the subjects.
 Experimental studies involve in
applying some treatment,
observe and measuring its effects
on the subjects.
TYPES OF STATISTICAL STUDIES
 Retrospective study: A study done based on
examination or observation of existing data on events
that have already occurred.
 Prospective study: A study done with baseline data of
interest at hand and follow the subjects in future to
observe the effects of outcomes of interest in the
same sample.
TYPES OF STATISTICAL STUDIES
 HISTOGRAM
 RUN CHART
 PARETO CHART
 CONTROL CHART
 PIE CHART
 SCATTERED
DIAGRAM
 TALLY SHEETS
TYPES OF GRAPHS USED IN
STATISTICS
Basics of statistics

Basics of statistics

  • 1.
    Basics of Statistics Preparedand Presented by MN Kiranmai, BSC RN, MSC Psychology QPS OFFICER Quality and patient Safety KSA
  • 2.
     Data canbe defined as a representation of facts, concepts or instructions in a formalized manner which should be suitable for communication, interpretation or processing by human or electronic machine.  Information is organized or classified data which has some meaningful values for the receiver. Information is the processed data on which decisions and actions are based. What is the difference between Data and Information?
  • 3.
    Processing of datawith meaningful value results in information that enhances decision making
  • 4.
     Statistics isdefined as the measurement of uncertainty.  A collection of methods used for measuring processes or for experiments or studies by obtaining, organizing, summarizing, analyzing, interpreting of data and drawing conclusions based on the available information. Statistics
  • 5.
     Descriptive  Inferential Descriptive Stats: Descriptive statistic will describe that set of measurements.  Inferential Stats: Uses data gathered from a sample to make inferences about the larger population from which the sample was drawn. Types of Statistics
  • 6.
    Differences Between DescriptiveAnd Inferential Stats
  • 7.
    Qualitative Data andQuantitative Data Types of data
  • 8.
    Types of Qualitativeand Quantitative Data
  • 9.
     Scales ofmeasurements: 1. Nominal Scale (Qualitative) 2. Ordinal Scale (Qualitative) 3. Interval Scale (Quantitative) 4. Ratio (Quantitative) Scales to measure Qualitative and Quantitative Data
  • 10.
    Each single datavariable has a meaning in Statistics VARIABLES HAVE MEANING
  • 11.
     Discrete datacan be numeric -- like numbers of apples -- but it can also be categorical -- like red or blue, or male or female, or good or bad. Discrete Data
  • 12.
     Continuous dataare not restricted to defined separate values, but can occupy any value over a continuous range Continuous Data
  • 13.
     POPULATION AND SAMPLE:Population is everyone or everything designated for study with common characteristics. Sample is a subset or a part of population. CHARECTERISTICS OF DATA
  • 14.
     CENTRAL TENDENCY: THE TYPICALVALUE OF REPRESENTING THE “MIDDLE VALUE” OR AVERAGE OF THE DATA CHARECTERISTICS OF DATA
  • 15.
     VARIATION: It informally measureshow far a set of numbers or values in the data are spread out or dispersed from their mean like range, variance, coefficient of variance and standard deviation CHARECTERISTICS OF DATA
  • 16.
     DISTRIBUTION : Itis a listing or function showing all the possible values or intervals of the data and how often they occur usually represented a “bell curve”. CHARECTERISTICS OF DATA
  • 17.
     UNUSUAL VALUES OR OUTLIERS: Outliersare values that are far from normal distribution representing ‘problem areas” . CHARECTERISTICS OF DATA
  • 18.
     REPRESENTS FACTS SIMPLIFIES INFORMATION SUPPORTED BY DATA  ASSISTS IN CLASSIFYING DATA  AIDS IN COMPARISION OF DATA AND EXPLAINS THE CAUSES OF CHANGE IN RESULTS  HELPS TO UNDERSTAND RELATIONSHIPS BETWEEN DIFFERENT OCCURANCES OR PHINOMENA  TESTS THE HYPOTHESIS  FACILITATES DECISION MAKING PROCESS BY PRESENTING THE TRENDS, TENDENCIES AND OUTCOMES  DERIVES VALID INFERENCES FUNCTIONS OF STATISTICS
  • 19.
     OBSERVATIONAL AND EXPERIMENTAL: Observational studies include studying certain characteristics of the sample with out attempting to modify the subjects.  Experimental studies involve in applying some treatment, observe and measuring its effects on the subjects. TYPES OF STATISTICAL STUDIES
  • 20.
     Retrospective study:A study done based on examination or observation of existing data on events that have already occurred.  Prospective study: A study done with baseline data of interest at hand and follow the subjects in future to observe the effects of outcomes of interest in the same sample. TYPES OF STATISTICAL STUDIES
  • 21.
     HISTOGRAM  RUNCHART  PARETO CHART  CONTROL CHART  PIE CHART  SCATTERED DIAGRAM  TALLY SHEETS TYPES OF GRAPHS USED IN STATISTICS