Download to read offline

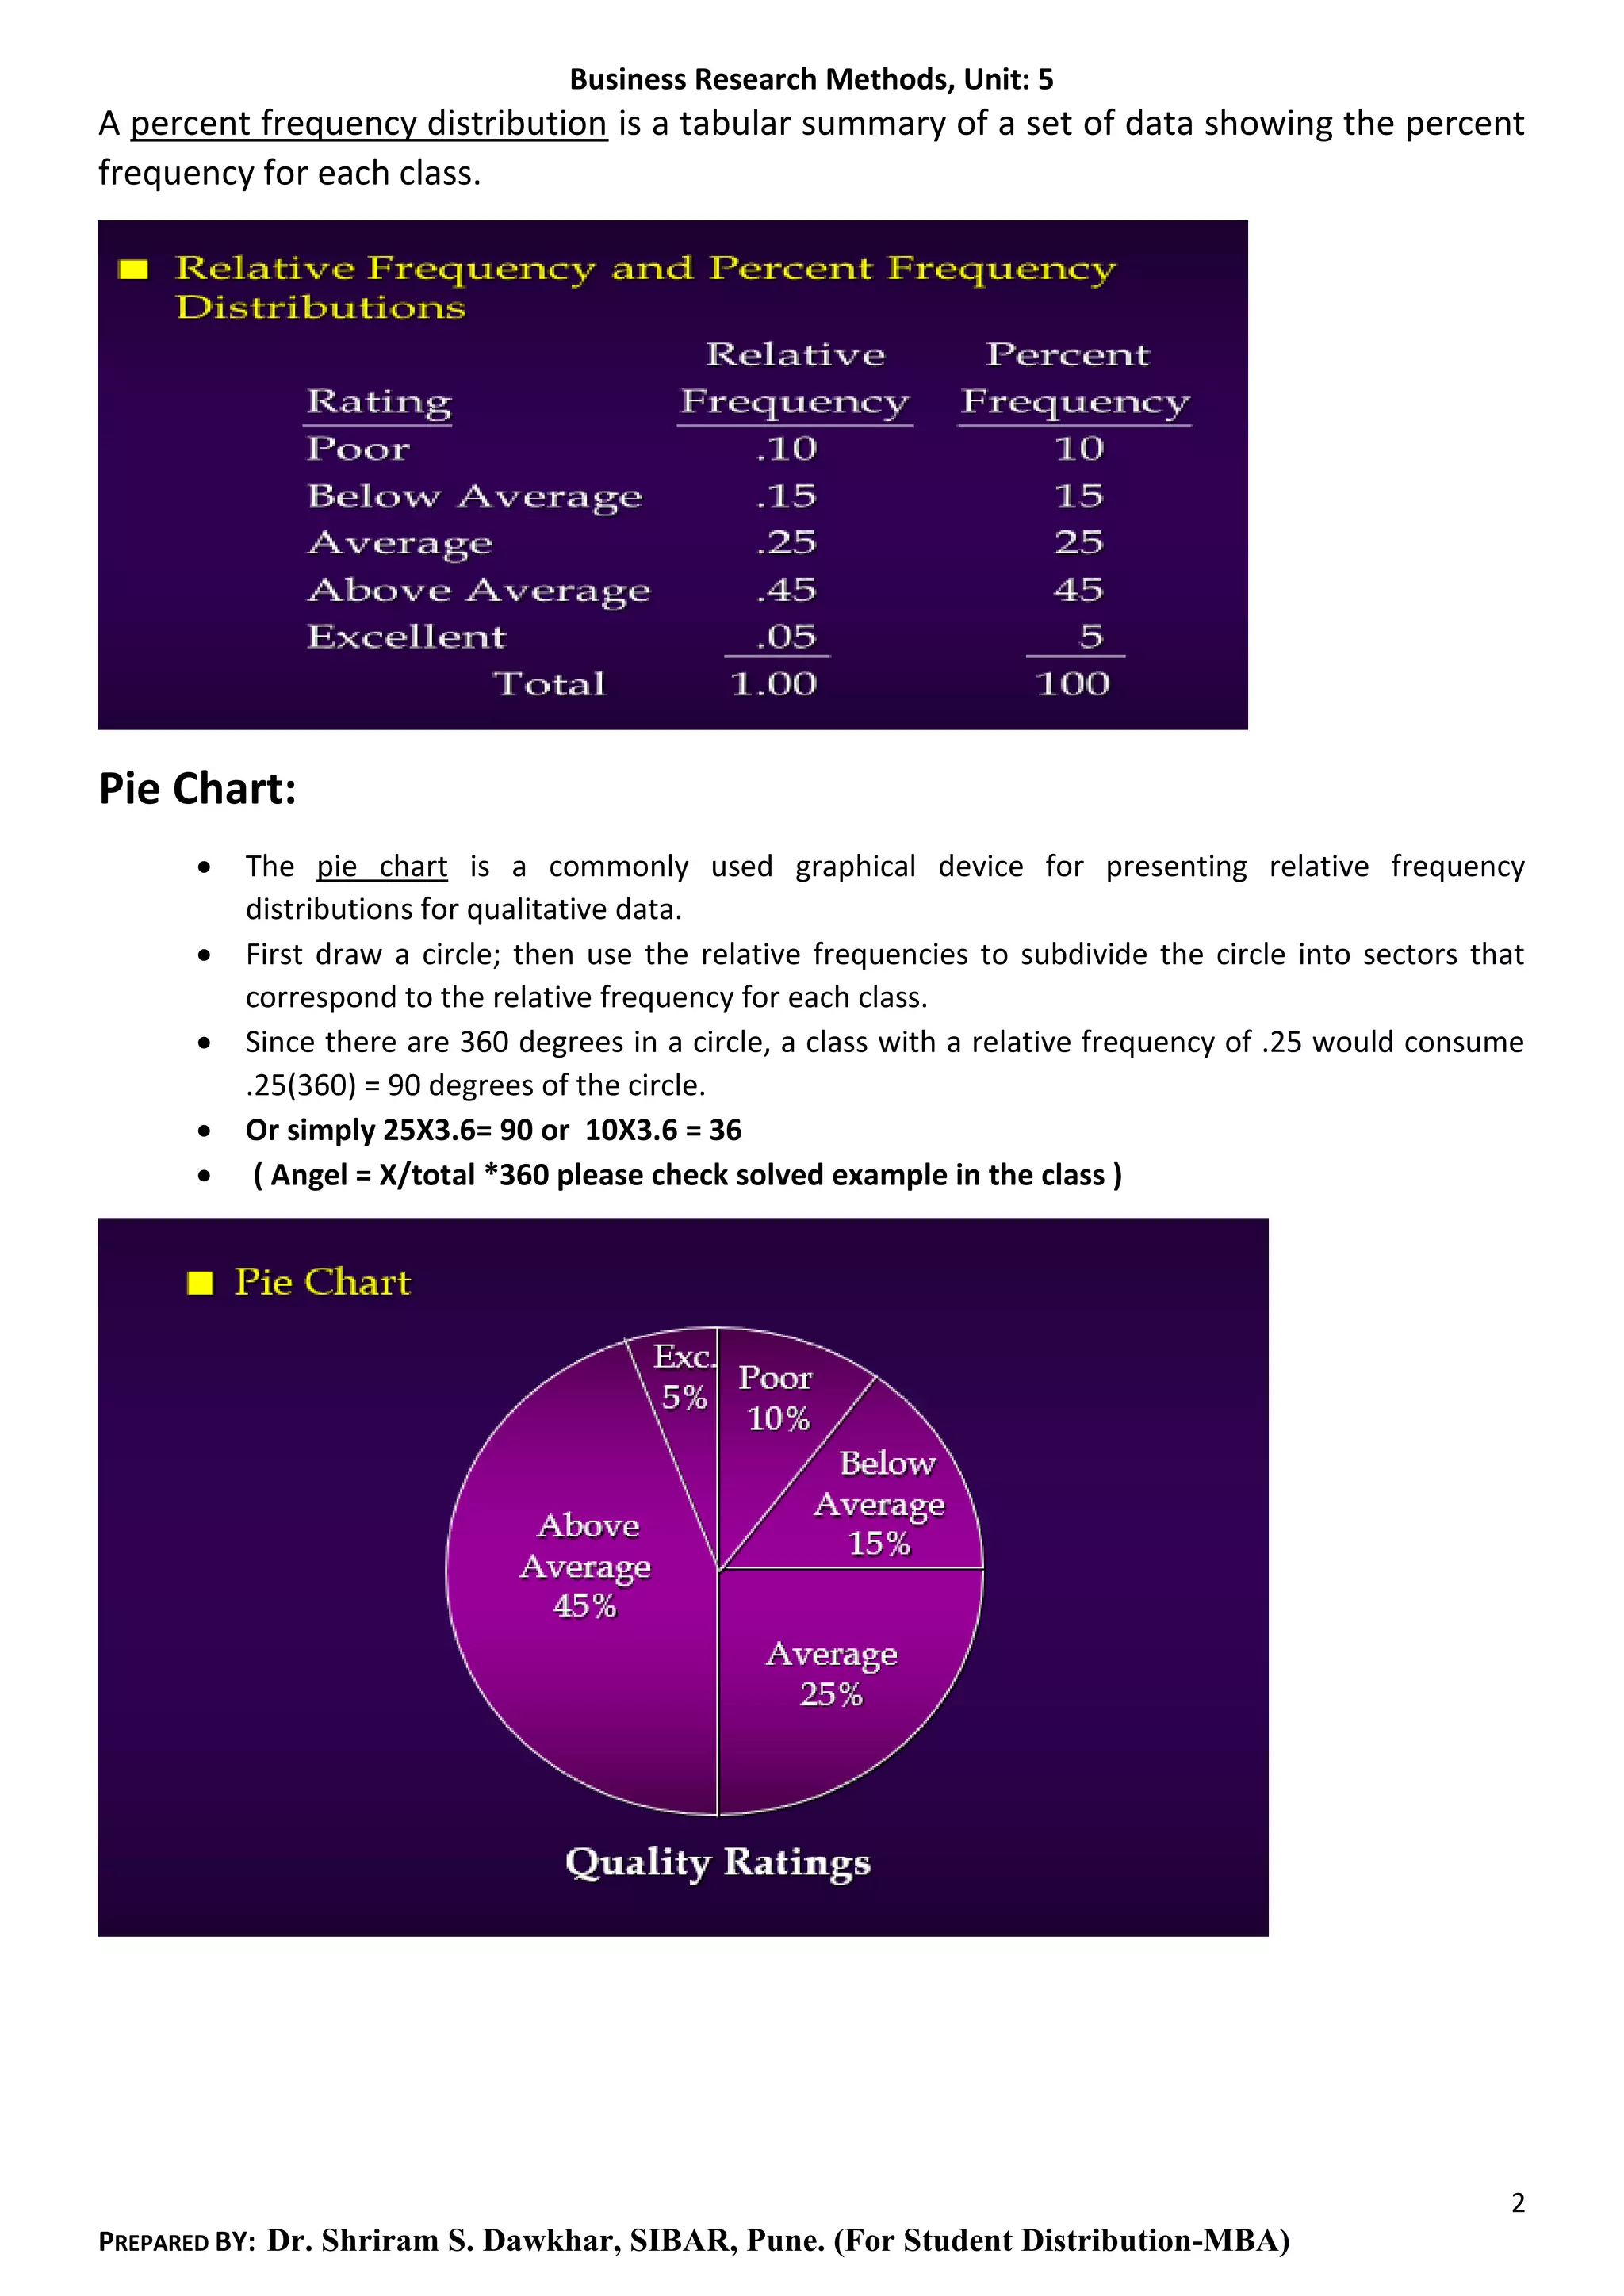
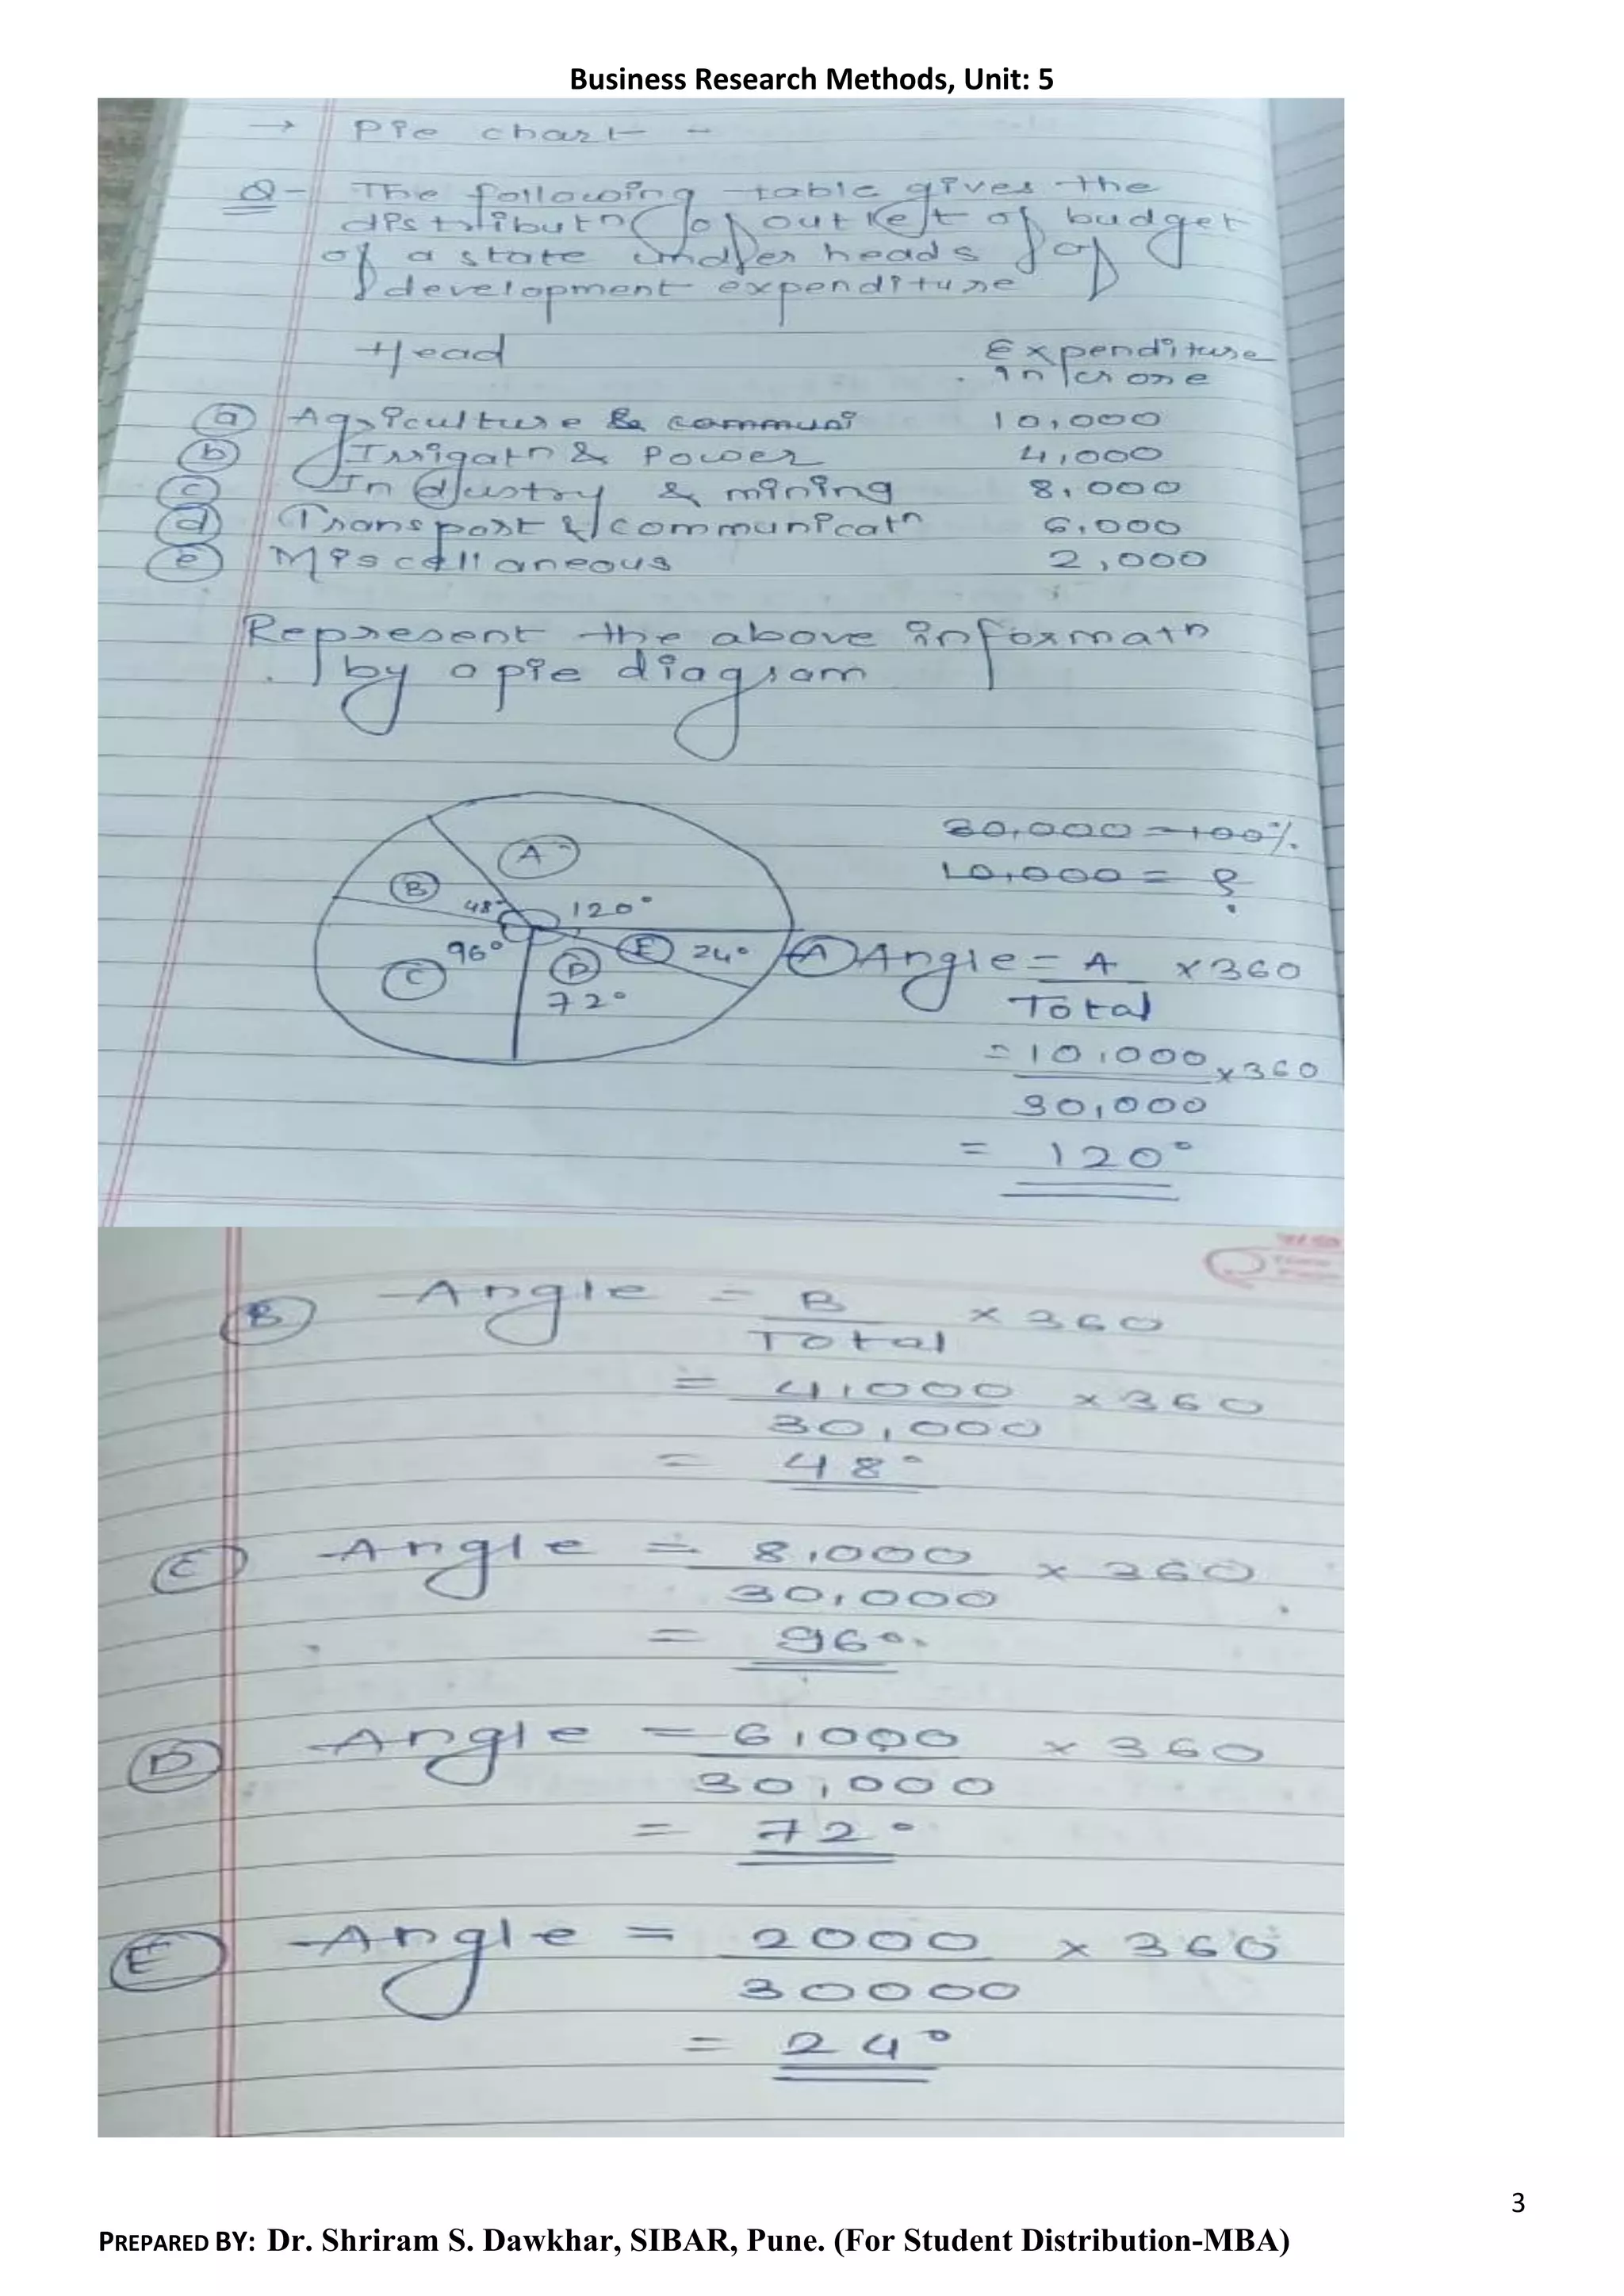
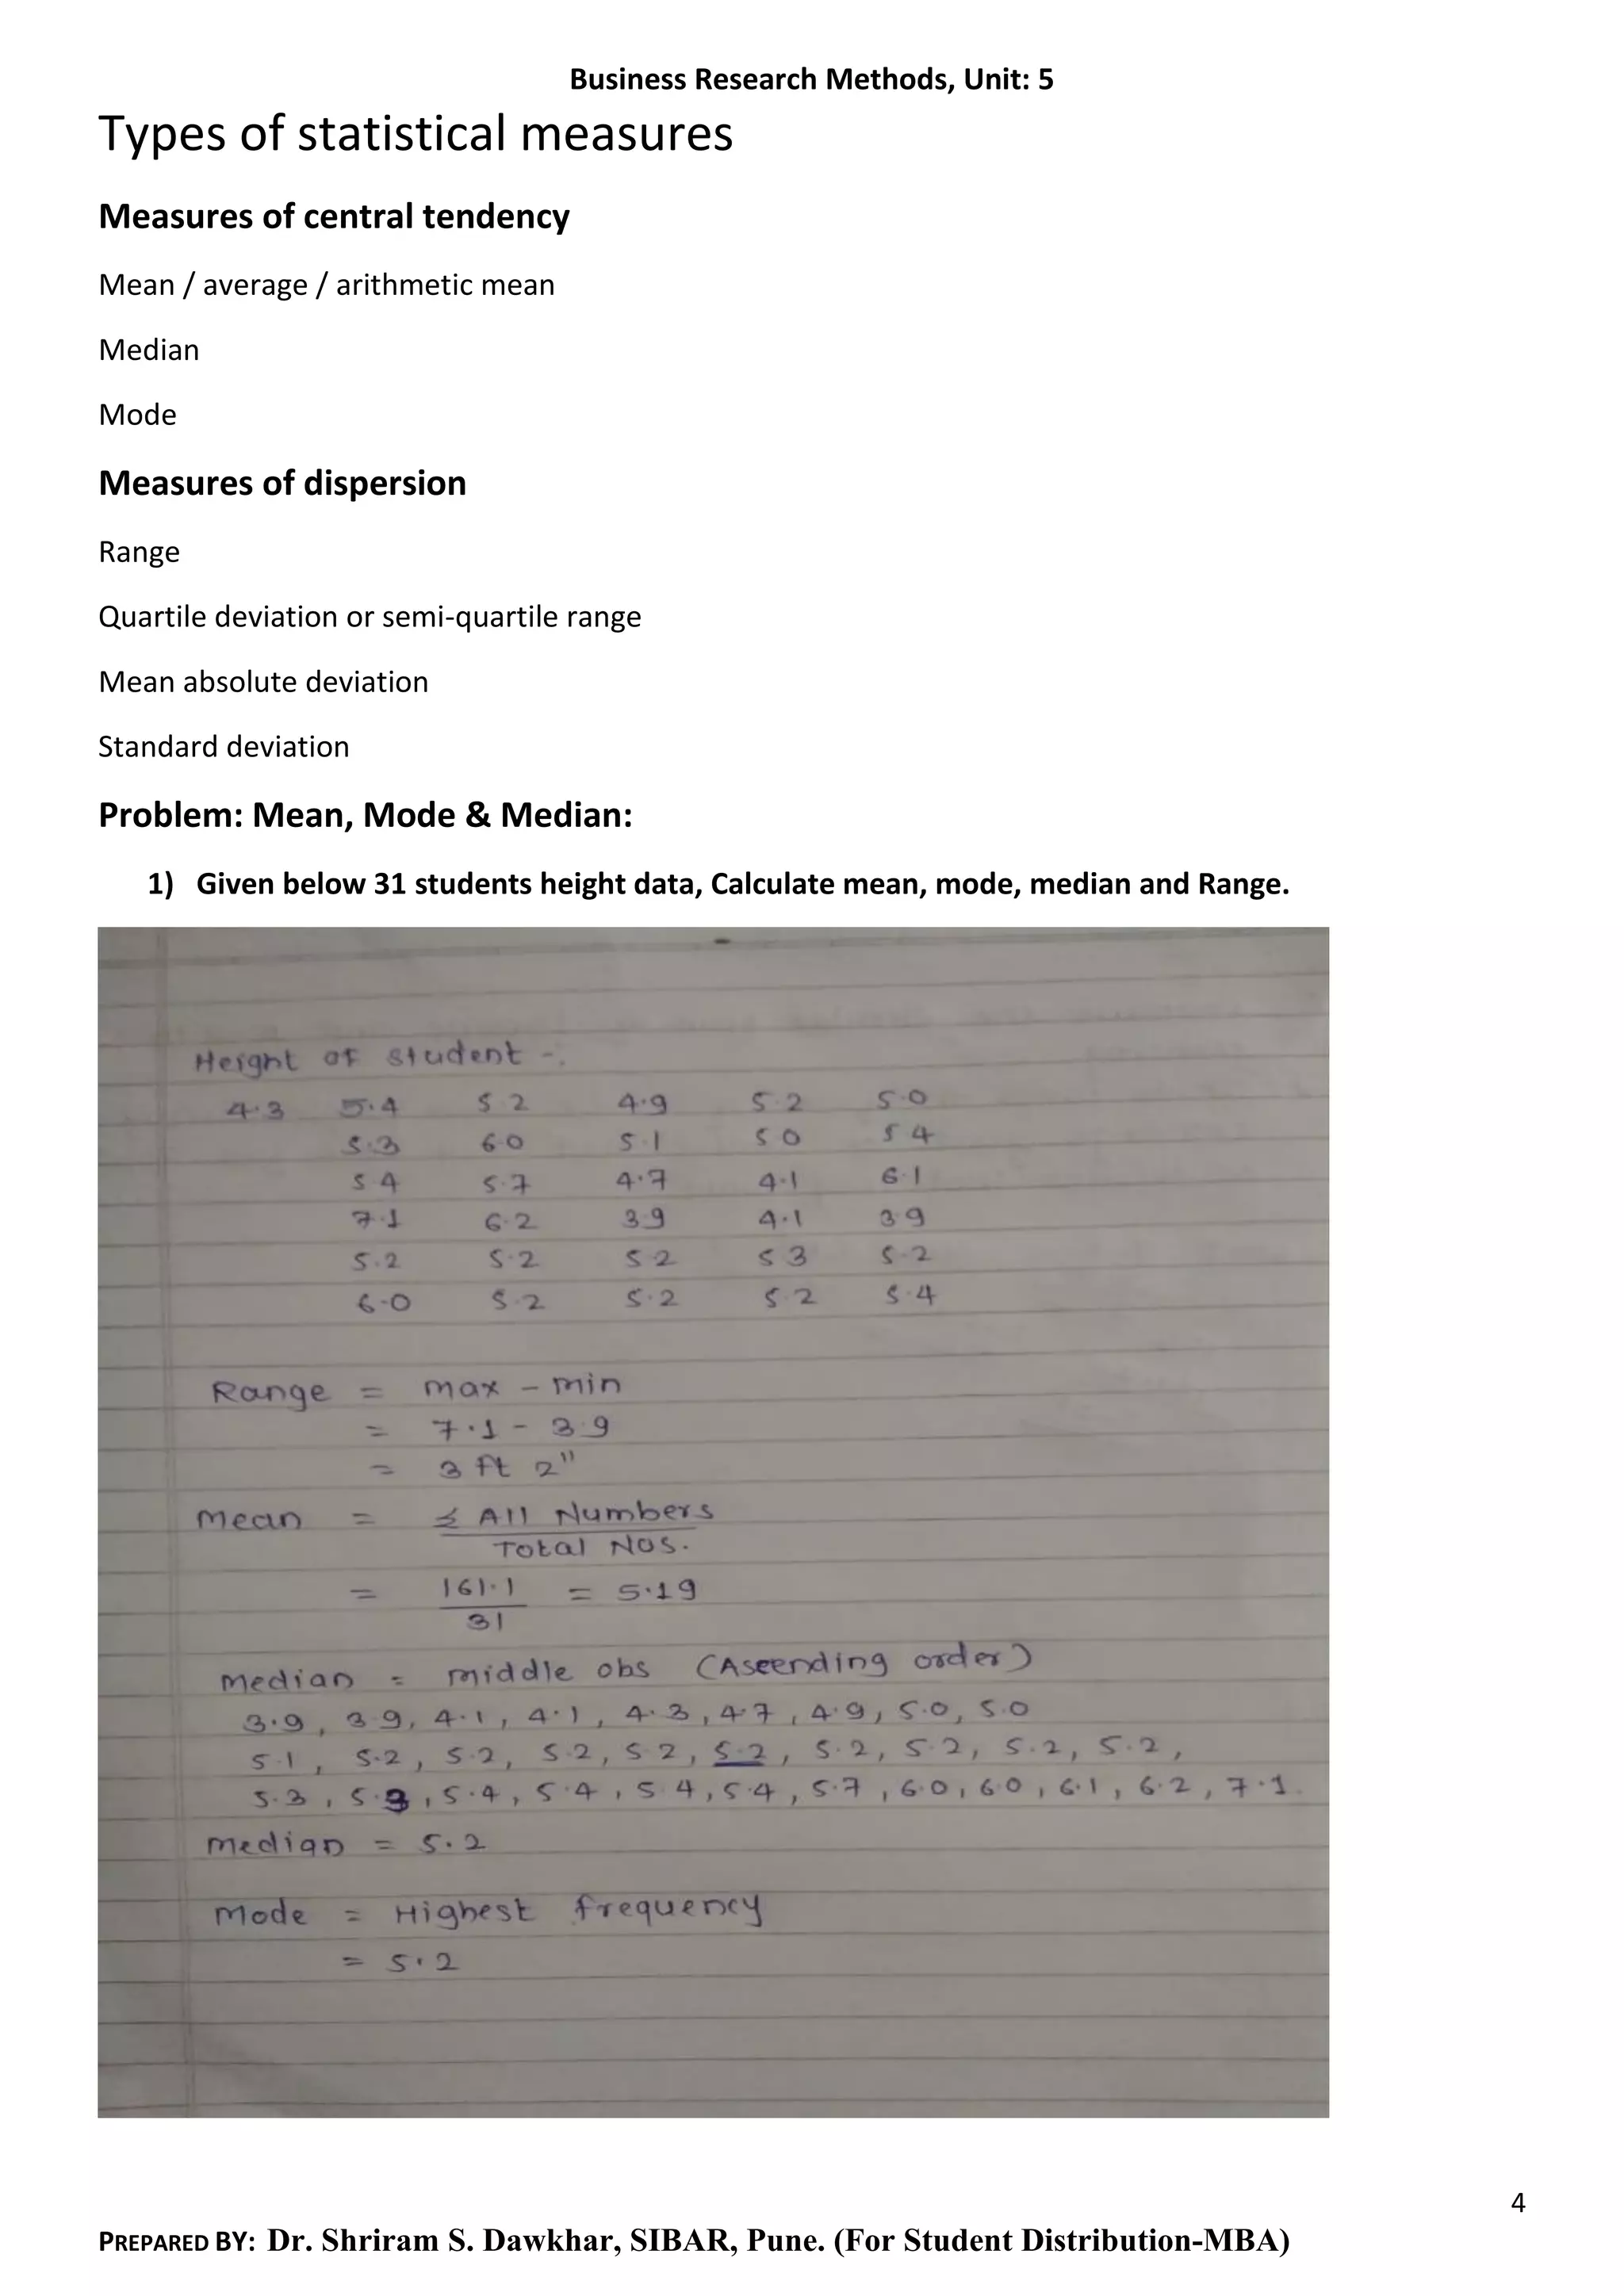
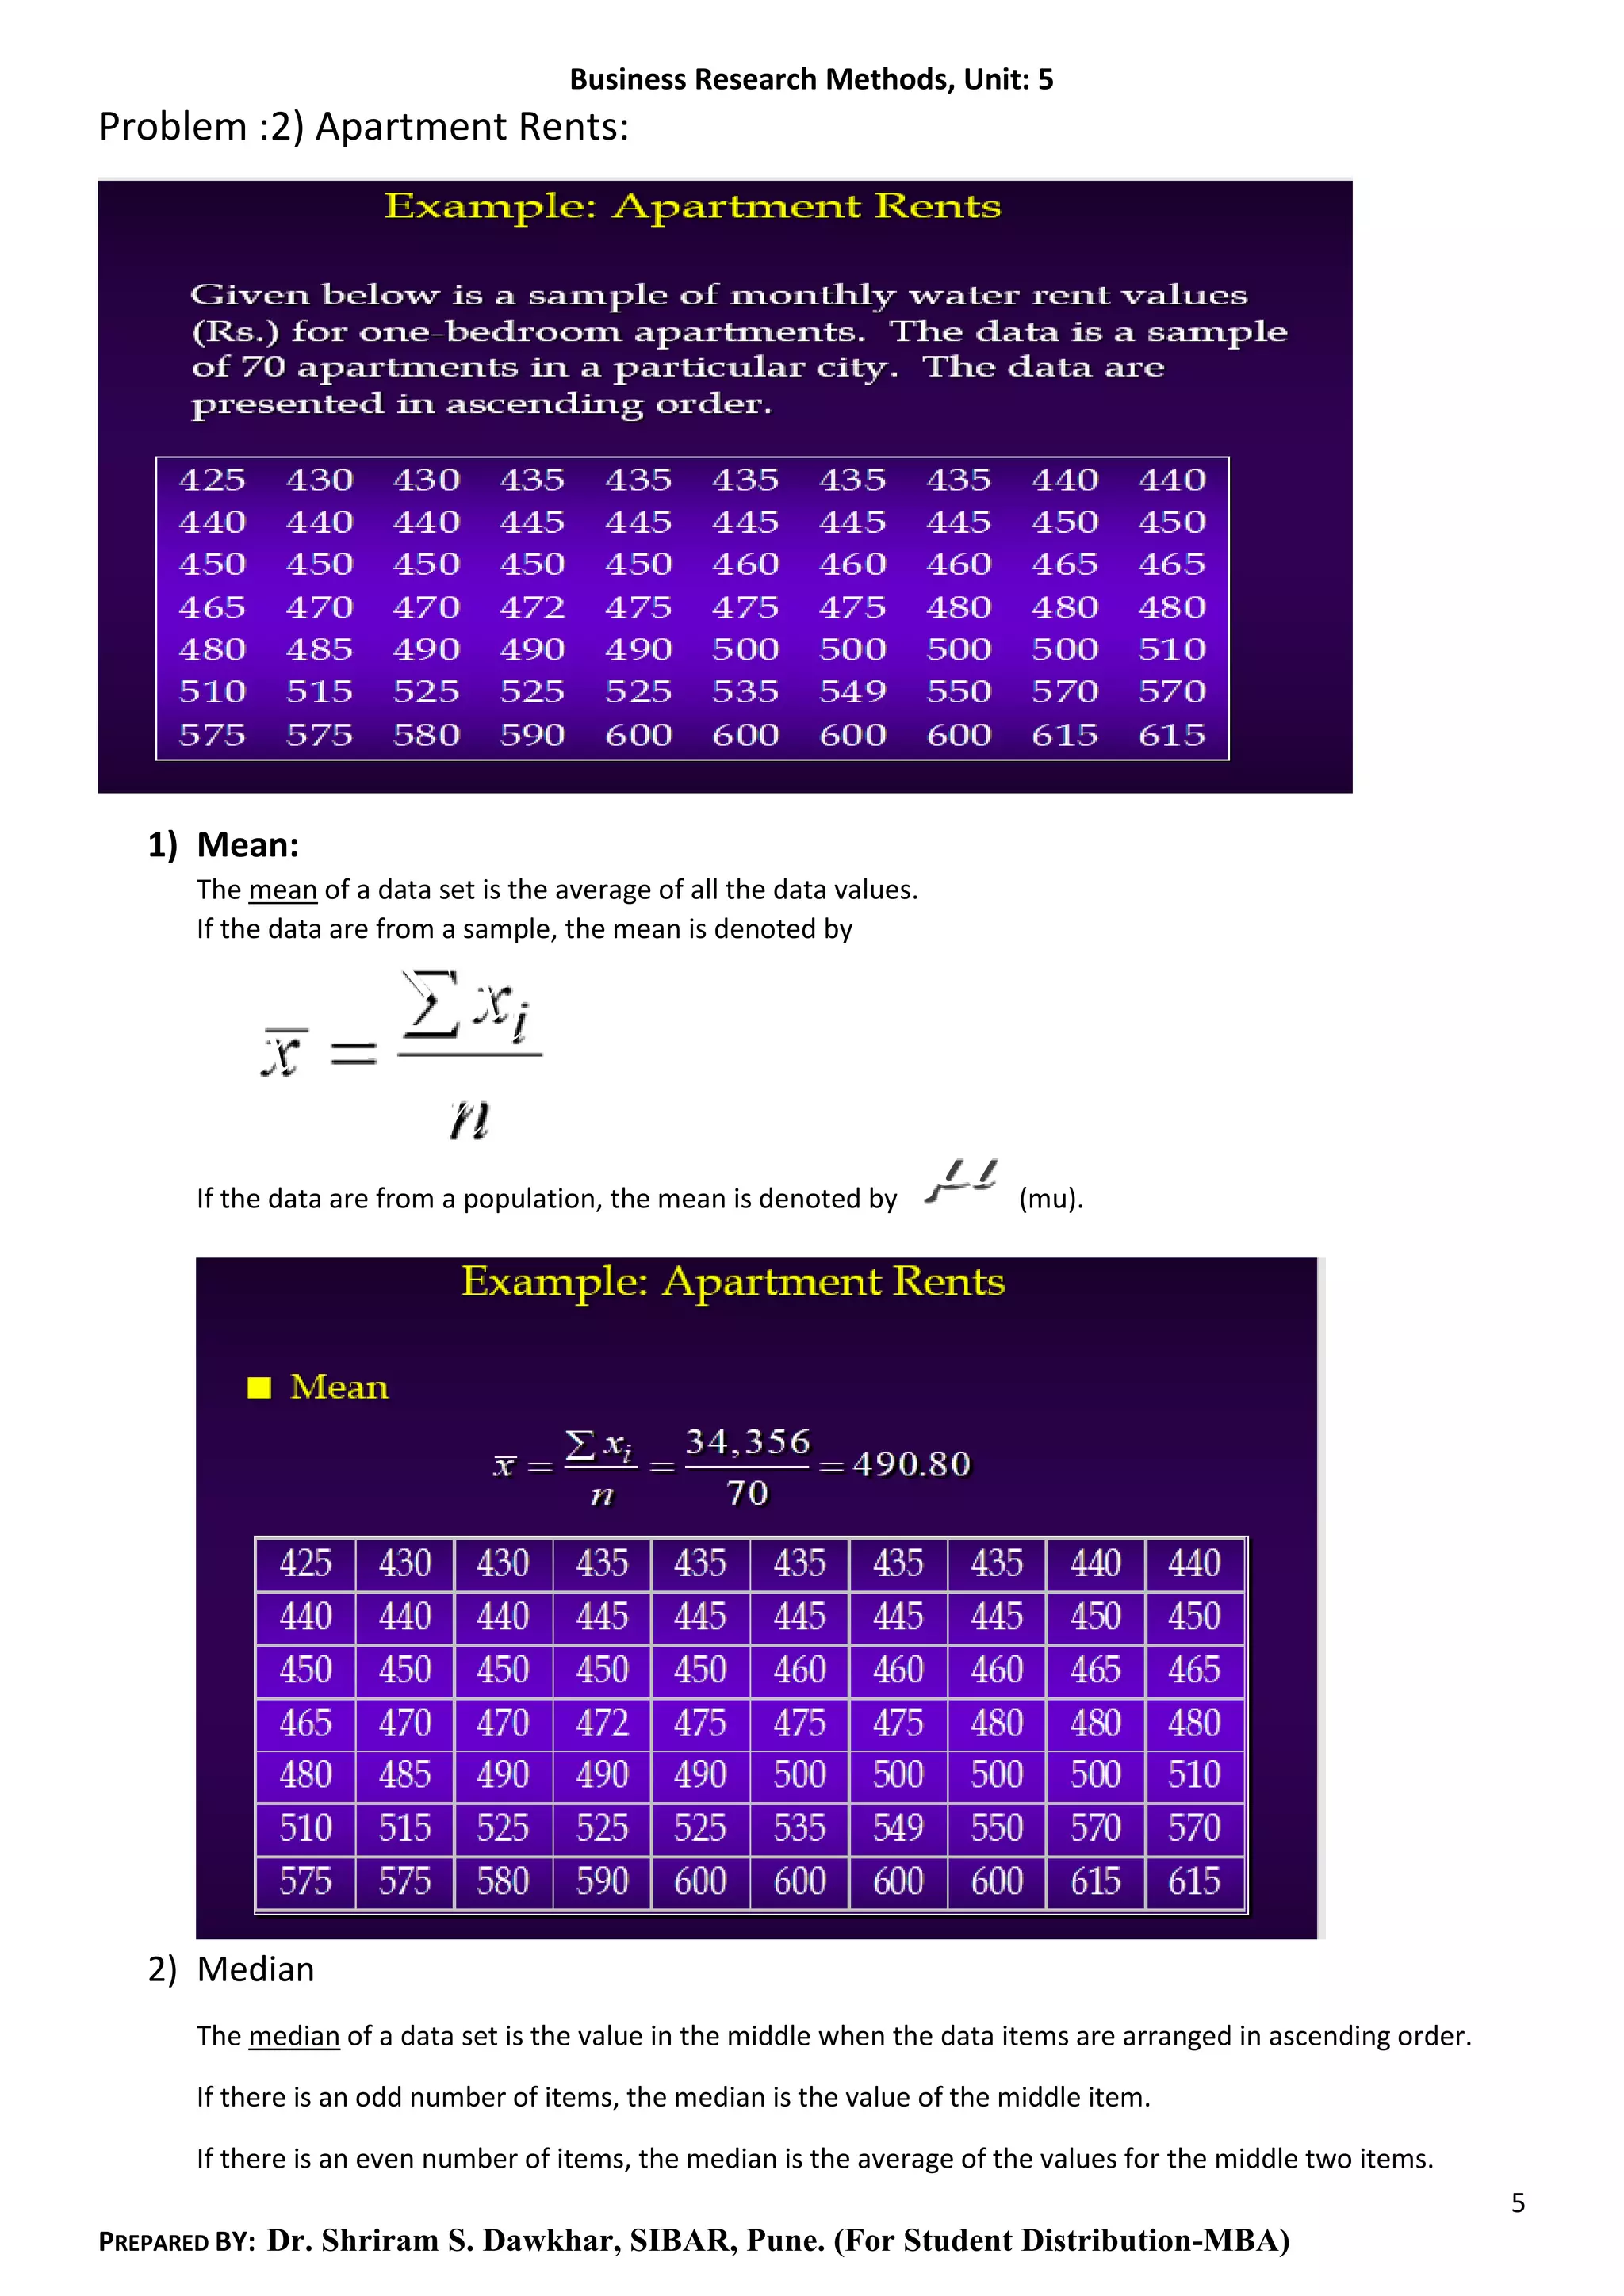
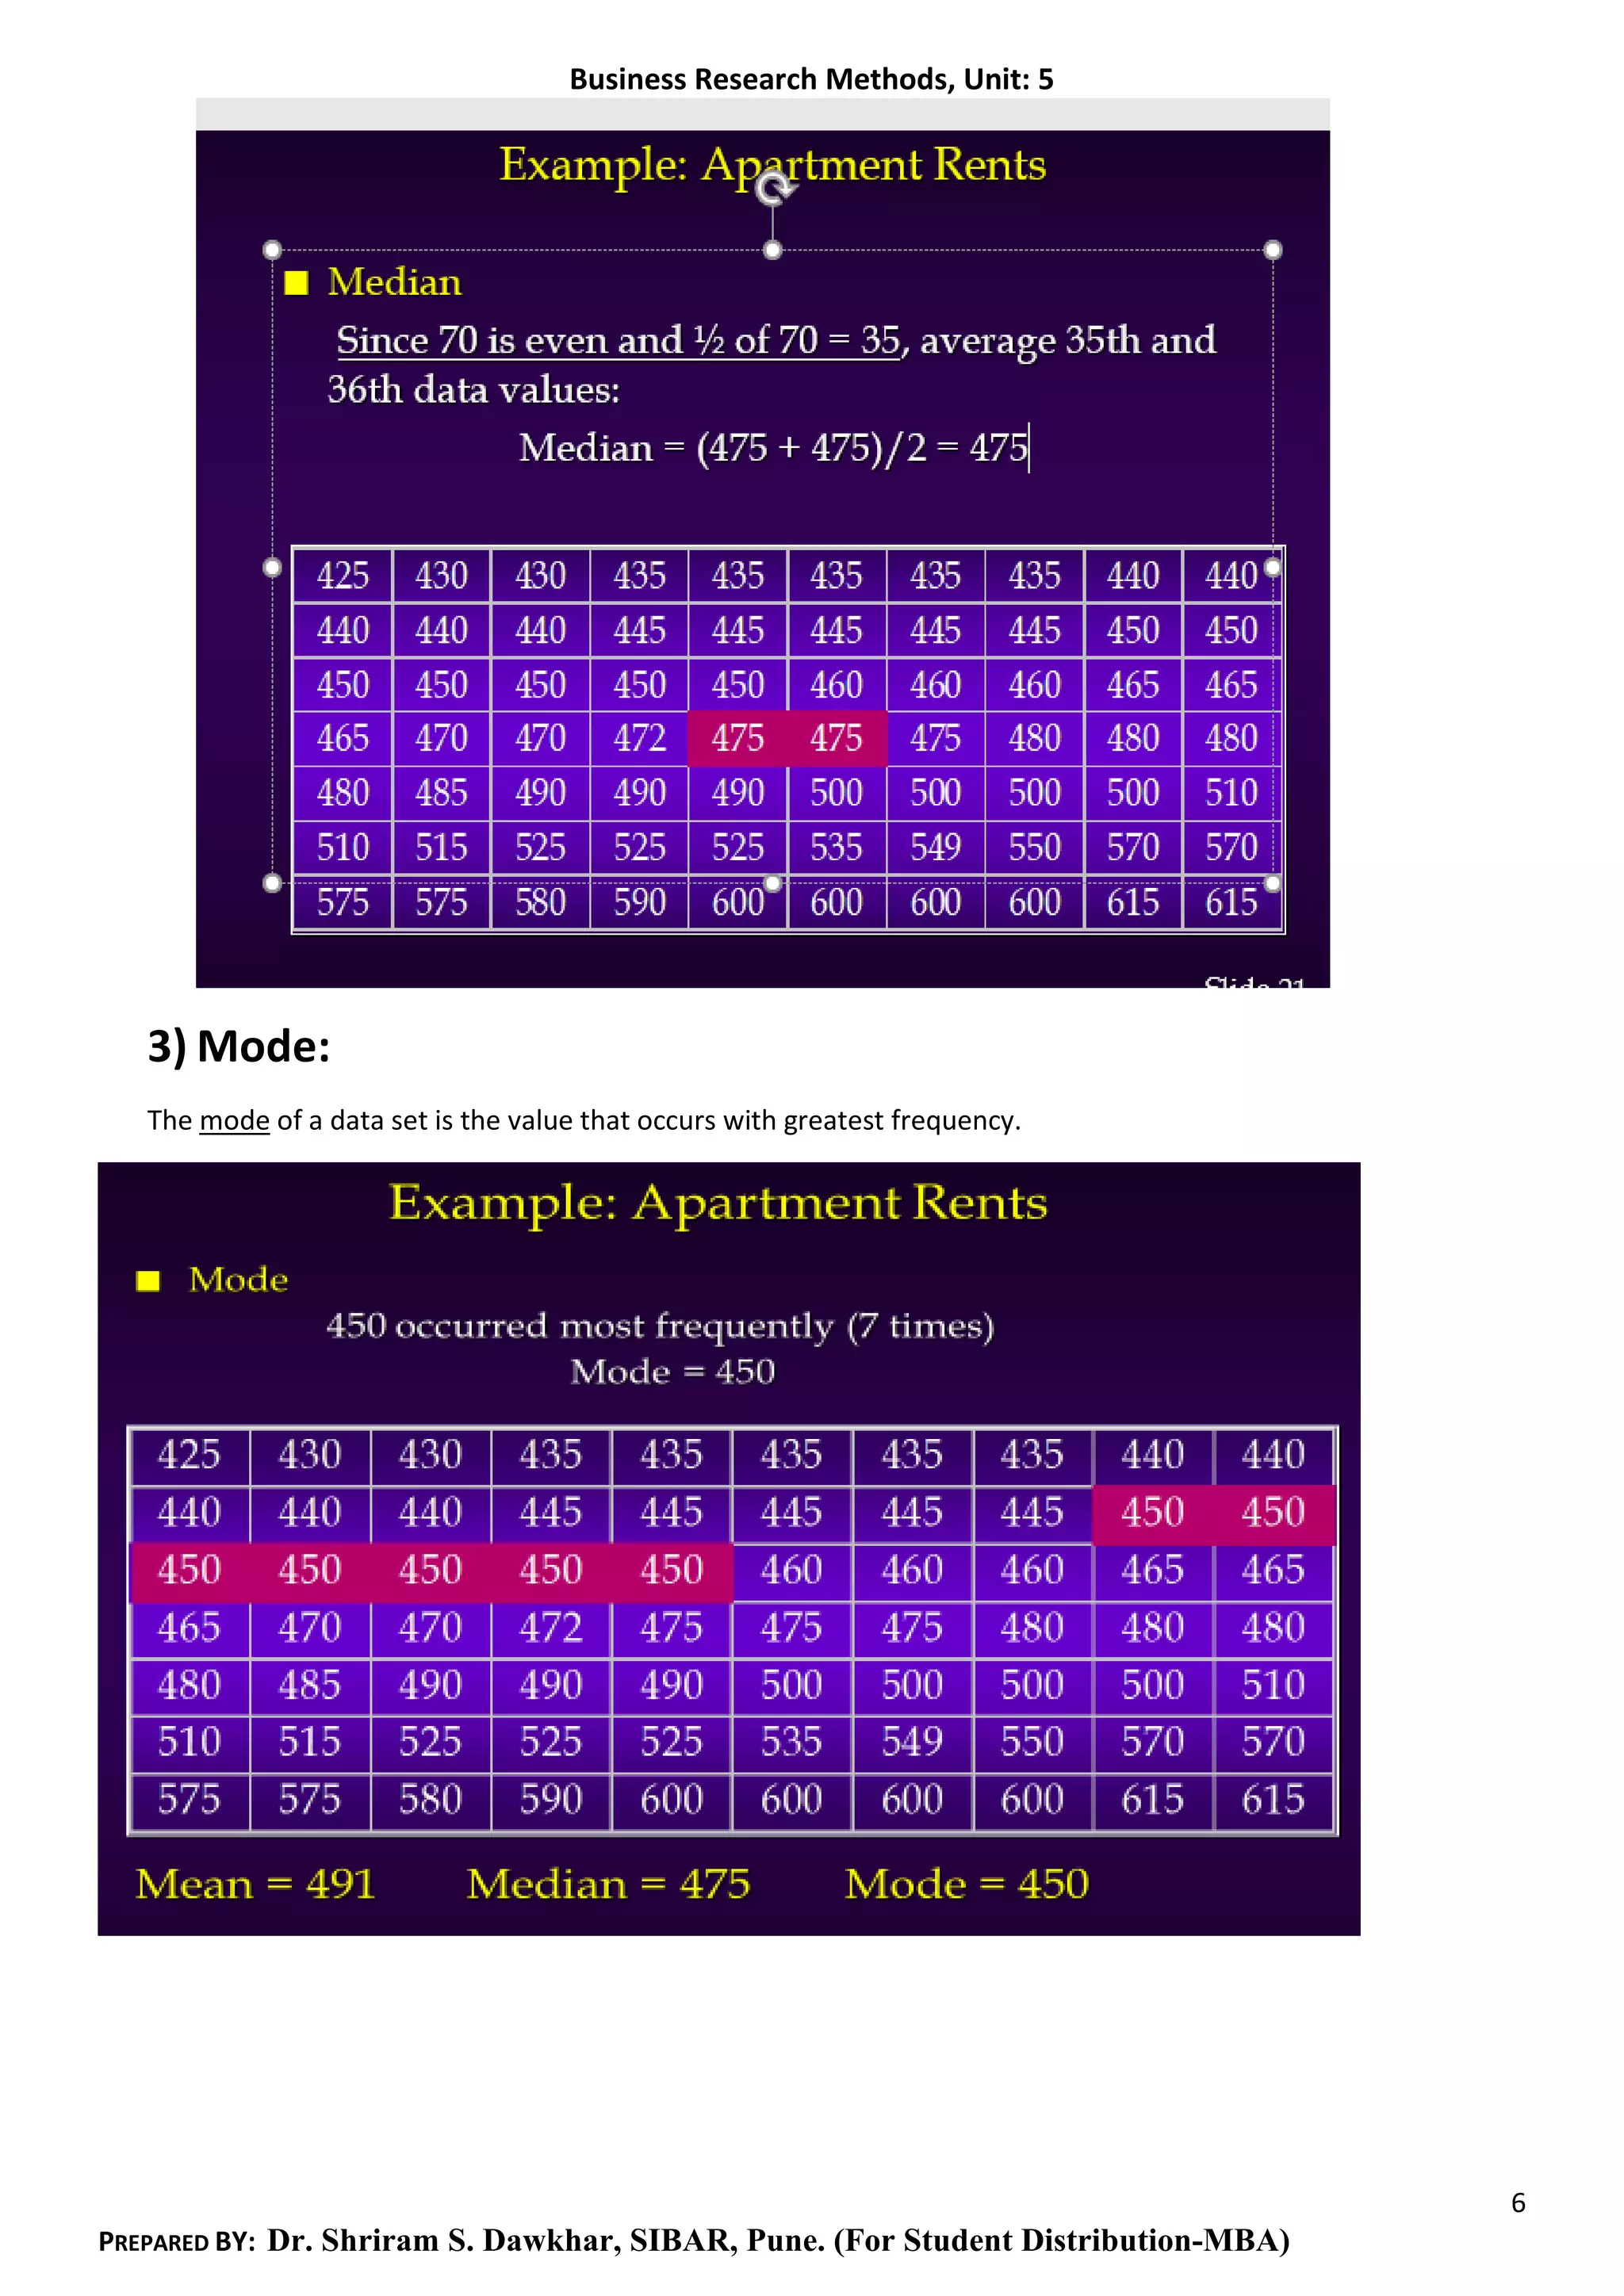
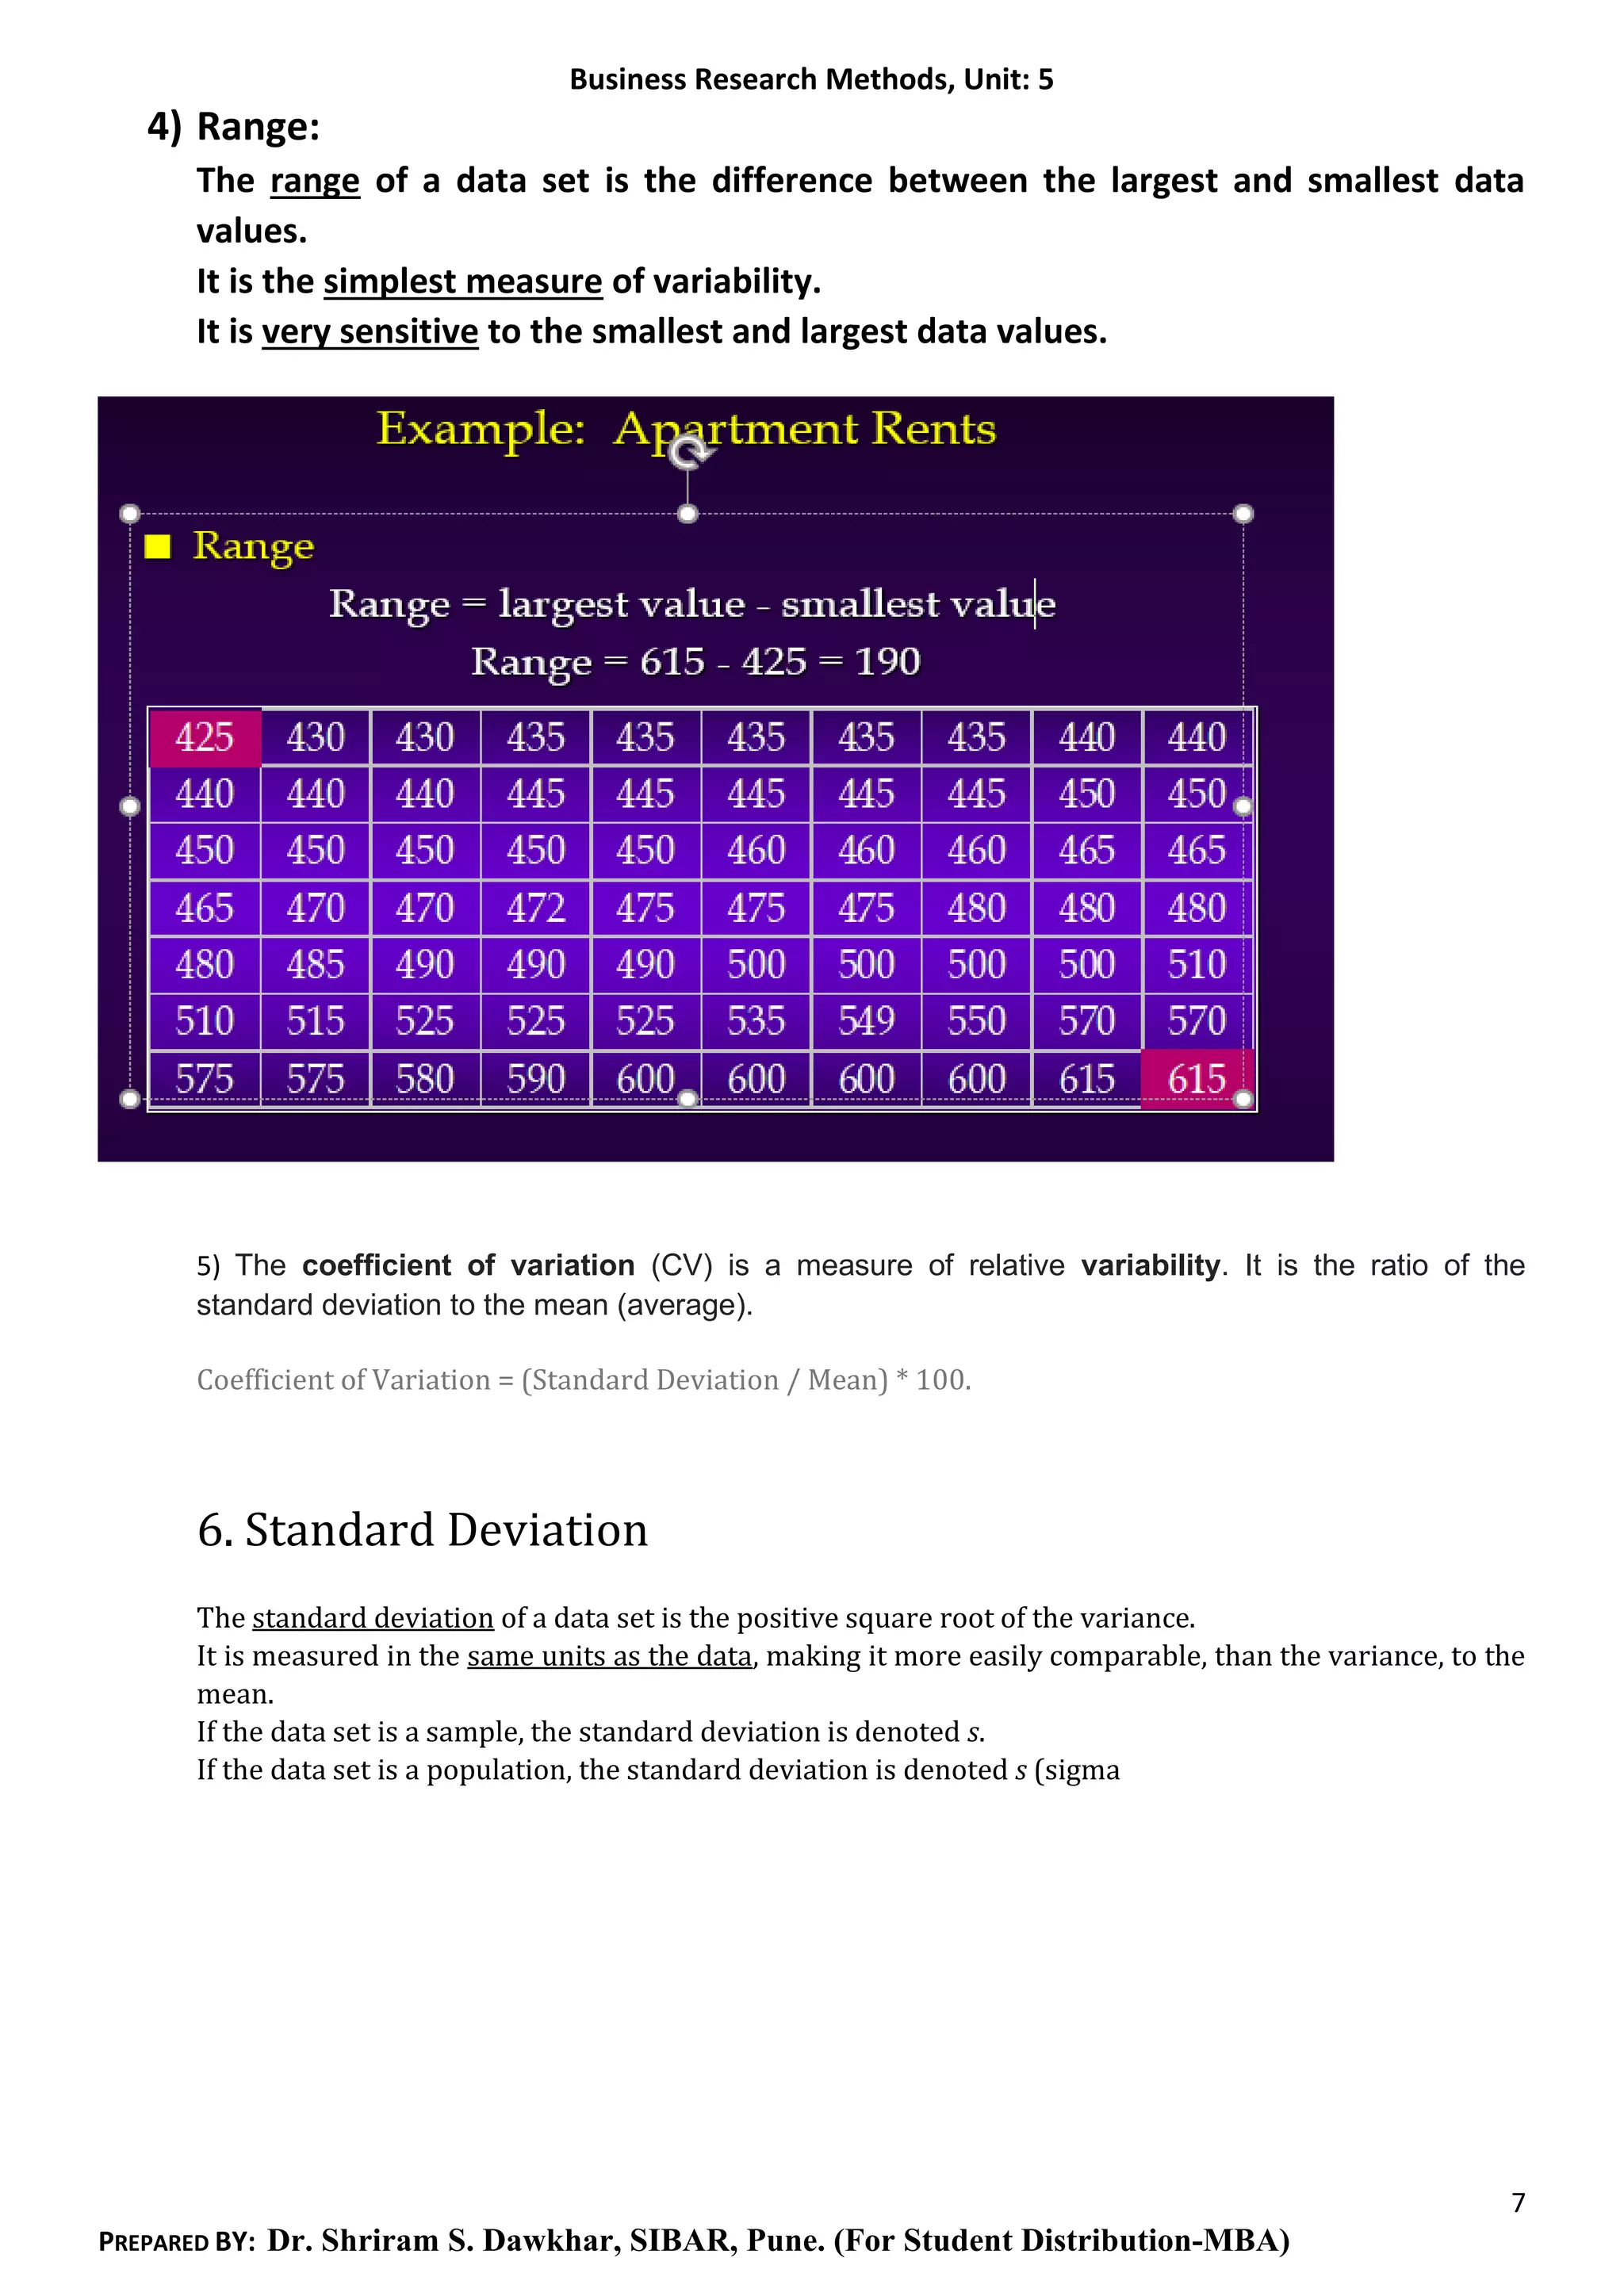

1. A frequency distribution is a tabular summary of data showing the frequency or number of items in each of several nonoverlapping classes. The objective is to provide insights about the data that cannot be quickly obtained by looking only at the original data. 2. The document discusses measures of central tendency such as mean, median, and mode. It also discusses measures of dispersion such as range, standard deviation, and coefficient of variation. 3. Hypothesis testing is examined, including the criteria for decision making when the calculated value is compared to the critical value or when using a p-value approach. Type I and Type II errors are also discussed.