Downloaded 107 times


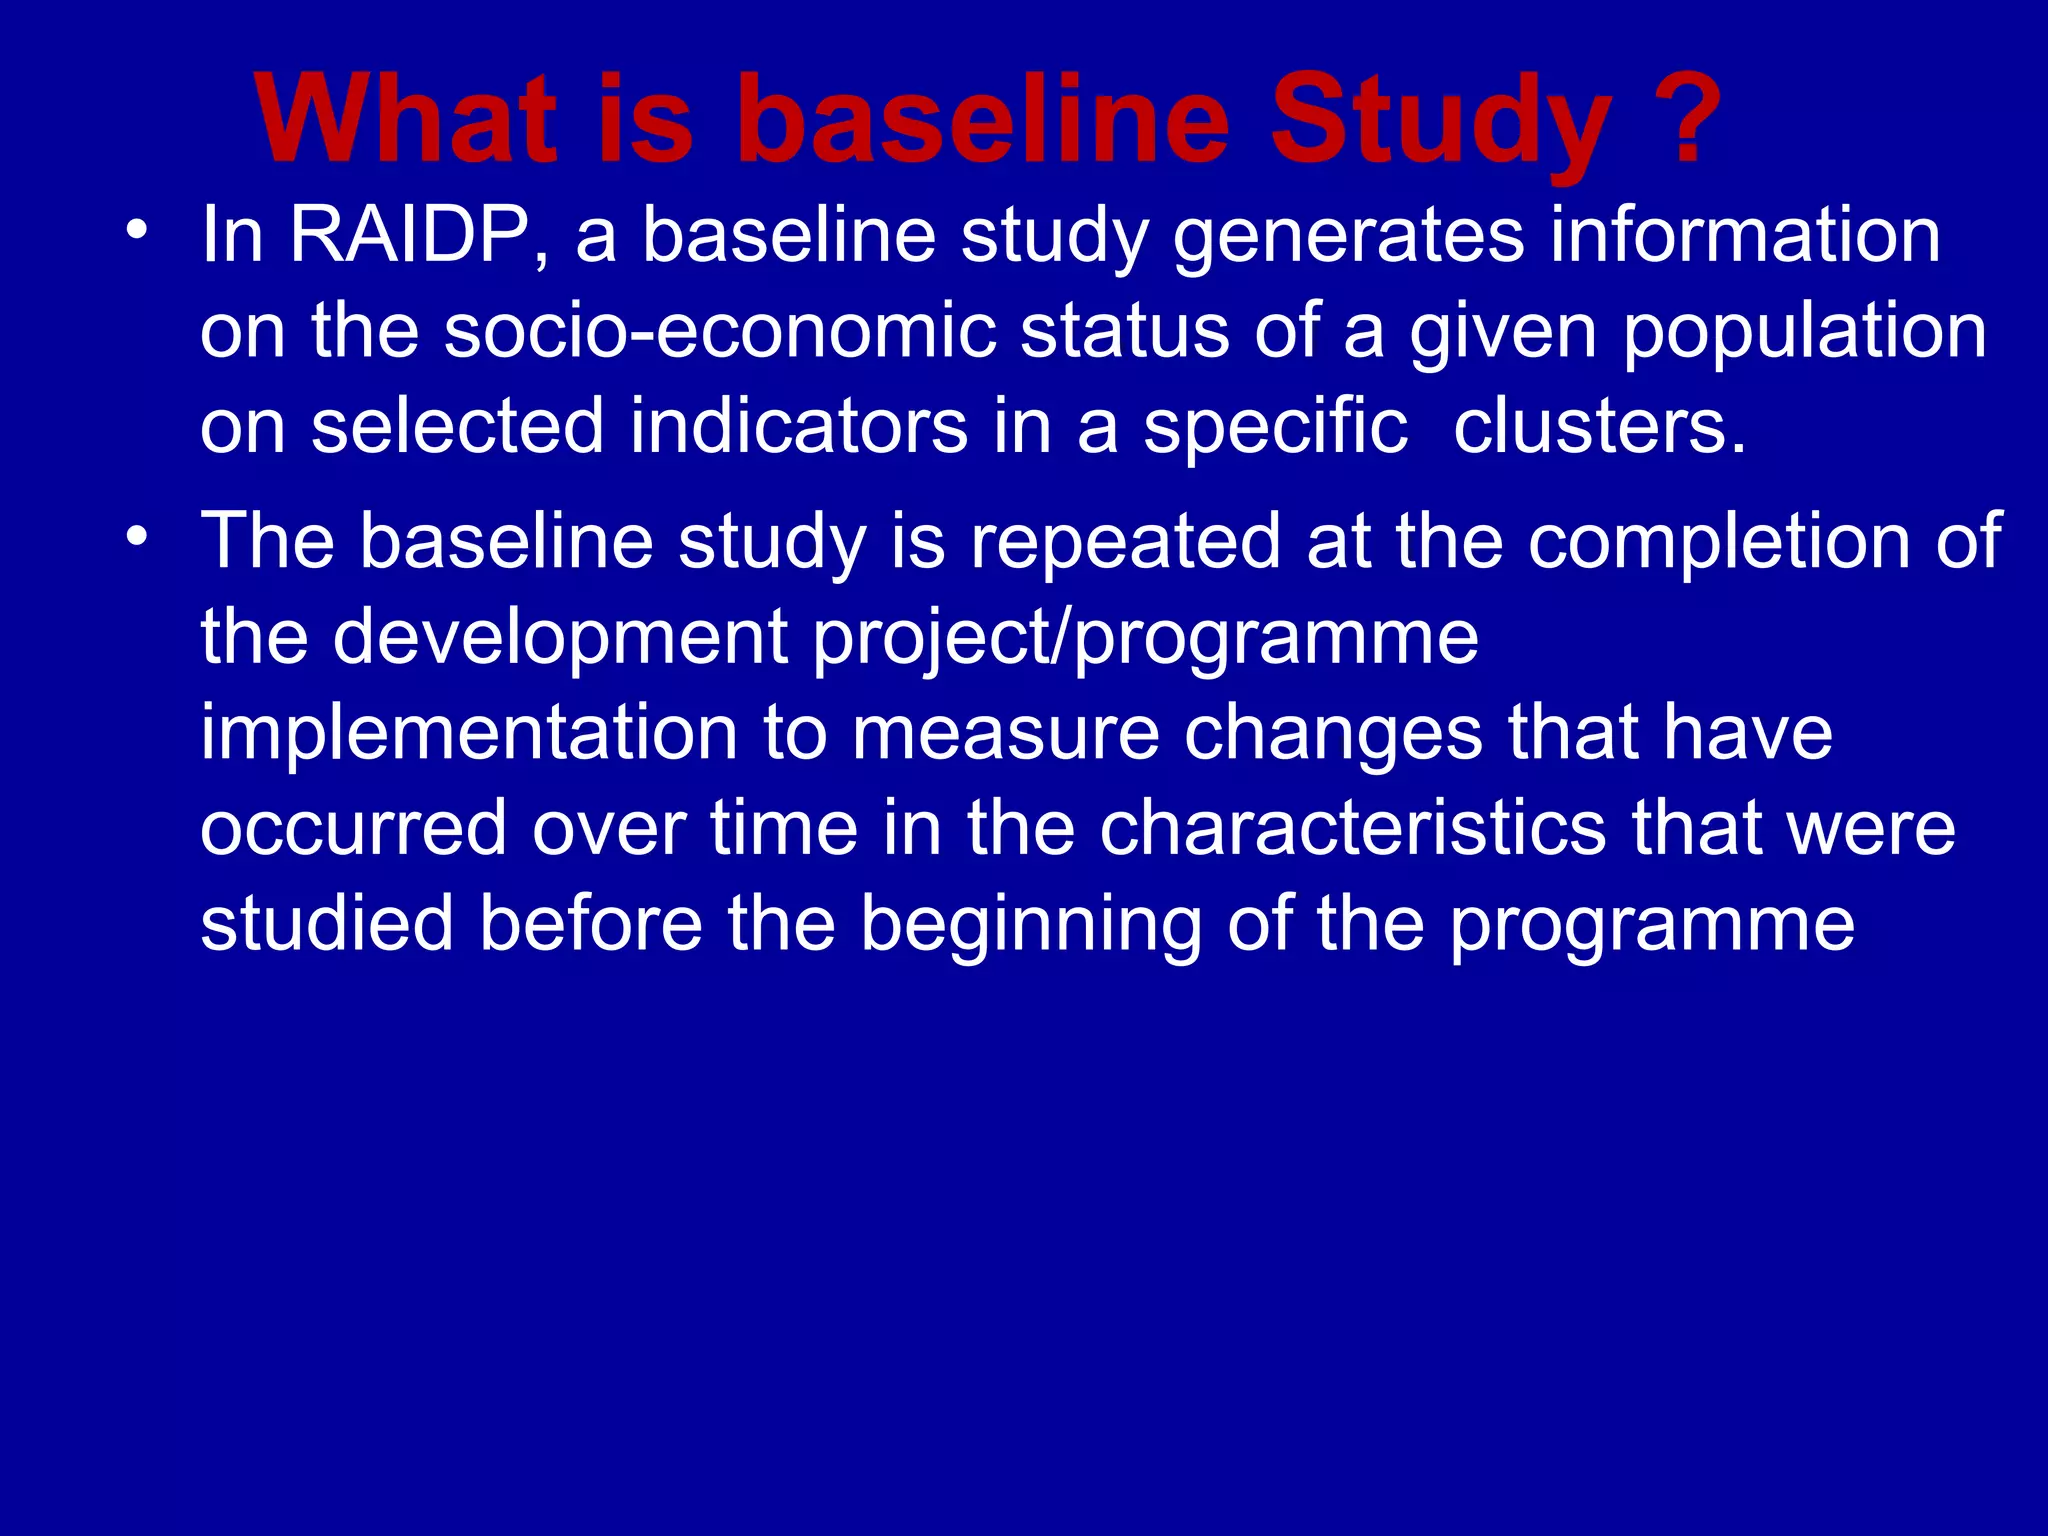

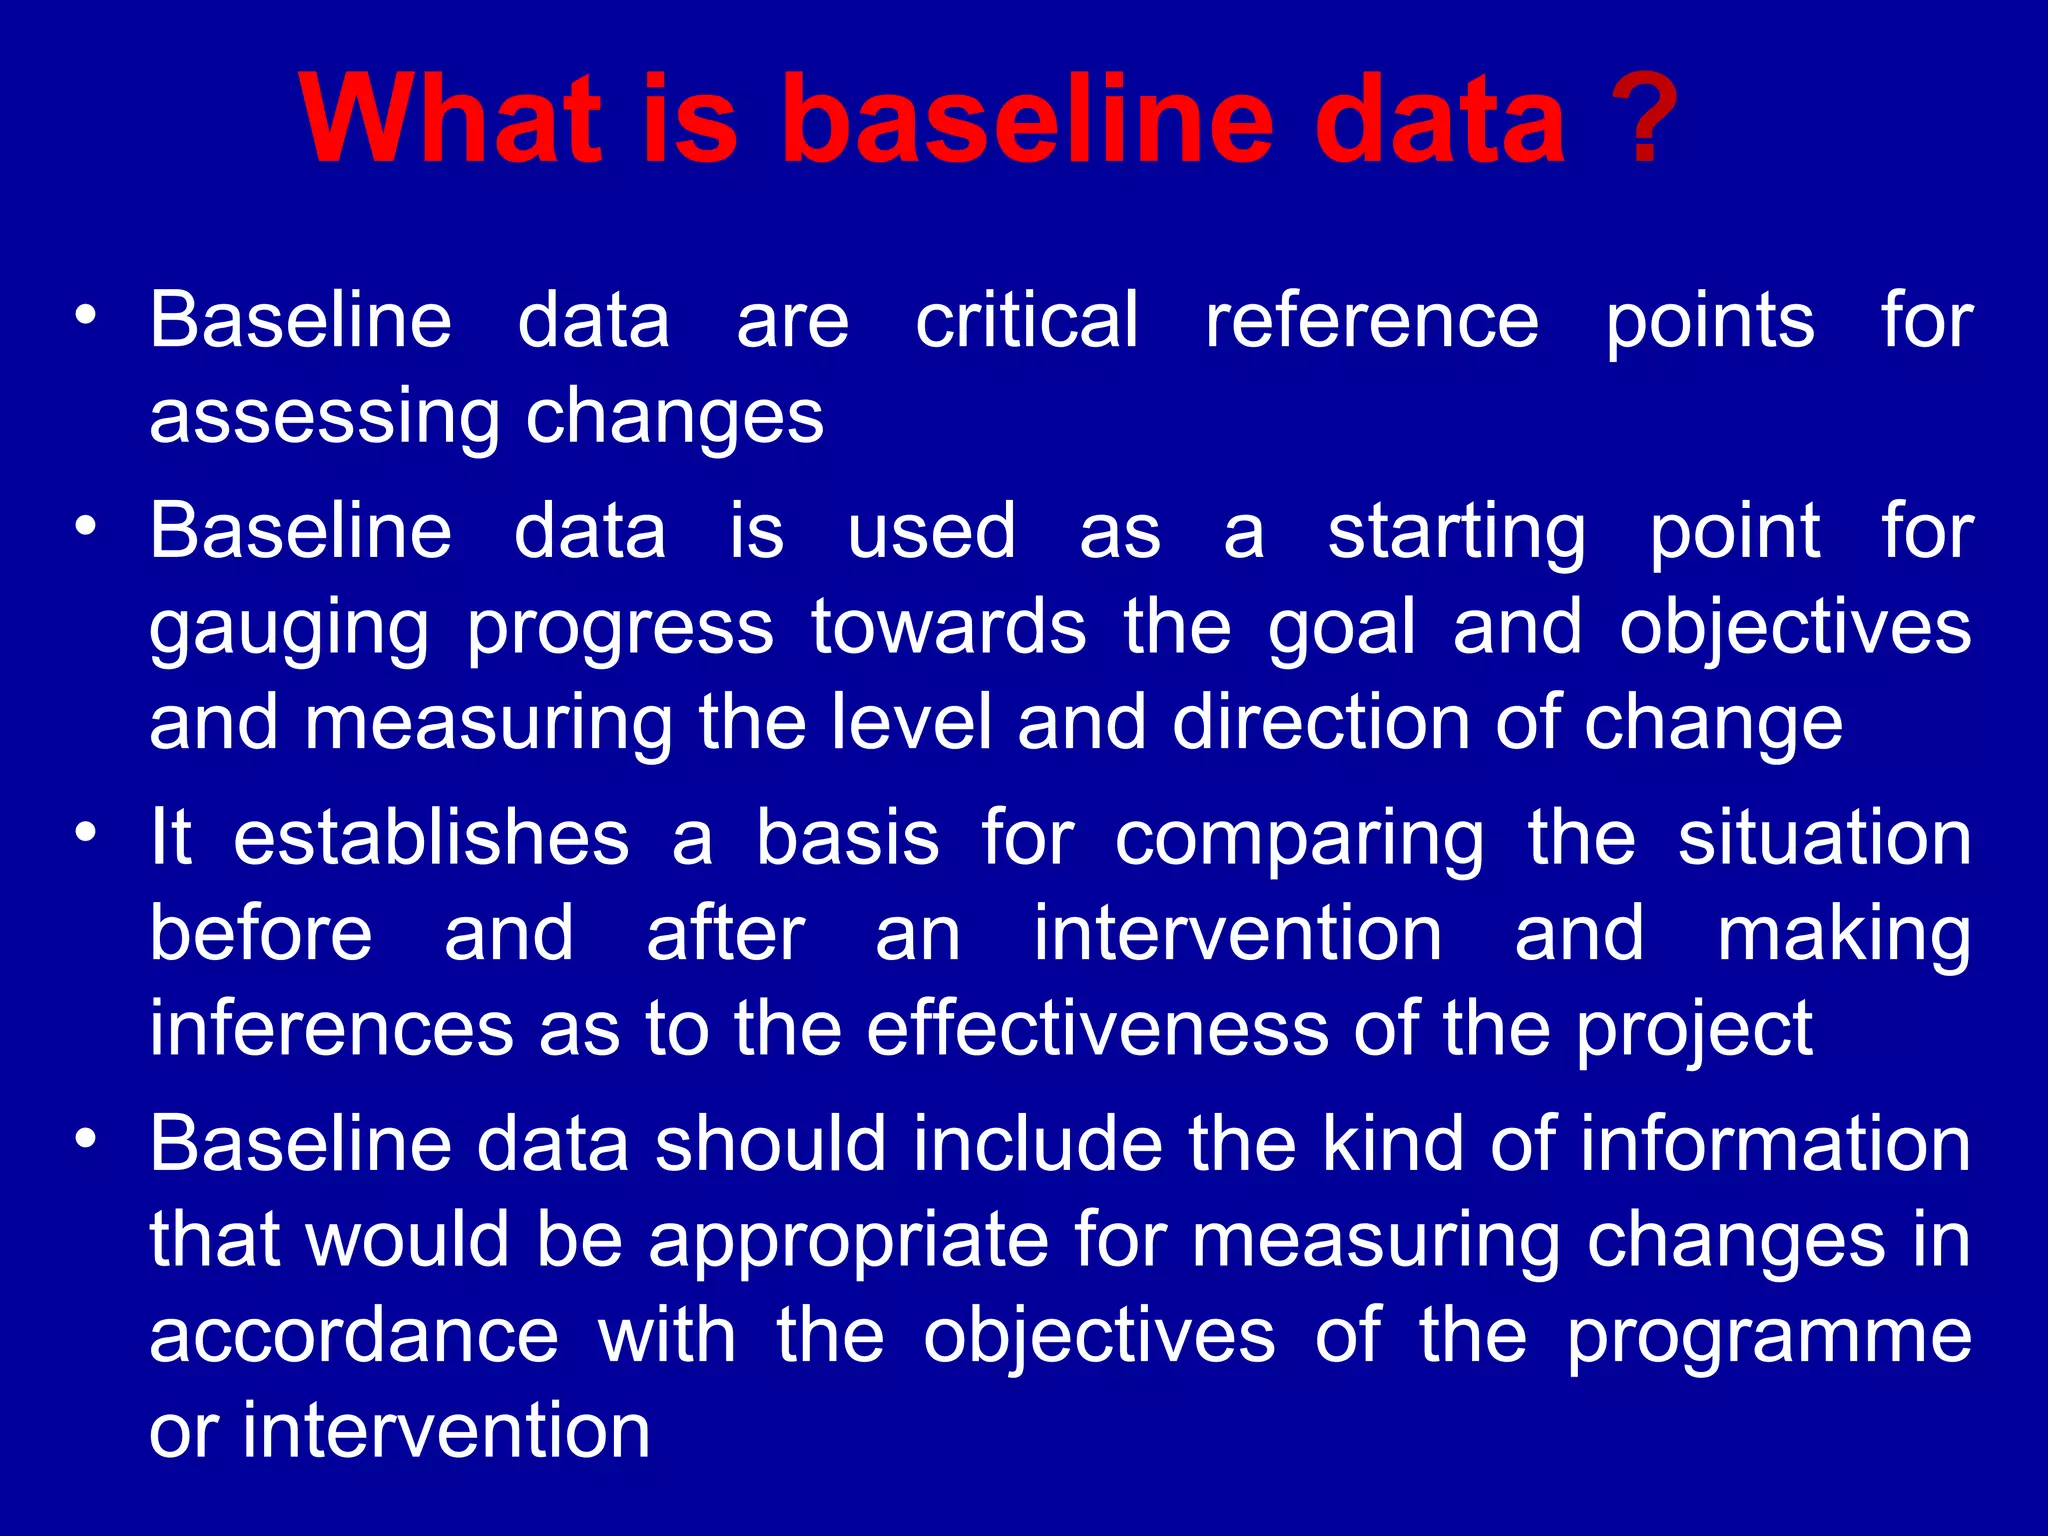
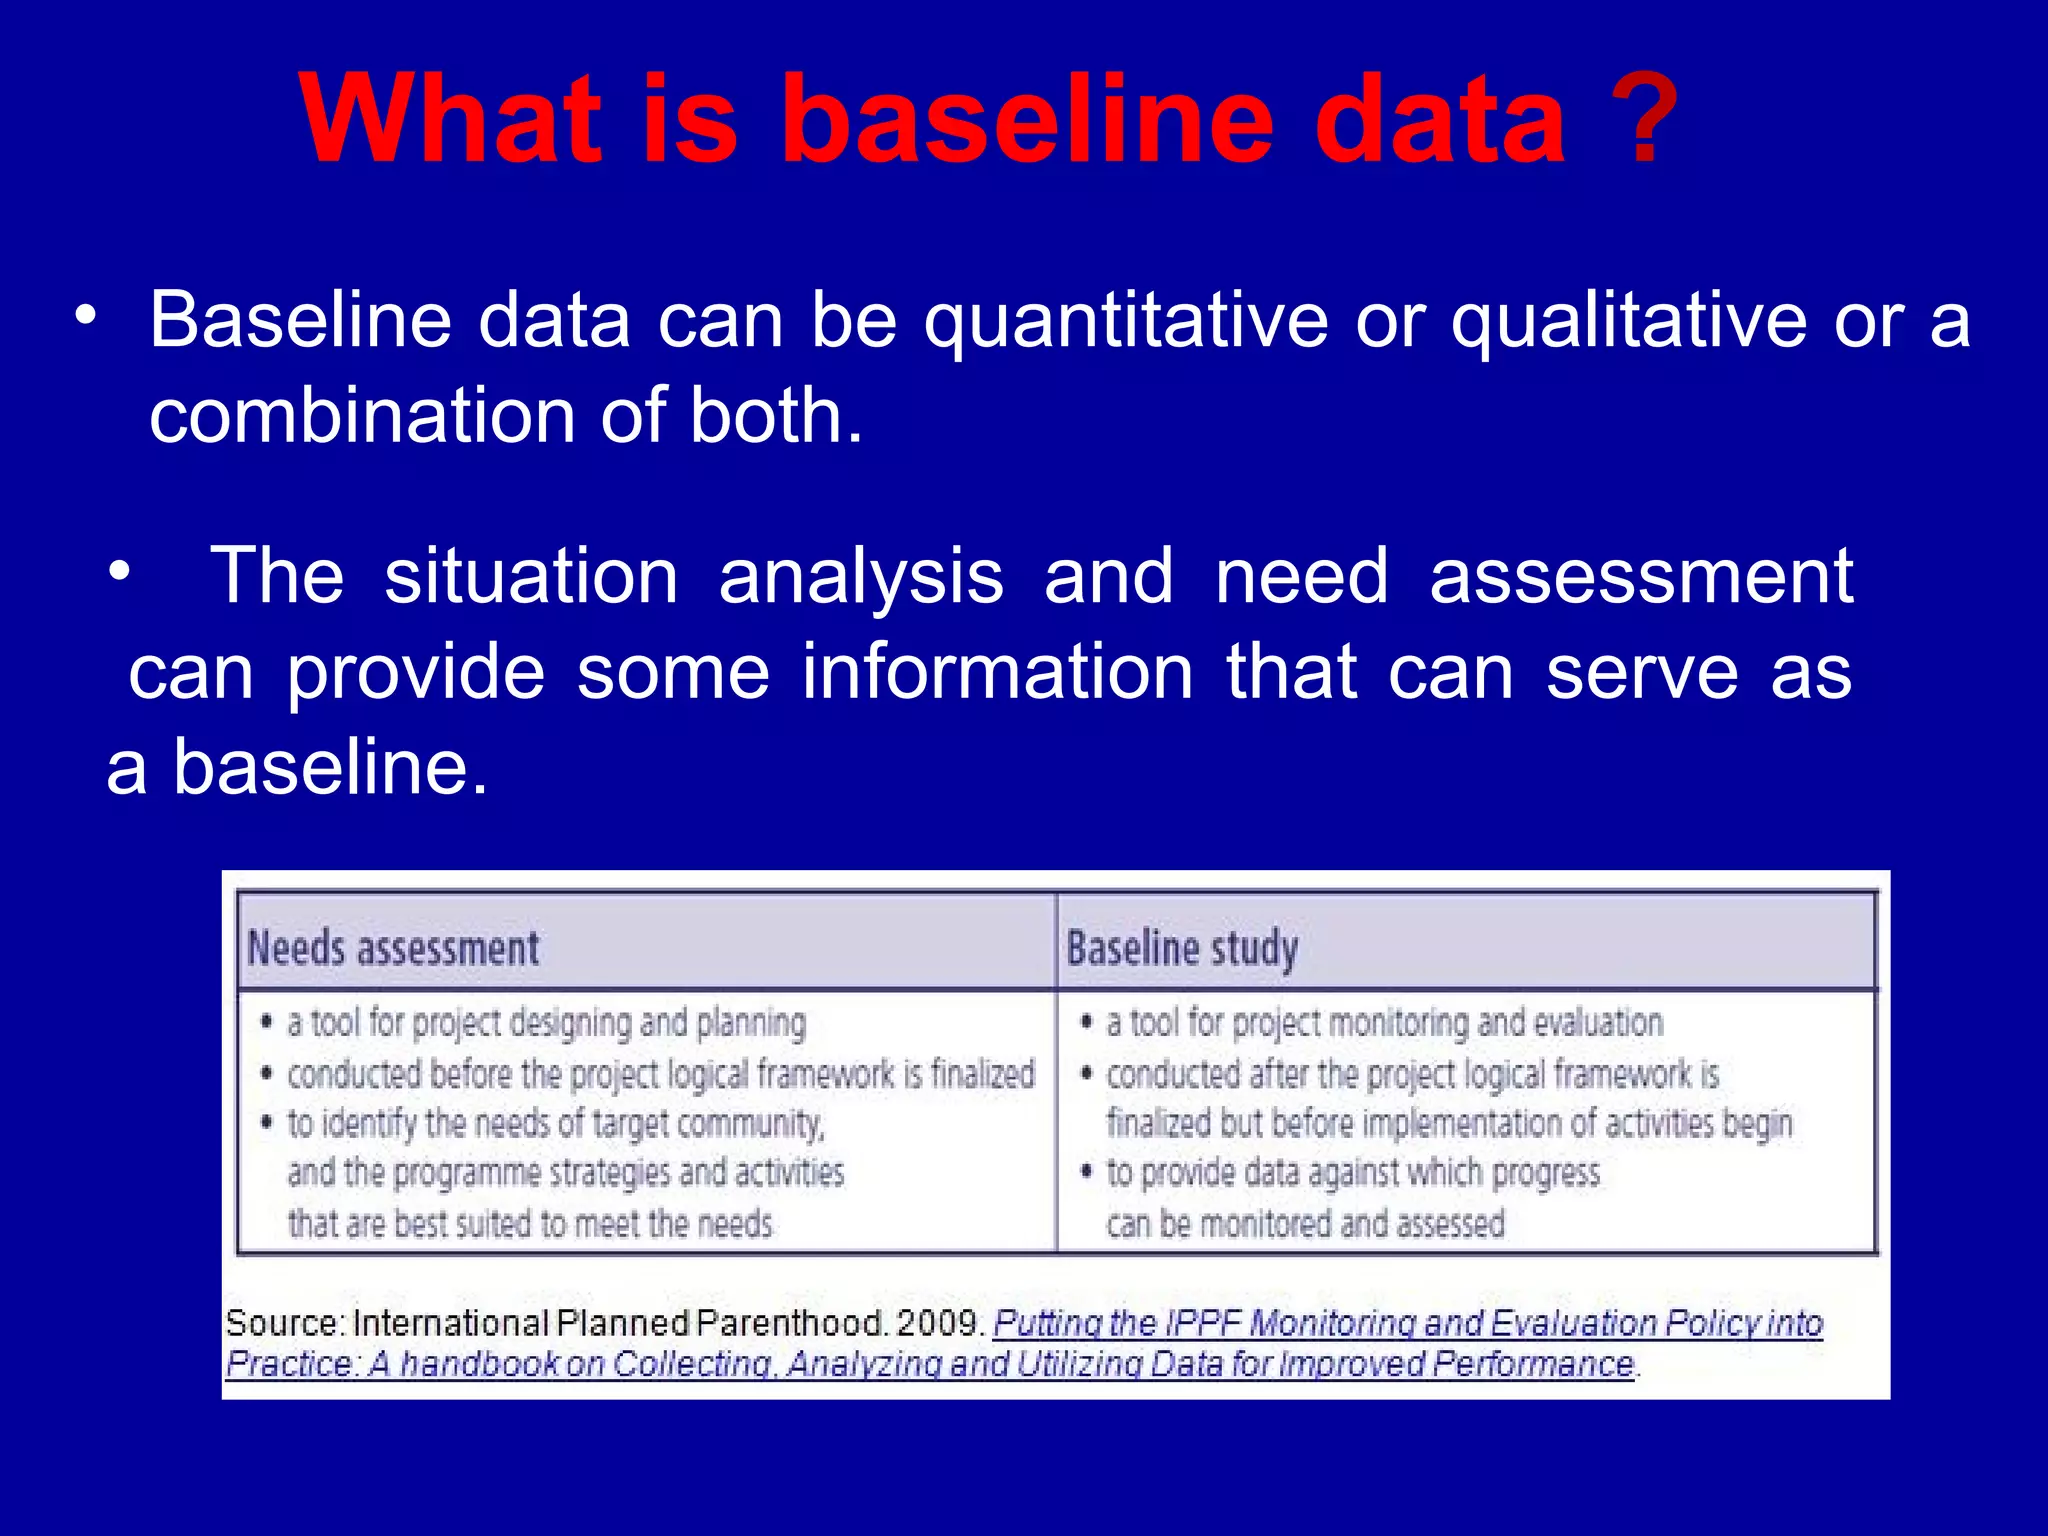


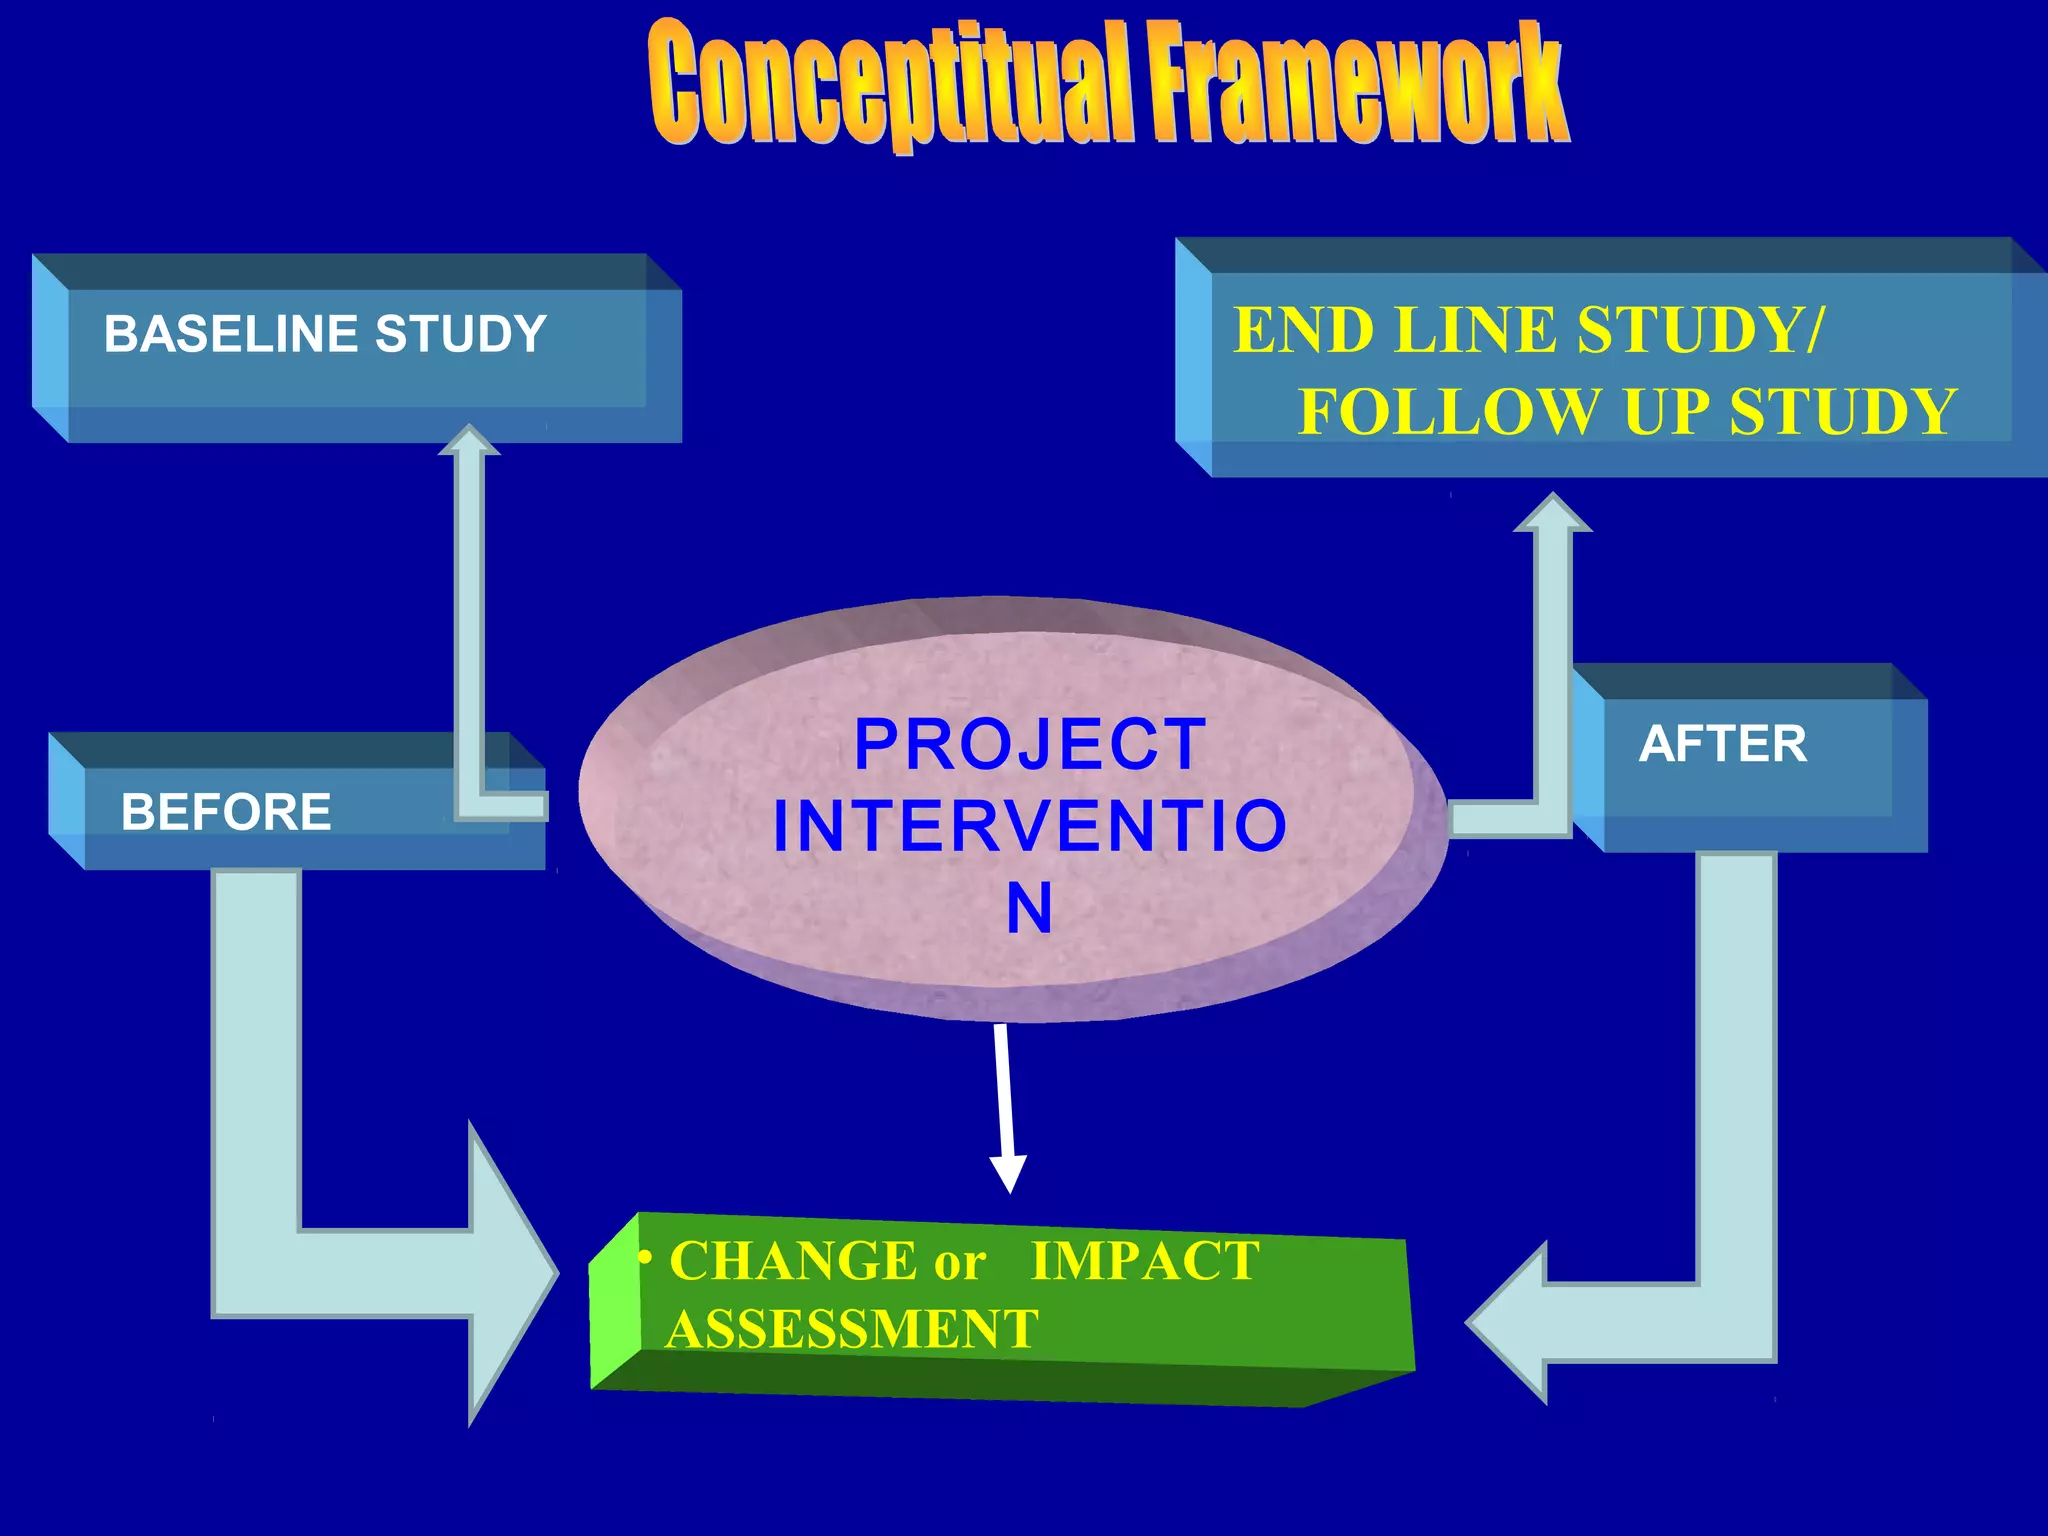


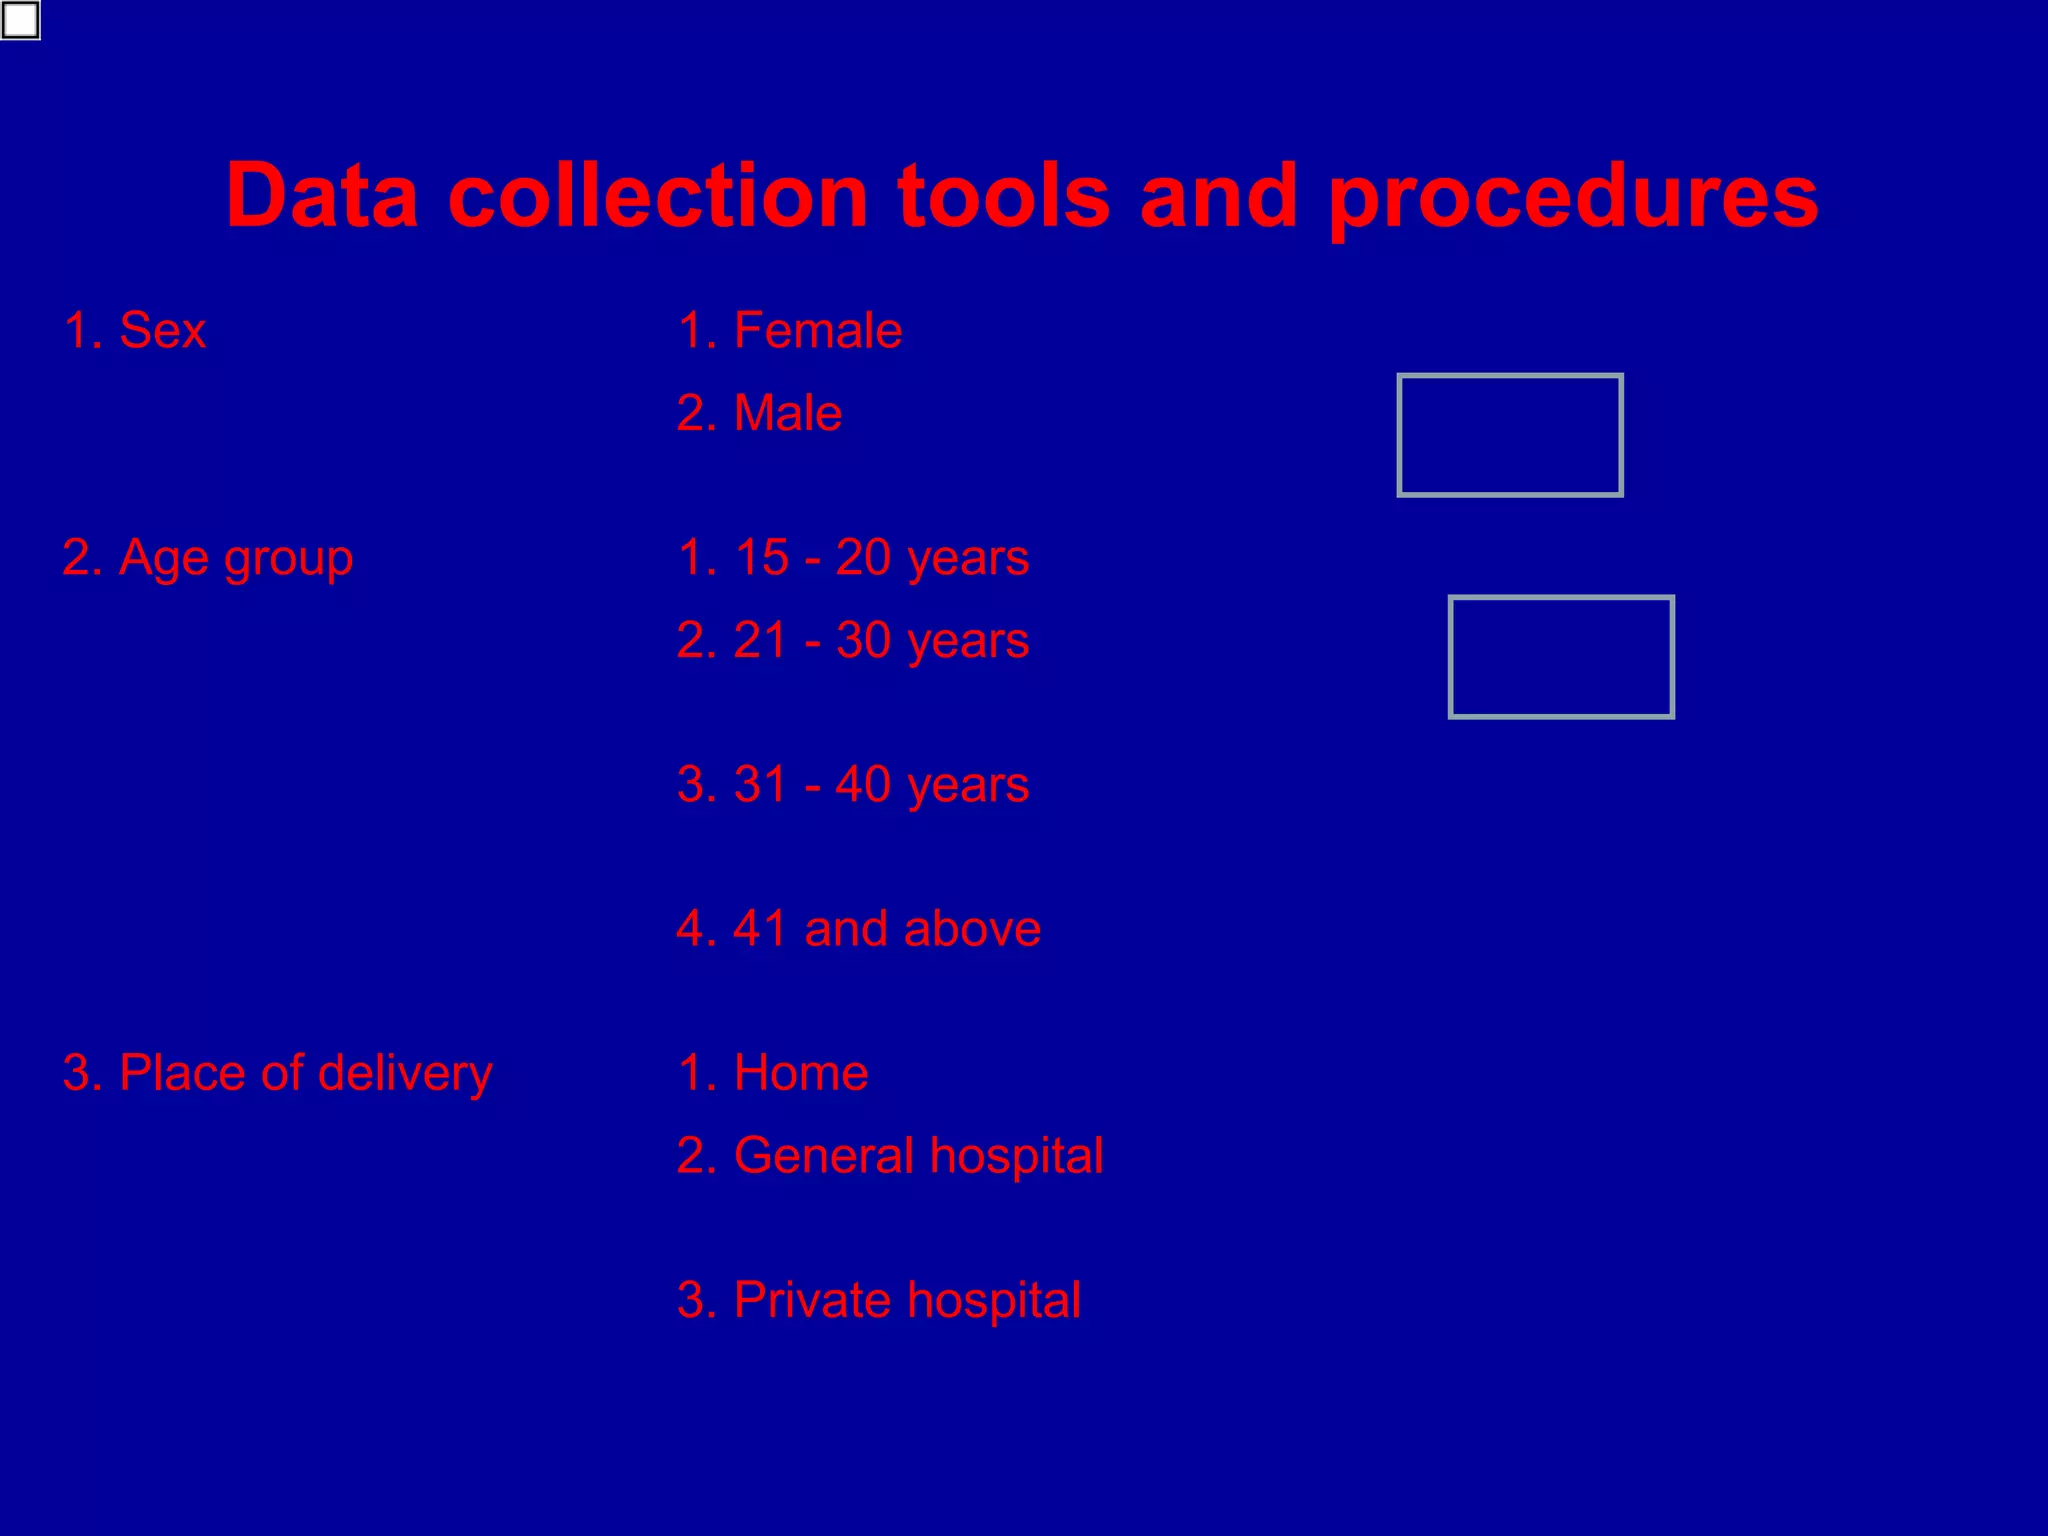


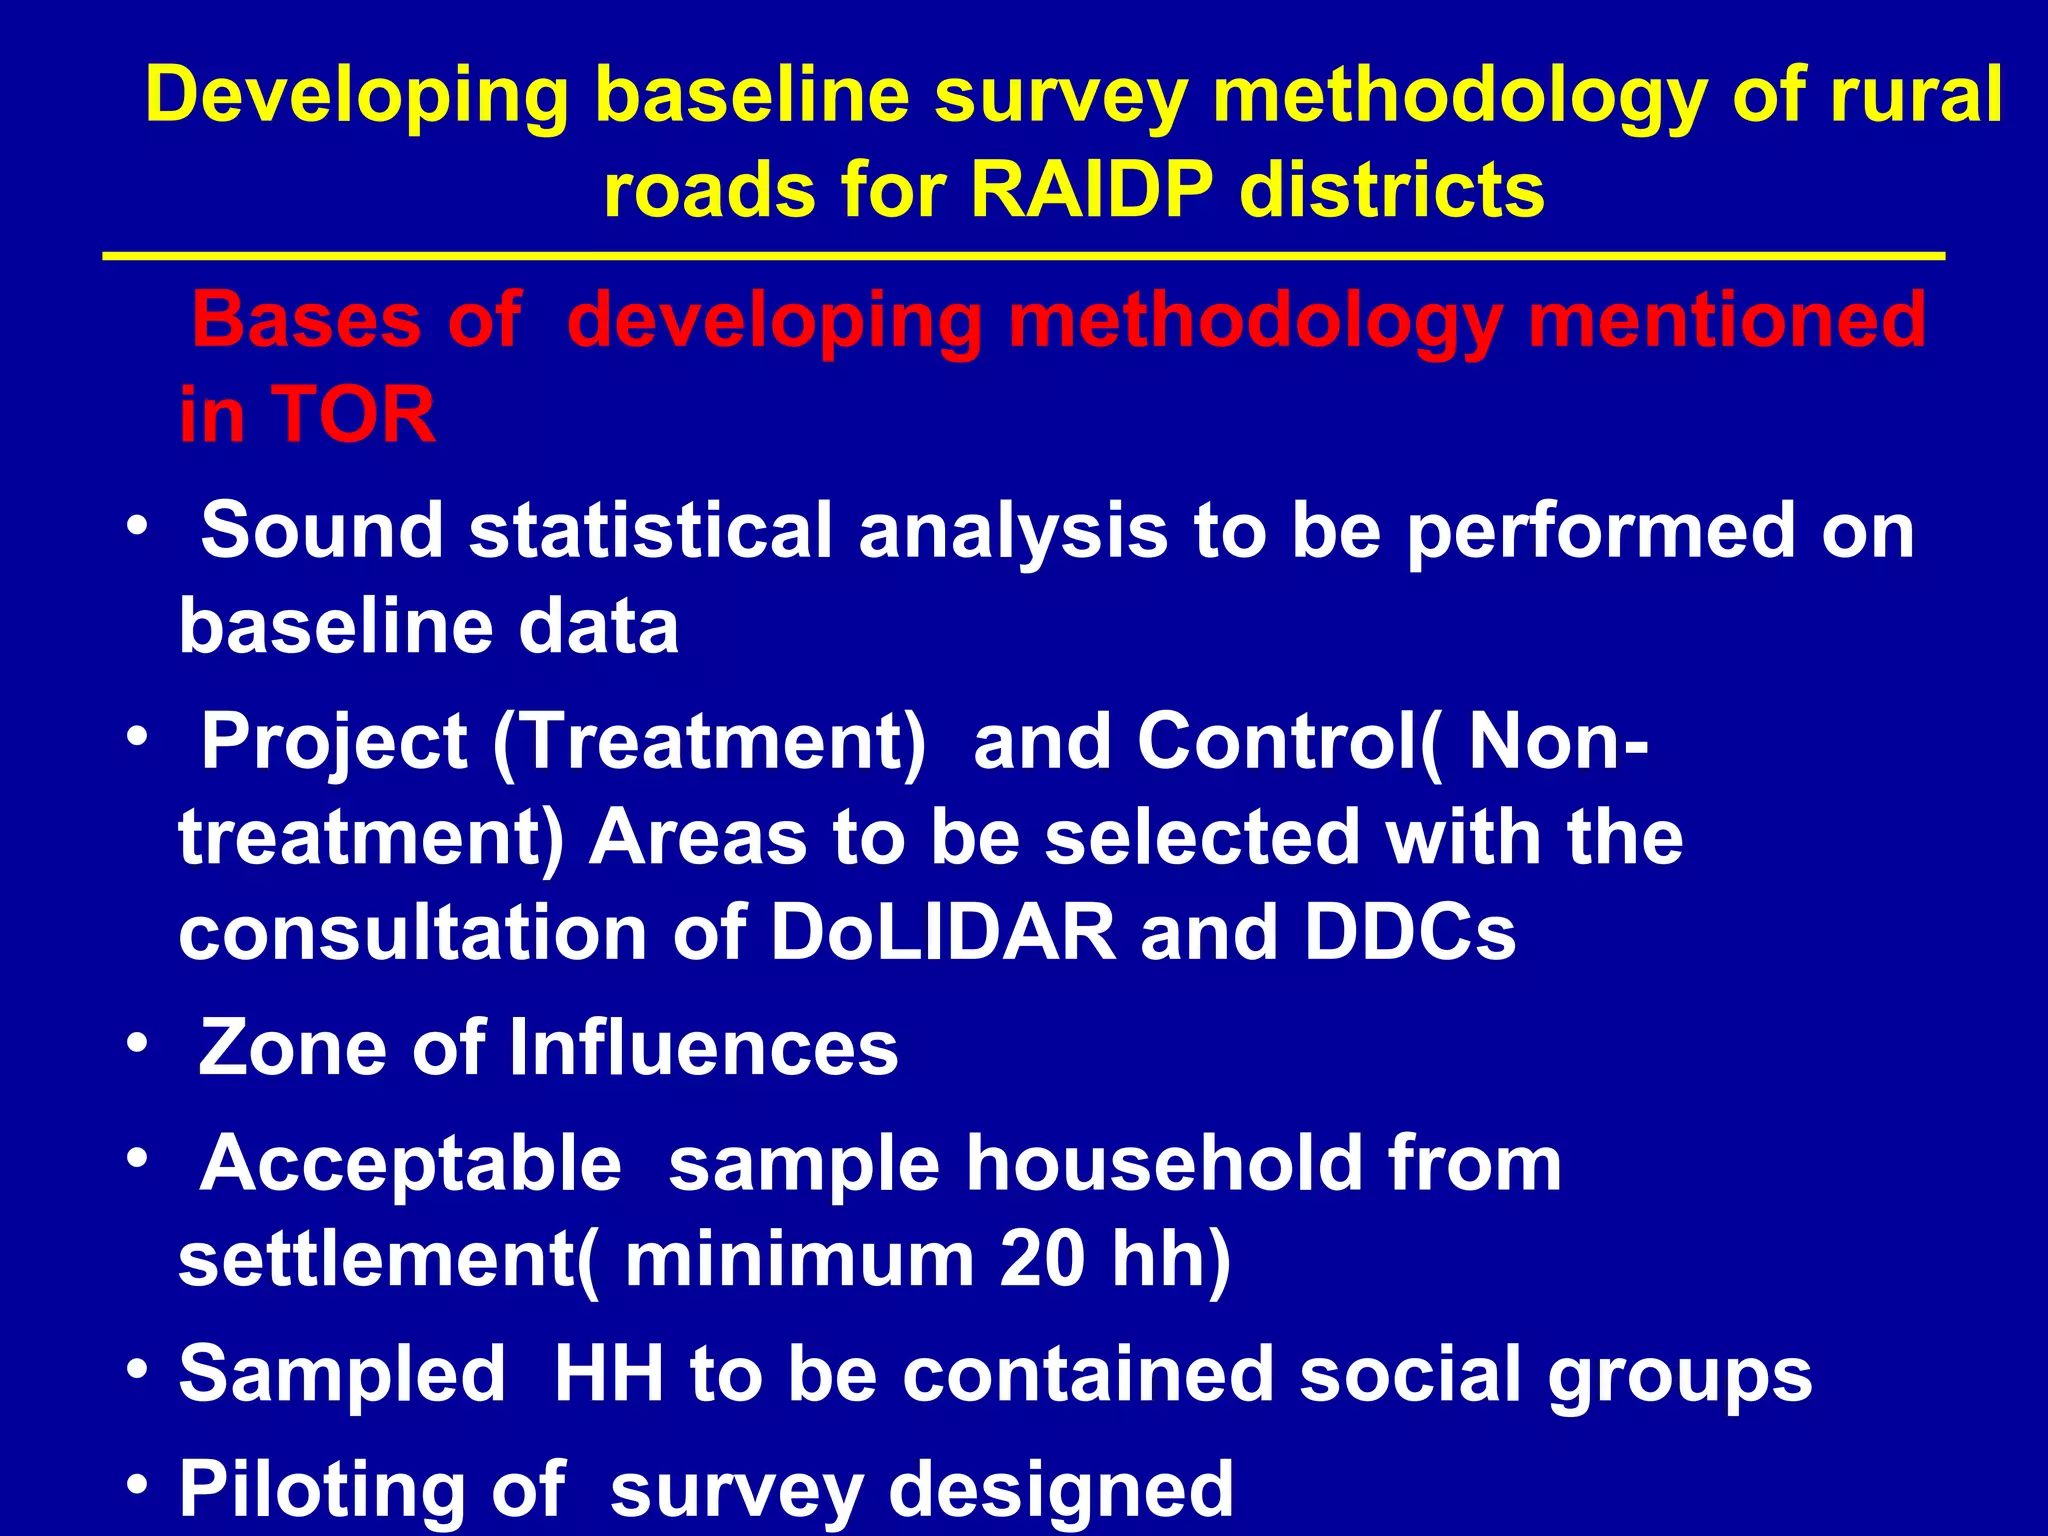
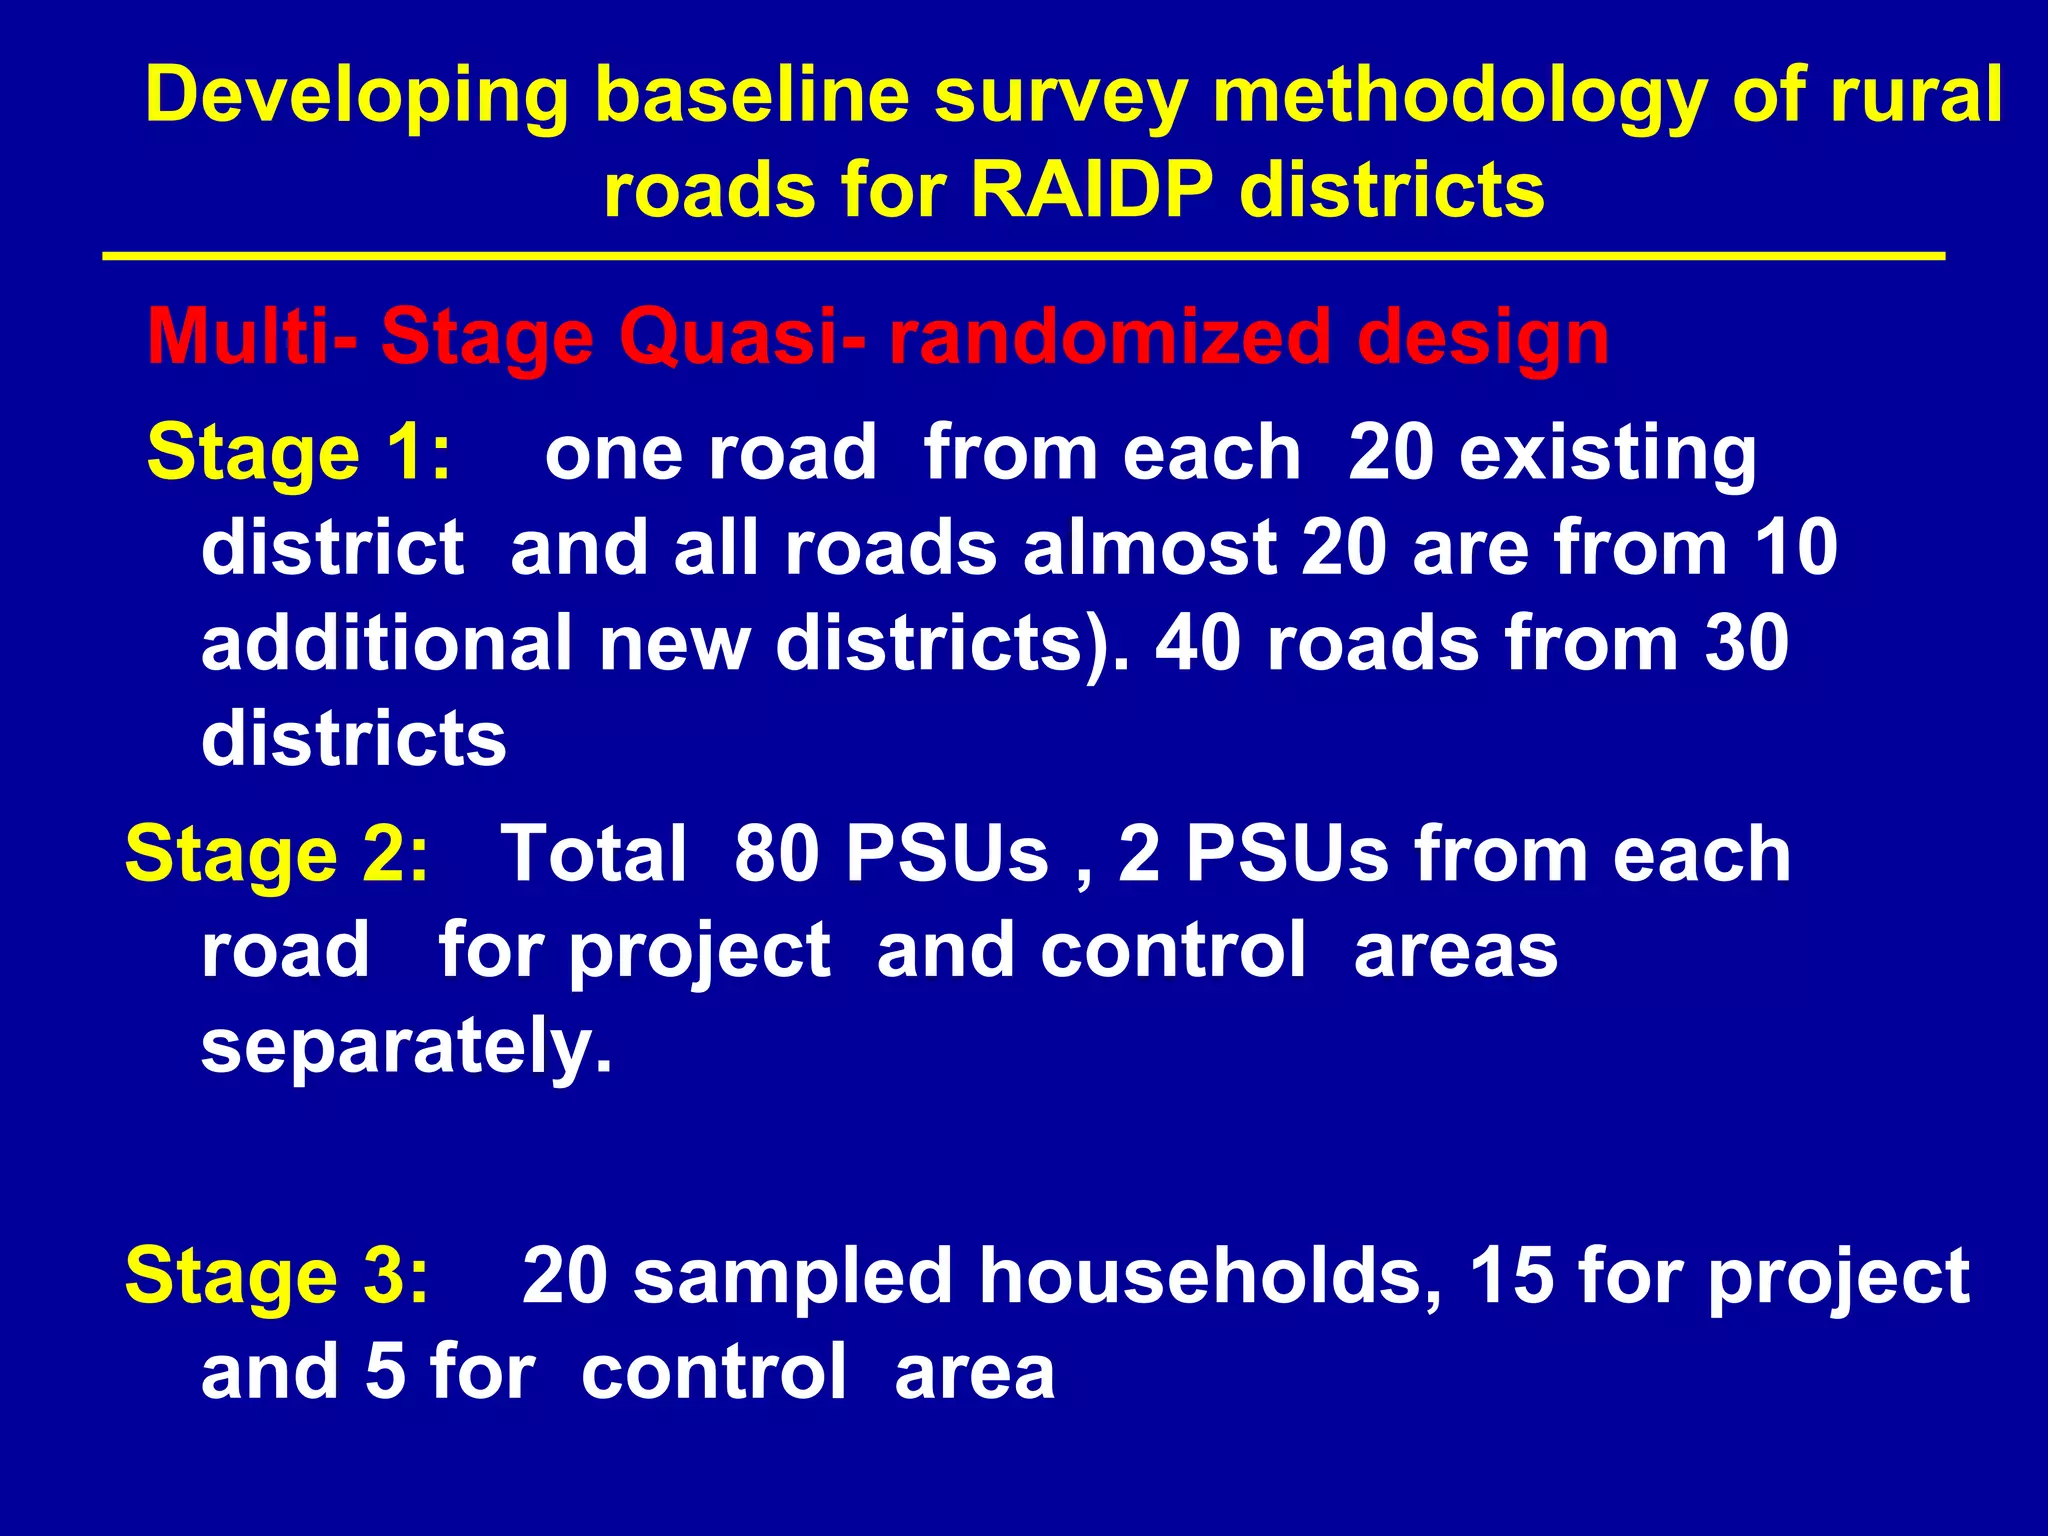
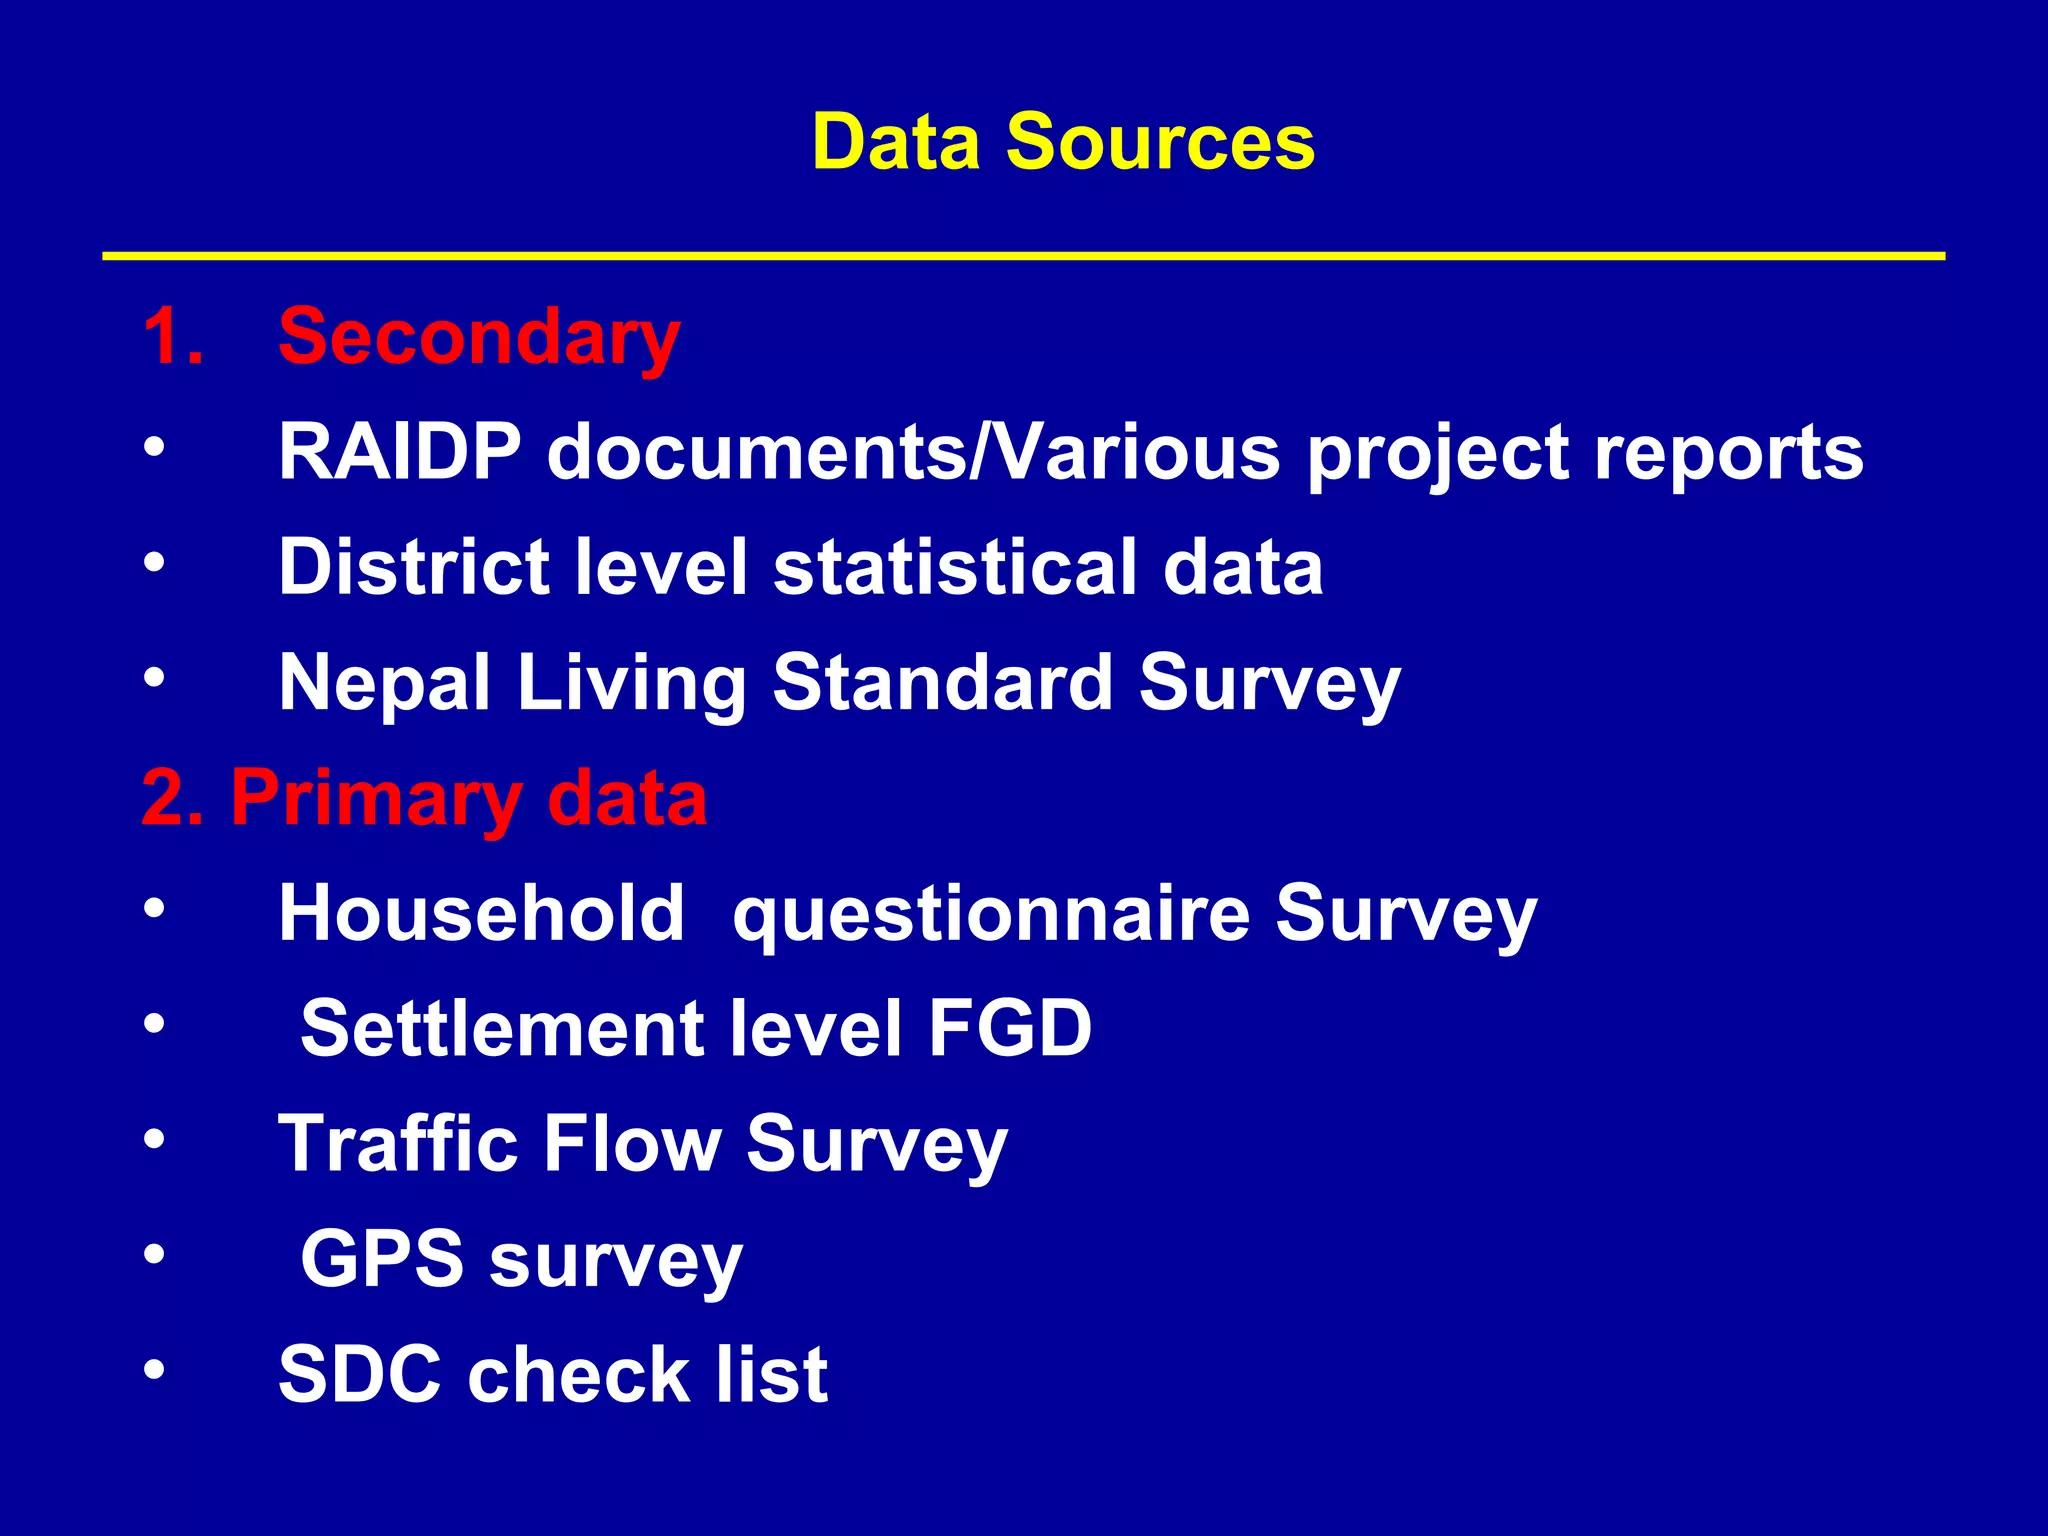
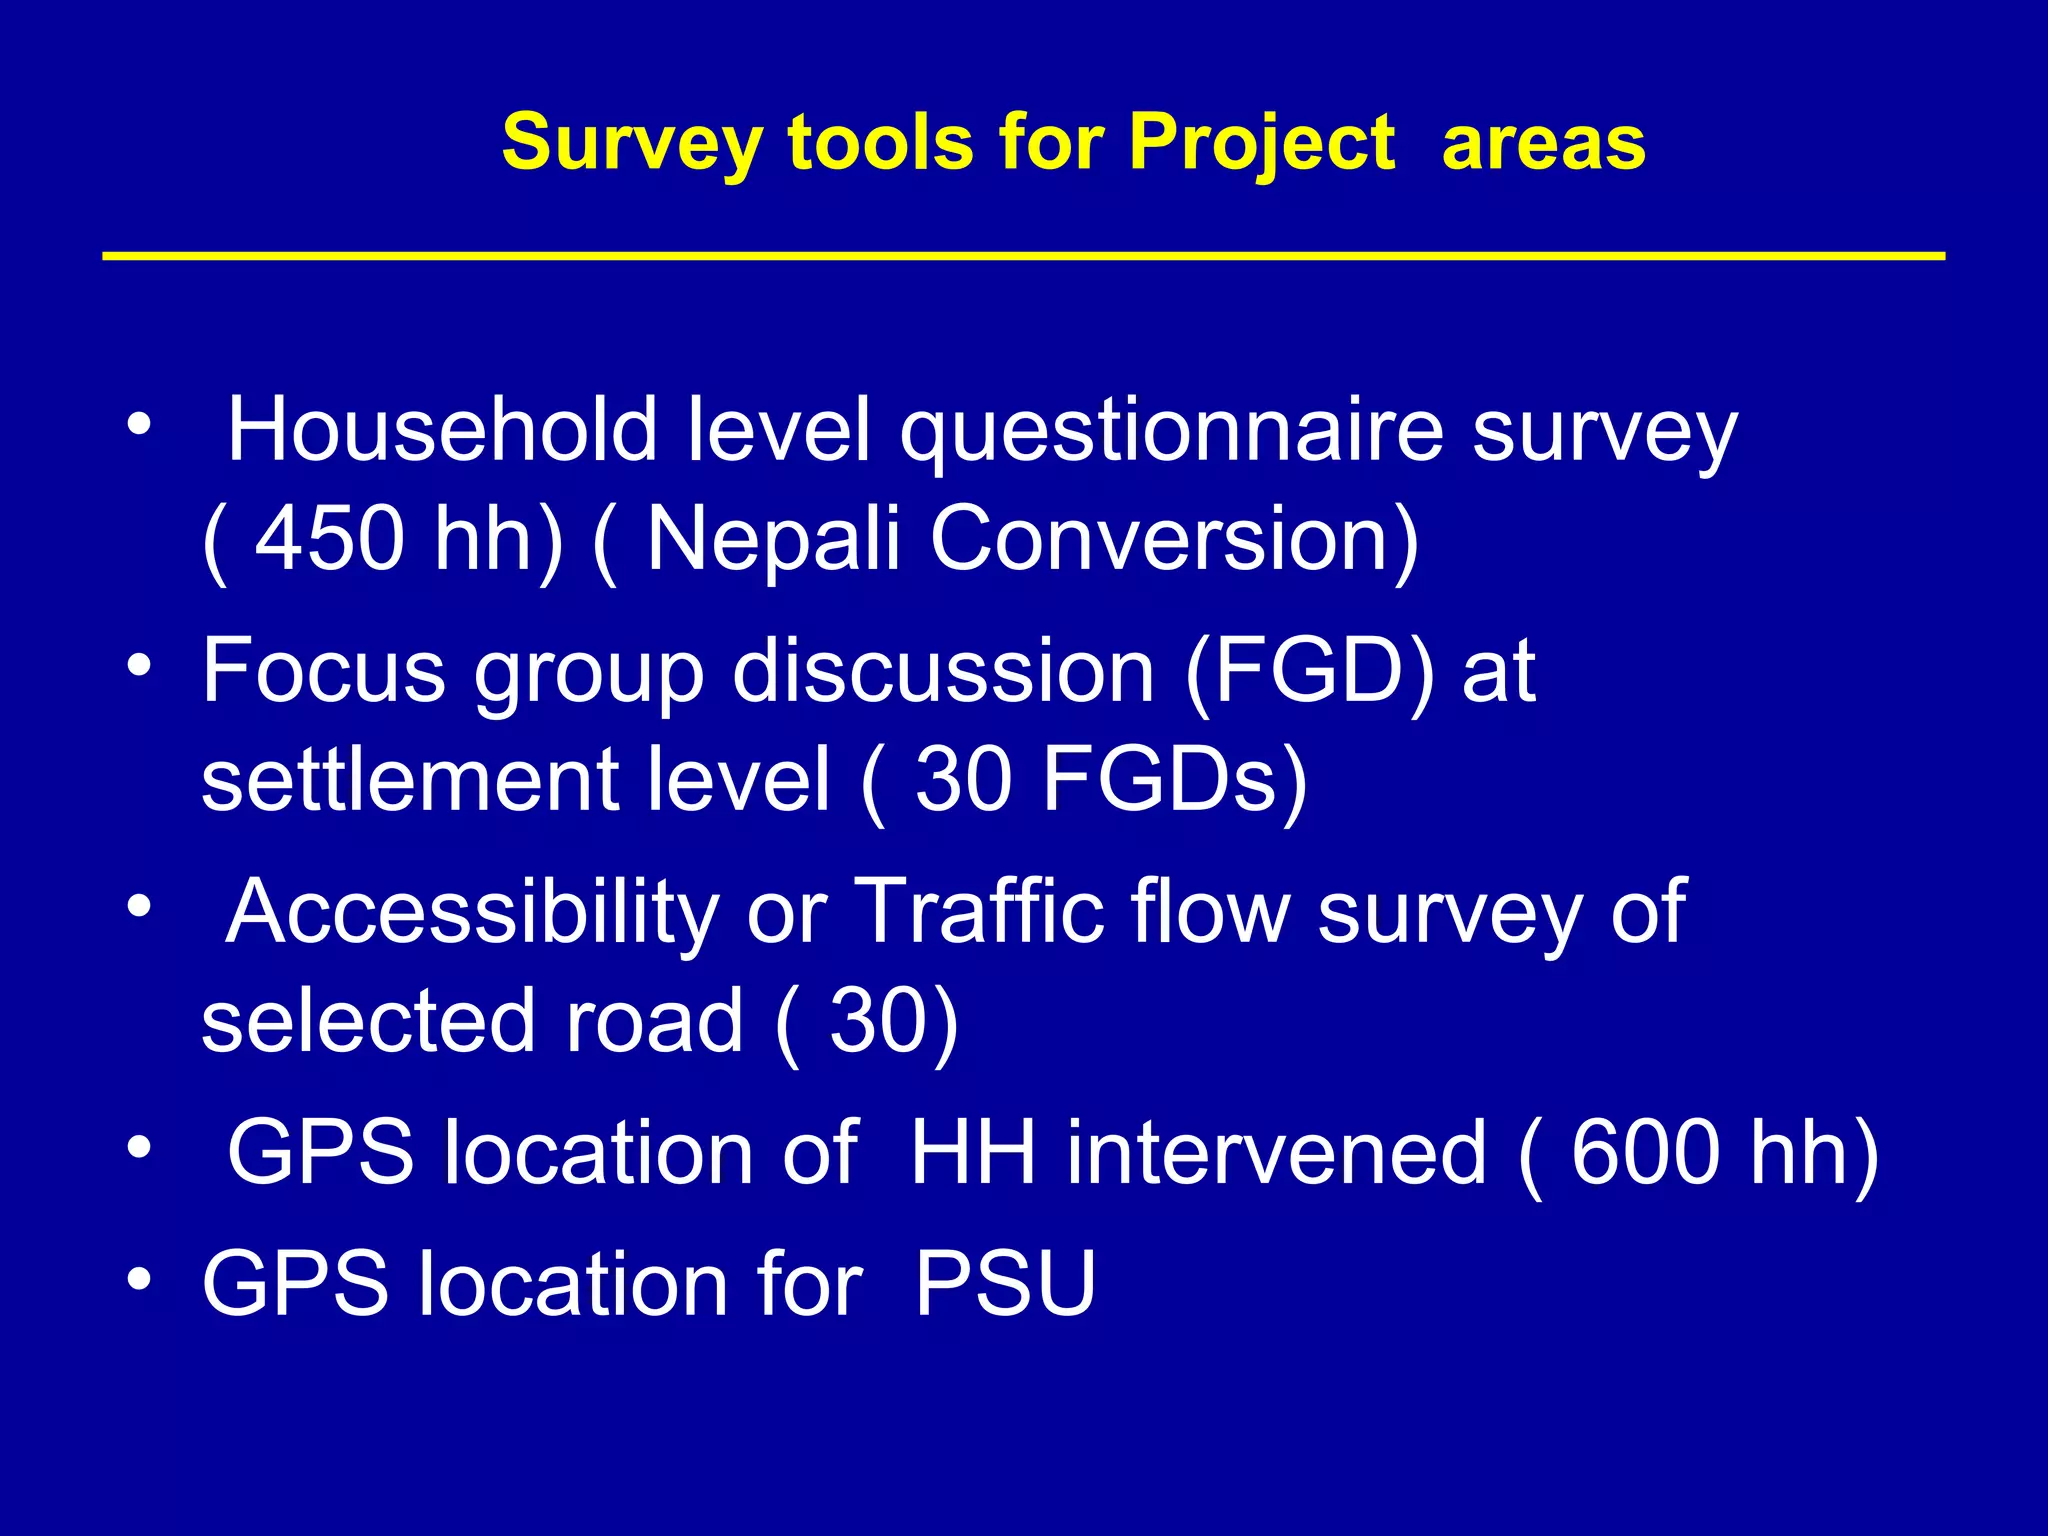


The document provides information on baseline studies for infrastructure development projects in Nepal. It defines a baseline study as a cross-sectional survey that quantifies the current status of a situation in a given population. It aims to measure the distribution of variables at a single point in time. The baseline establishes starting values that can be compared to endline data to assess changes resulting from a project. The document outlines the key components of conducting a baseline study, including objectives, research methodology, data collection and analysis.