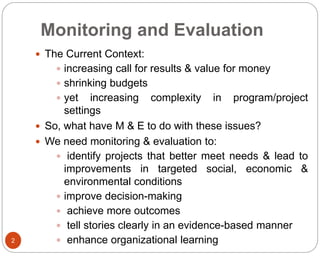
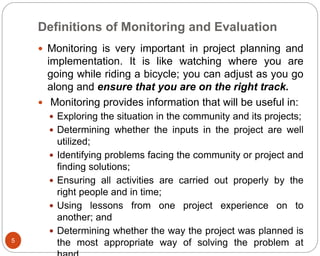
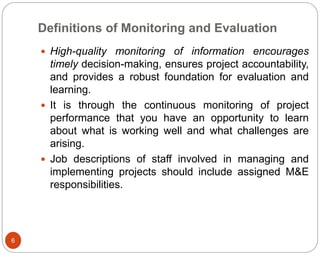
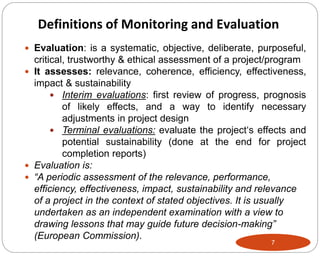
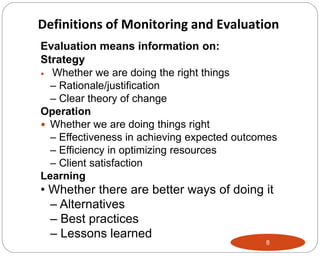
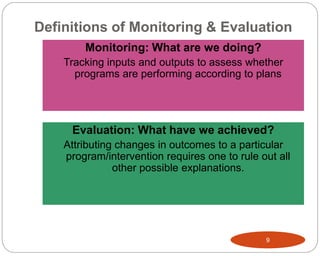
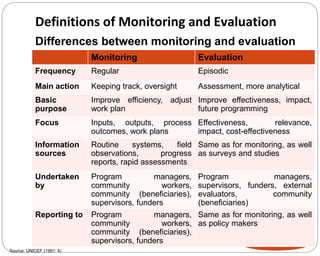
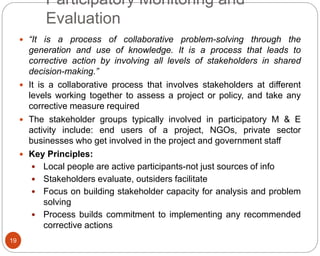
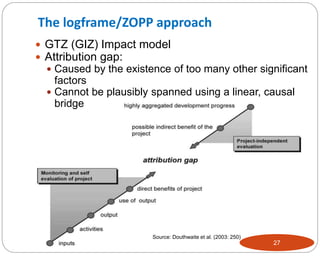
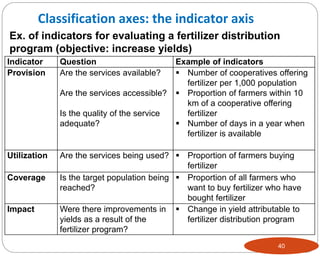
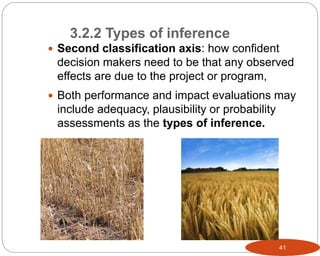
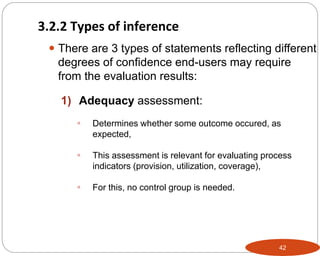
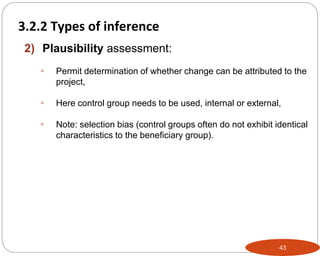
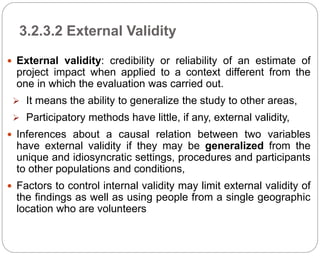
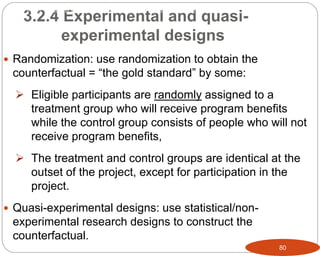
Monitoring involves continuous assessment of project implementation to provide feedback and identify successes and problems. It focuses on schedules, inputs, and services. Evaluation assesses outcomes, impacts, effectiveness, and sustainability. The document discusses the importance of monitoring and evaluation for improving decision-making, achieving outcomes, and organizational learning. It provides definitions and comparisons of monitoring and evaluation. Participatory approaches are emphasized to empower stakeholders. Clear objectives and indicators are needed to measure progress.

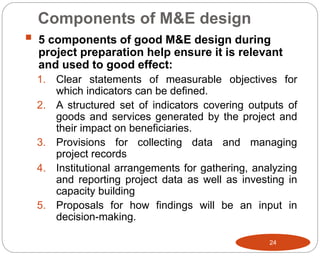

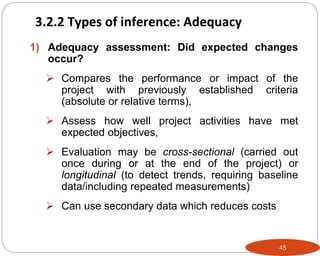
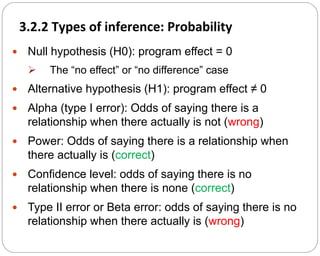
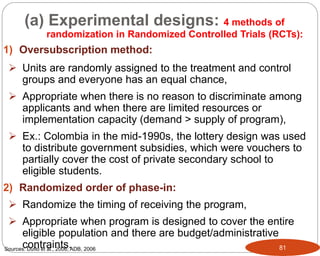
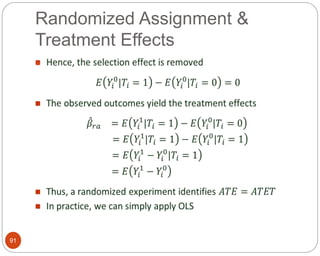

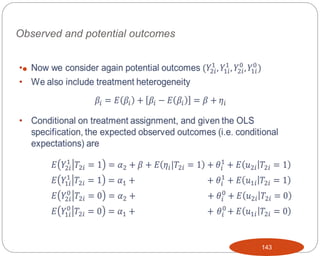
![Difference-in-Difference: data
151
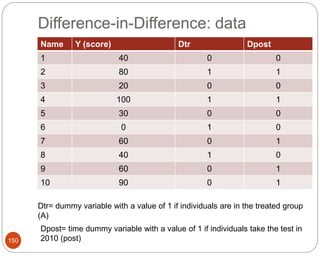
Y (score) Dpost =0
(pre; 2008)
Dpost =1
(post; 2010)
Dtr=0
(Control)
Dtr=1
(Treated)
Difference
0
1
0
2
0
3
2
1
0
DiD with regression
Y = 0
+ 1
Dpost
+ 2
Dtr
+ 3
Dpost
x Dtr
[+ 4
X]+](https://image.slidesharecdn.com/me-220816200942-eb7b6b50/85/M-E-ppt-151-320.jpg)


![Monitoring & evaluation presentation[1]](https://cdn.slidesharecdn.com/ss_thumbnails/monitoringevaluationpresentation1-110509033357-phpapp02-thumbnail.jpg?width=640&height=640&fit=bounds)