Downloaded 215 times


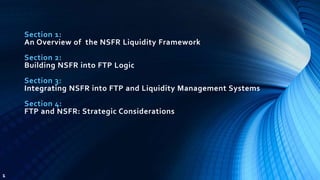


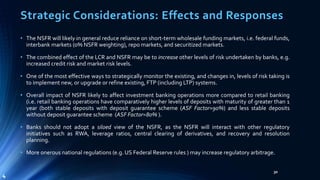
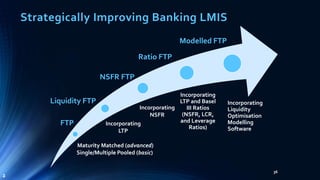
![Integrating LTP into FTP Systems: EXAMPLE 3 (Matz)
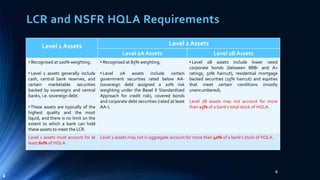
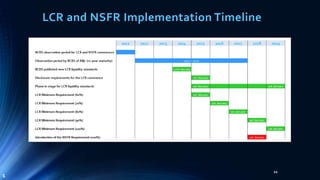
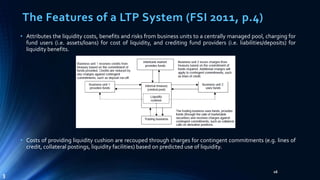
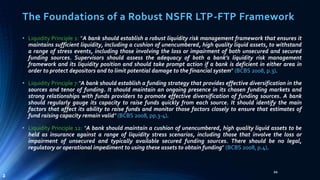
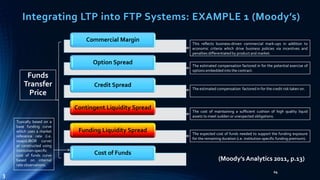
• DIRECT current mismatch costs :
• Mismatch (term structure) costs;
• Mismatch component of liquidity risk is fairly stable;
• Debits and credits should equal after adjustment (e.g. liquidity life of
indeterminate maturity deposits, rollover life of retail time deposits).
• INDIRECT future contingent costs:
• Standby liquidity costs;
• Contingency component of liquidity risk is very volatile;
• Charges and credits need to be 100% assigned to products and business
activities, and full amount of cost (but no more) is allocated as income
to contingent liquidity risk hedges.
• The cost of liquidity contingency risk is the hedge cost:
• Holding unencumbered high-quality marketable assets: Cost is the
forgone income, the opportunity cost, resulting from the choice to hold
lower-yielding assets.
• Holding stable long-term liabilities: Cost is the difference between the
actual cost of funding and the lowest possible cost.
26
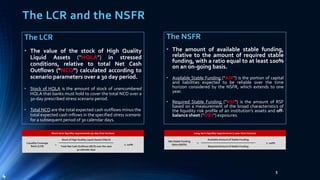
Mismatch term or structural risk is
charged for consuming liquidity
risk, and the offsetting credit is
applied to existing liabilities.
Unfunded
Funded
Revolving Loan
Contingent risk is charged on
unfunded portion of loan, and
offsetting credit is split between
unpledged buffer assets hedge and
long-termliabilities hedge.
Unpledged Liquid
Assets Held
Long Term
Liabilities*
Core Deposits
Long Term Liabilities
Contingent
Charges &
Credits
Mismatch
(Structural)
Charges &
Credits
Liquidity Charges
* Only amounts required to cover contingent risk
(Matz 2011, p.464)
[Sourced from Joanne Trefrey, Bank of Monntreal]
(Matz 2011)
4](https://image.slidesharecdn.com/ftpnsfr1stpresentationfinal-140922131313-phpapp02/85/Basel-III-NSFR-Liquidity-Framework-Theoretical-Implementation-Requirements-26-320.jpg)

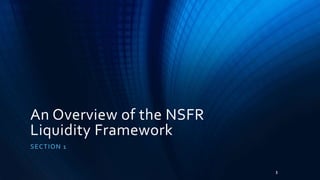
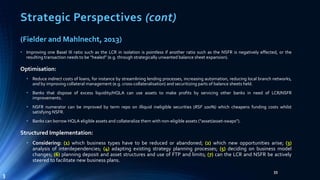
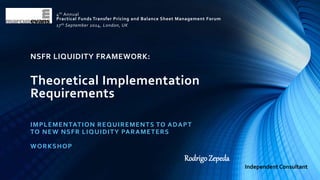
![Strategic Considerations: Increasing the NSFR
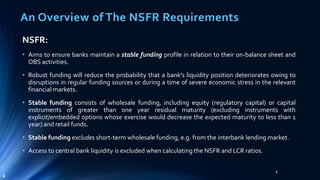
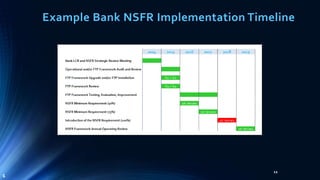
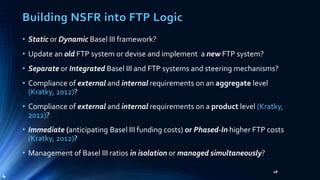
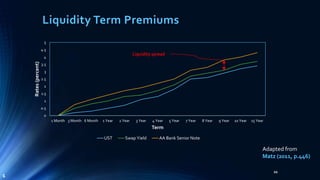
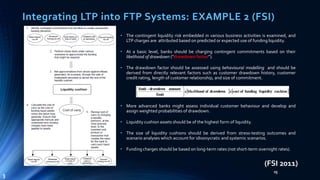
“The changes may go beyond simply changing the composition
of existing balance sheets; banks may also need to exit some
businesses or adopt new business models” (King 2013, p.4153)
31
King (2013):
• The study estimated the NSFR for banks in 15 countries and the
impact on Net Interest Margins (“NIMs”).
• The analysis showed suggested that banks in France, Germany,
Switzerland, and the UK might experience greatest declines in
NIMs in meeting NSFR, owing to their universal banking model with
highly diversified funding and a high concentration of trading assets.
• Average decline for them was -156 basis points (“bp”) compared to
-27 bp for 6 other banks (Canada; Mexico; Netherlands; Spain;
Italy;Australia) below NSFR ratio.
• Banks must either increase ASF, reduce RSF, or both by: (1)
extending maturity of wholesale funding (2) Increase the share of
corporate loans to retail loans and shorten maturity; (3) sell
investments and increase cash holdings; and (4) increase holding
of high-quality liquid bonds.
[Study was based on a sample of (commercial, investment, savings, cooperative, and
mortgage) banks in 15 countries (Australia; Canada; Chile; France; Germany; Hong Kong;
Italy; Japan; Korea; Mexico; Netherlands; Spain; Switzerland; UK; USA) using income
statement and balance sheet data as of year-end 2009]
Strategies to increase the NSFR (King 2013, p.4147)
3](https://image.slidesharecdn.com/ftpnsfr1stpresentationfinal-140922131313-phpapp02/85/Basel-III-NSFR-Liquidity-Framework-Theoretical-Implementation-Requirements-31-320.jpg)
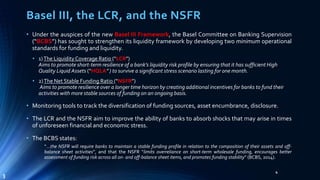
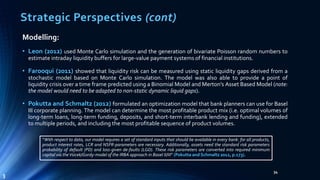
![Strategic Perspectives
32
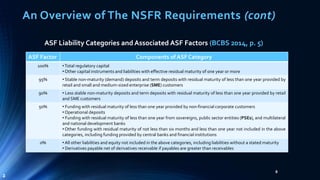
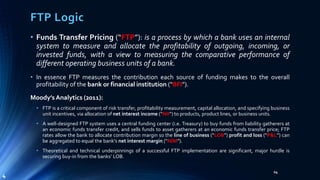
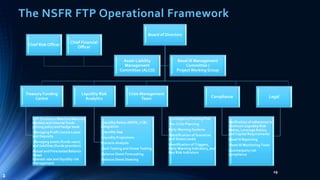
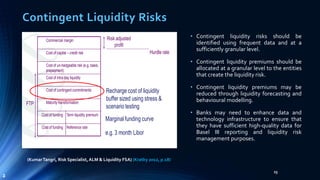
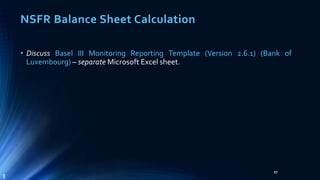
IMF (2014):
• High number of banks meeting minimum 100% NSFR
threshold (86% out of total of 2,079 banks) at end-
2012 (excluding France, Germany, Portugal, Slovenia).
• Sensitivity tests used showed NSFR is sensitive to
changes in the weights assigned to loans and
deposits, and less to securities and OBS categories,
i.e. changes in loan and deposit weights will have a
substantial impact on how banks meet/do not meet
100% NSFR threshold.
• Socio-economic and political context needs to be
taken into account, e.g. high NSFR ratios may reflect
a lack of confidence in the system or potential balance
of payment problems indicated by high government
securities holdings and deposits.
[Study was based on an empirical analysis of end-2012 financial data for
2,079 banks covering 128 countries]
PwC (2014):
• Secured financing transactions unduly penalised as
transacted with non-banks (50%weighting).
• Disruptive impact on derivatives (50% weighting with
central clearing house), repos, and trade finance
agreements (50%weighting).
• Three potential options for dealing with NSFR:
1. reduce volume of NSFR-unfriendly transactions (likely
to erode market credibility;
2. reduce asset-liability mismatch by reducing tenor of
assets (likely to lead to loss of clients seeking
alternative maturities elsewhere);
3. extend maturities of liabilities (most viable option).
[Findings are partly based on the views of bankers attending a PwC-hosted
round table on the latest developments in NSFR]
3](https://image.slidesharecdn.com/ftpnsfr1stpresentationfinal-140922131313-phpapp02/85/Basel-III-NSFR-Liquidity-Framework-Theoretical-Implementation-Requirements-32-320.jpg)


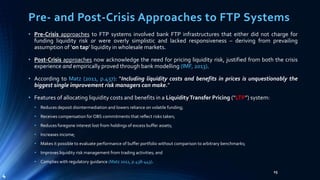
This document summarizes a presentation on implementing the Net Stable Funding Ratio (NSFR) liquidity framework. It discusses: 1) An overview of the NSFR and how it differs from the Liquidity Coverage Ratio in measuring long-term versus short-term liquidity; 2) How to build the NSFR into funds transfer pricing (FTP) logic by updating FTP systems to incorporate long-term funding costs and risks; 3) Integrating the NSFR into existing FTP and liquidity management systems through a liquidity transfer pricing framework that allocates liquidity costs and benefits.


