
Recommended
Recommended
More Related Content
What's hot
What's hot (20)
Similar to 1. challenges of regulatory liquidity risk
Similar to 1. challenges of regulatory liquidity risk (20)
More from crmbasel
More from crmbasel (20)
1. challenges of regulatory liquidity risk
- 1. 1 Challenges of Regulatory Liquidity Risk Mr. Fai Y. LAM Senior Vice President, CTRISKS PRIMA 2005 Award of Merit MSc in Financial Engineering PRM, FRM, CFA, CAIA 6:30 pm to 8:00 pm Monday 12 April 2010 The University of Hong Kong E-mail faiylam@gmail.com 2 Outline Background Regulatory liquidity measures Liquidity risk measures 3 Part I Regulatory Liquidity Measures 4 Basel committee on liquidity risk
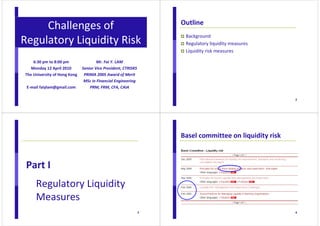
- 2. 5 What happened during the period? Basel new capital accord (Basel II) Kicked off in January 2001 Finalized in May 2006 Glass–Steagall Act repealed on November 12, 1999 Commercial banks in US participated in investment banking activities Paper On Default Correlation: A Copula Function Approach” by Dr. David X. LI’s, RiskMetrics Group published in 2000 Acceleration of the CDO market CDS market grew to US$ 45 tn notional in 2007 Subprime mortgage market grew to US$ 1.3 tn in 2007 Financial tsunami emerged in 2007 Basel Committee issued guideline “Principles for Sound Liquidity Risk Management and Supervision” in Sep 2008 Basel Committee issued consultative paper “International framework for liquidity risk measurement, standards and monitoring “ in Dec 2009 6 Regulatory liquidity Standards Liquidity coverage ratio Net stable funding ratio Monitoring tools Contractual maturity mismatch Concentration of funding Available unencumbered assets Market-related monitoring tools Stock of high quality liquid assets ≥ ≥ − Stock of high quality liquid assets Cash outflows over a day time period 7 Liquidity coverage ratio To ensure existing liquidity can support the cash flows over a 30-day period under an acute liquidity stress scenario 30 Cash lows over a day time period Net cash outflows over a day time period inf 30 100% 30 − − − 8 High quality liquid assets Fundamental characteristics Low credit and market risks Ease and certainty of valuation Low correlation with risky assets Listed on a developed and recognised exchange market Market-related characteristics Active and sizable market Presence of committed market makers Low market concentration Flight to quality
- 3. 9 High quality liquid assets Cash (100%) Qualifying central bank receivables (100%) Domestic sovereign or central bank debt in domestic currency (100%) Qualifying marketable securities from sovereigns, central banks, public sector entities, and multi-lateral development banks (100%) Qualifying corporate bonds and covered bonds rated AA to AAA (80%) Qualifying corporate bonds and covered bonds rated A- to AA- (60%) 10 Cash inflows Amounts receivable from retail counterparties (100% of planned inflows from performing assets) Amounts receivable from wholesale counterparties (100% of planned inflows from performing wholesale customers) Receivables in respect of repo and reverse repo transactions backed by illiquid assets and securities lending/borrowing transactions where illiquid assets are borrowed (100%) Other cash inflows, including planned contractual receivables from derivatives 11 Cash outflows (1) Retail deposits Stable deposits (minimum 7.5%) Less stable retail deposits (minimum 15%) Unsecured wholesale funding Stable, small business customers (minimum 7.5%) Less stable, small business customers (minimum 15%) Non-financial corporates, sovereigns, central banks and public sector entities with operational relationships (25% of deposits needed for operational purposes) Non-financial corporates, no operational relationship (75%) Other legal entity customers and sovereigns, central banks, and PSEs without operational relationships (100%) Secured funding Funding from repo of illiquid assets and securities lending/borrowing transactions illiquid assets are lent out (100%) 12 Cash outflows (2) Additional requirements Liabilities related to derivative collateral calls related to a downgrade of up to 3-notches (100% of collateral that would be required to cover the contracts in case of up to a 3-notch downgrade) Market valuation changes on derivatives transactions (amount to be nationally determined) Valuation changes on posted noncash or non-high quality sovereign debt collateral securing derivative transactions (20%) ABCP, SIVs, Conduits, etc: Liabilities from maturing ABCP, SIVs, SPVs, etc (100% of maturing amounts and 100% of returnable assets) Term Asset Backed Securities (including covered bonds) (100% of maturing amounts)
- 4. 13 Cash outflows (3) Currently undrawn portion of committed credit and liquidity facilities to: Retail clients (10% of outstanding lines) Non-financial corporates, credit facilities (10% of outstanding lines) Non-financial corporates, liquidity facilities (100% of outstanding lines) Other legal entity customers (100% of outstanding lines) Other contingent funding liabilities (such as guarantees, letters of credit, revocable credit and liquidity facilities, etc.) (to be determined by supervisors, specific to needs at certain banks) Planned outflows related to renewal or extension of new loans (retail or wholesale) (100%) Any other cash outflows (including planned derivative payables) 14 Net stable funding ratio A minimum acceptable amount of stable funding based on the liquidity characteristics of an institution’s assets and activities over a one year horizon Availableamount of stable funding quired amount of stable funding 100% ≥ Availableamount of stable funding Re quired amount of stable funding Re ≥ 15 Available amount of stable funding Capital Preferred stock with maturity of equal to or greater than one year Liabilities with effective maturities of one year or greater The portion of “stable” non-maturity deposits and/or term deposits with maturities of less than one year that would be expected to stay with the institution for an extended period in an idiosyncratic stress event 16 Required amount of stable funding The value of assets held and funded by the institution, multiplied by a specific required stable funding factor assigned to each particular asset type The amount of off-balance sheet activity (or potential liquidity exposure) multiplied by its associated required stable funding factor (RSF)
- 5. 17 Required stable funding (RSF) factor The RSF factors assigned to various types of assets are parameters intended to approximate the amount of a particular asset that could not be monetised through sale or use as collateral in a secured borrowing on an extended basis during a liquidity event lasting one year The RSF factor applied to the reported values of each asset or off-balance sheet exposure is the amount of that item that supervisors believe should be supported with stable funding Assets that are more liquid and more readily available to act as a source of extended liquidity in the stressed environment identified above receive lower RSF factors (and require less stable funding) than assets considered less liquid in such circumstances and, therefore, require more stable funding 18 Regulatory effort (1) A big step from the Basel Committee guideline “Principles for Sound Liquidity Risk Management and Supervision” (Sep 2008) Formally define regulatory liquidity in a consistent and a measurable framework Relatively easy to calculate Deterministic, snapshot, rating factor approach 19 Regulatory effort (2) Recognition of government related entities as the top funding sources Appreciation of high quality corporate and covered bonds Regulatory liquidity economic liquidity Limited details on derivatives 20 Regulatory effort (3) HKMA Viewpoint article 11 June 2009 http://www.info.gov.hk/hkma/eng/viewpt/ 20090611e.htm *Source : Reorganisation of Banking Departments in April 2010, HKMA
- 6. 21 Potential impacts to banking industry Competition on high quality assets = high cost of liquidity Downward pressure on BBB rated corporate bonds and covered bonds Merge and acquisition of financial institutions Political bias on funding to “too large to fail” Acceleration of coverage to life insurance businesses Stable and diversified funding from insurance premium Mortality risk uncorrelated with credit market More supervisory reporting, reviews and examinations 22 A simple question How large is my bank’s funding liquidity risk? 23 Outstanding questions 1. How to set funding liquidity risk limits? 2. Is the funding liquidity risk increasing or decreasing during the last 12 months? 3. Which branch contributes the most funding liquidity risk? 4. How to diversify the funding sources? 5. How to perform funding liquidity stress testing? 6. What will be the potential loss in the next funding liquidity crisis? 7. How to plan for contingency funding? 8. How to incorporate funding liquidity risk into cost? 24 Part II Economic Liquidity Measures
- 7. 25 Probability Inflow Modelling expected total cash inflow Expected total cash inflow Calculated according to economic liquidity requirements Greater than or equal to 0 Asymmetric Long right tail dI IdW = × − + ⋅ 0 : Expected total cash inflow for time T, estimated at time 0 26 Modelling expected total cash inflow Lognormal expected total cash inflow model I T : Total cash inflow at time T I σI : Volatility of expected total cash inflow (0,1) 2 exp 2 0 = I I I I T I I T Normal T I I σ σ σ 27 Modelling expected total cash outflow Probability Outflow Expected total cash outflow Calculated according to economic liquidity requirements Greater than or equal to 0 Asymmetric Long right tail 28 Modelling total cash outflow Lognormal total cash outflow model dO OdW = × − + ⋅ 0 : Expected total cash outflow for time T, estimated at time 0 O T : Total cash outflow at time T O σO : Volatility of total cash outflow (0,1) 2 exp 2 0 = O O O O T O I T Normal T O O σ σ σ
- 8. 29 High quality liquid assets A random variable subject to Expected total cash inflow and expected total cash outflow Volatilities of expected total cash inflow and expected total cash outflow Correlation between total cash inflow and total cash outflow High quality liquid assets at timeT − Expected total cash outflow at timeT Expected total cash low at timeT ( ,0) inf ,0 Max = − T T Max O I = 30 Expected high quality liquid assets [ ] ( ) ( ) E Liquidity O N d I N d O 0 ˆ σ σ d d T ˆ σ σ σ 2 ρσ σ I O I O = − = = − + = + − x ∫ ∞ − 1 = − dt t N x T T I d 2 exp 2 ( ) ˆ 2 ˆ ln where 2 2 2 2 1 2 0 1 0 1 0 1 π σ 31 Distribution of high quality liquid assets A random variable following a multi-lognormal distribution No closed form solution To be realized easily with Monte Carlo simulation ( ) ( ) High quality liquid assets at timeT × − + ⋅ O O − × − + ⋅ T Normal I I I T Correlation[ (0,1), (0,1)] 0,1 ,0 2 exp 0,1 2 exp 2 0 2 0 I O O Normal Normal I T Normal T O Max = = ρ σ σ σ σ 32 Distribution of high quality liquid assets Probability Liquidity Average 99.9% Economic liquidity at 99.9% confidence level Expected liquidity Unexpected liquidity
- 9. 33 Findings of common sense $1 mn high quality liquid assets $1 mn planned cash inflow $1 mn planned cash inflow $1 mn planned cash outflow Two small funding sources are better than one large funding source Two small lending customers are better than one large lending customer 34 Applications of economic liquidity measures Economic liquidity limit Economic liquidity at 99.9% confidence level Trend analysis What is the change of liquidity risk during last year? Peer analysis Which branch is the outlier? Which branch contributes the most liquidity risk? Diversification analysis What is the savings in economic liquidity by adding more funding sources? Scenario analysis How much more economic liquidity is required if a new branch is opened in Shanghai? Stress testing Manipulation of expected cash outflow, expected cash in outflow, volatilities and correlation 35 Further extension Expected total cash outflow and expected total cash inflow broken down by business line, funding source and customer base Stock of high quality liquid assets at timeT M Σ k = − Total cash outflow at timeT Σ = = N k Total cash low at timeT 1 k 1 k inf 36 Variance-covariance method Approximate the multi-lognormal distribution with multi-normal distribution Closed form solutions available A huge saving on computing power ( ) ( ) Stock of high quality liquid assets Σ Σ ⋅ + − × − = × − + ⋅ = = Σ ( ) Σ ( ) ⋅ + − × − ≈ × − + ⋅ = = N k I k I k I k k M k O k O k O k k N k I k I k I k k M k O k O k O k k T Normal T T Normal I T O T Normal T T Normal I T O 1 , , 2 , 0, 1 , , 2 , 0, 1 , , 2 , 0, 1 , , 2 , 0, 0,1 2 0,1 1 2 1 0,1 2 0,1 exp 2 exp σ σ σ σ σ σ σ σ