This document discusses regulatory liquidity measures and stochastic liquidity risk measures. It begins with an outline and background on the Basel Committee's work on liquidity risk. It then describes the regulatory liquidity measures of the Liquidity Coverage Ratio and Net Stable Funding Ratio, including details on their calculation methodology. The document also presents approaches to model total cash inflows and outflows stochastically and defines measures of liquidity risk using Monte Carlo simulation. It concludes by discussing potential extensions of the modeling framework.
Liquidity Risk is normally a crucial issue in a banking crisis, however, during the 2007-2010 period, Liquidity has not been as difficult for us as we may have thought. There are many reasons for this, but number one is the fact that today’s community bankers simply have a better understanding of the various techniques for raising both retail deposits and wholesale funds. What does make this crisis a bit different is the relative pricing efficiencies in the wholesale or non-core funding arena these days and our session will focus on how bankers can avoid those difficult examiner discussions about the use of FHLB Advances and Brokered Deposits. It’s all about process and we will provide guidance on what needs to be in your ALCO Policy as it relates to wholesale funding. We will also explore the April 2010 Liquidity and Funds Management Guidance to ensure your bank is up to speed on those requirements. Finally, we will provide specific guidance on both Ratio Analysis and creating your Contingency Funding Plan and will review a sample CFP.
Strategic Intraday Liquidity Monitoring Solution for Banks: Looking Beyond Re...Cognizant
Managing intraday liquidity monitoring is an essential task for banks facing potential shortfalls in cash flow due to highly complex collaborations with other institutions and clients. To go beyond mere compliance with regulatory strictures, we offer a path toward an intraday liquidity platform based on integrated, real-time data.
Assessing a bank’s culture is not an easy task, but there clearly is an increased emphasis on culture that is part of the regulators' broader focus on “heightened standards.” Learn what it takes to have a strong credit culture. Read about these 10 credit culture factors to assess your institution's credit culture.
This presentation serves as study notes for the e-learning material titled: "South African Hedge funds and international developments"
These notes focus on Dodd Frank and its Impact on the Hedge Fund Industry.
http://www.hedgefund-sa.co.za/dodd-frank
Liquidity Risk Management: Comparative analysis on Indian and ASEAN bankspeterkapanee
Risk in the banking sector in simple terms means unpredictability, these risks are uncertainties which may result in adverse outcome in relation to planned objective or expectations of the financial institutions. In the financial world, risk can be defined as “any event or possibility of an event which can impair corporate earnings or cash flow over short, medium or long-term horizon” .
A bank�s balance sheet information is shown below (in $000). On Bala.pdfalfaknr
A banks balance sheet information is shown below (in $000). On Balance Sheet Items Face
Value Cash $121,600 Short-term government securities (<92 days.) 5,400 Long-term
government securities (>92 days) 414,400 Federal Reserve stock 9,800 Repos secured by federal
agencies 169,000 Claims on U.S. depository institutions 937,900 Loans to foreign banks, OECD
CRC rated 2 1,640,000 General obligations municipals 170,000 Claims on or guaranteed by
federal agencies 26,500 Municipal revenue bonds 102,900 Residential mortgages, category 1,
loan-to-value ratio 75% 5,000,000 Commercial loans 4,667,669 Loans to sovereigns, OECD
CRC rated 3. 11,600 Premises and equipment 455,000 Conversion Face Off Balance Sheet
Items: Factor Value U.S. Government Counterparty: Loan commitments: < 1 year 20% $300 1-5
year 50% 1,140 Standby letters of credit: Performance-related 50% 200 Direct-credit substitute
100% 100 U.S. Depository Institutions Counterparty: Loan commitments: < 1 year. 20% 100 > 1
year 50% 3,100 Standby letters of credit: Performance-related 50% 200 Direct-credit substitute
100% 56,400 Commercial letters of credit: 20% 400 State and Local Government Counterparty:
(revenue municipals) Loan commitments: >1 year 50% 100 2 Copyright 2020 McGraw-Hill
Education. All rights reserved. No reproduction or distribution without the prior written consent
of McGraw-Hill Education. Standby letters of credit: Performance-related 50% 135,400
Corporate Customer Counterparty: Loan commitments: < 1 year 20% 3,212,300 >1 year 50%
3,046,278 Standby letters of credit: Performance-related 50% 101,543 Direct-credit substitute
100% 490,900 Commercial letters of credit: 20% 78,978 Sovereign Counterparty: Loan
commitments, OECD CRC rated 1: < 1 year 20% 110,500 >1 year 50% 1,225,400 Sovereign
Counterparty: Loan commitments, OECD CRC rated 2: < 1 year 20% 85,000 >1 year 50%
115,500 Sovereign Counterparty: Loan commitments, OECD CRC rated 7: >1 year. 50% 30,000
Interest rate market contracts: (current exposure assumed to be zero.) < 1 year (notional amount)
0% 2,000 > 1-5 year (notional amount) 0.5% 5,000 1. What is the bank's risk-adjusted asset base
under Basel III? Find the appropriate risk-weight for the off-balance sheet items using Table 21-
7 (for the risk weights, you use Table 21-7 for BOTH on- and off-balance sheet items). Hint: For
OBS market contracts, the appropriate risk-weight is 1 or 100%. 2. To be adequately capitalized,
what are the bank's CET1, Tier I, and total risk-based capital requirements under Basel III? Hint:
Refer to Table 21-3. 3. Using the leverage ratio requirement, what is the minimum regulatory
capital required to keep the bank in the adequately-capitalized zone? Hint: Refer to Table 21-3. 3
. No reproduction or distribution without the prior written consent of McGraw-Hill Education. 4.
Disregarding the capital conservation buffer, what is the bank's capital adequacy level (under
Basel III) if the par value of its equity is $215,000, surplus value of e.
Week-9 Bank RegulationMoney and Banking Econ 311Tuesdays 7 .docxalanfhall8953
Week-9 Bank Regulation
Money and Banking Econ 311
Tuesdays 7 - 9:45
Instructor: Thomas L. Thomas
Capital Adequacy Management
Bank capital helps prevent bank failure
The amount of capital affects return for the owners (equity holders) of the bank
Regulatory requirement – Regulatory Capital – Tier 1 and Tier 2 Basle Rules
Economic Capital - What is this
2
Capital Adequacy Management:
Returns to Equity Holders
3
Traditional Economic Capital Value-At-Risk (VaR) View
Frequency of Occurrence / Probability
Mean/Average Expected Losses (m)
Unexpected Losses @ 99.9% confidence Level (s)
Economic Capital
Reserves
Value-at-Risk
VAR
Before we can develop adequate credit stress testing we need to understand the differences between traditional credit loss measures and what stress tests incorporate.
Aside form standard concentration and coverage analysis, a standard portfolio credit risk analysis typically employs a Value-at-Risk view.
Credit risk in this view generally follows a positive skewed distribution (by definition one cannot have negative defaults and thus a normal distribution is not applicable).
Reserves ALLL generally cover average expected losses over a horizon. In reality these are usually allocated to general reserves since most ALLL have two components: general reserves and specific reserves for known credits that are detraining.
Economic capital functions as a cushion against unexpected loss up to some confidence level. In this case 99.9% or a single “A” rating is the regulatory standard (once every 10,000 years)
In addition to a loss cushion economic capital represents the amount of the firm’s equity that is at risk which requires a return sufficient to cover the associated risk.
The shape of the curve or tail will then reflect the underlying credit risk of the portfolio or product.
However this view has some assumptions that can miss important risk elements.
The distribution is generally based on one variable PD in this case and does necessarily fully account for other correlated factors that when combined either change the tail or increase the likelihood of default.
Second, while the event may be rare, this methodology does not tell how severe or the magnitude of the event when it occurs beyond the confidence level prescribed for economic capital.
4
Old Measure: New Ones
RAROC - Risk Adjusted Return on Capital
EVA - Economic Value Added.
Hurdle Rate – What is it. How is it measured?
5
Time Line of the Early History of Commercial Banking in the United States
6
Historical Development of the Banking System
Bank of North America chartered in 1782
Controversy over the chartering of banks.
National Bank Act of 1863 creates a new banking system of federally chartered banks
Office of the Comptroller of the Currency
Dual banking system
Federal Reserve System is created in 1913.
7
Asymmetric Information and Financial.
In 1984, in 1990 and in 2005 Congress passed laws exempting certain financial contracts from the standard provisions of the bankruptcy code. In each case, the effect of the law was to protect collateral securing the contract from those provisions of the bankruptcy code that allow a judge to review the claims of secured creditors and to protect the interests of other creditors whenever necessary.
The introduction of inequitable treatment into the bankruptcy code would be acceptable, if in fact the financial contract exemptions worked to protect the stability of the financial system. Recent experience indicates, however, that the special treatment granted to repurchase agreements and over the counter derivatives tends to reduce the stability of the financial system by encouraging collateralized interbank lending and discouraging careful analysis of the credit risk of counterparties. The bankruptcy exemptions also increase the risk that creditors will run on a financial firm and bankrupt it. Thus, the bankruptcy code has been rewritten to favor financial firms and this revision of the law has had a profoundly destabilizing effect on the financial system.
Mandatory Centralised Clearing - Creating a liquidity crisis?John Wilson
Co-presentation with Nicole Grootveld [Cardano] on the liquidity issues presented by the introduction of mandatory clearing for OTC derivatives. Includes commentary on the buy-side and some potential solutions to the issues created.
2. regulatory liquidity measures and stochastic liquidity risk measures
1. Regulatory Liquidity Measures and
Stochastic Liquidity Risk Measures
1
By Fai Y. LAM
E-mail: faiylam@gmail.com
11 am to 12 noon, Tuesday 13 April 2010
Room R503, Hong Kong Polytechnic University
2
Outline
Background
Regulatory liquidity measures
Liquidity risk measures
3
Part I
Regulatory Liquidity
Measures
4
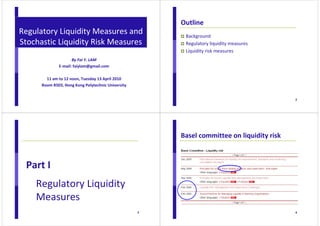
Basel committee on liquidity risk
2. 5
What happened during the period?
Basel new capital accord (Basel II)
Kicked off in January 2001
Finalized in May 2006
Glass–Steagall Act repealed on November 12, 1999
Commercial banks in US participated in investment banking activities
Paper On Default Correlation: A Copula Function Approach” by Dr. David X. LI’s, RiskMetrics
Group published in 2000
Acceleration of the CDO market
CDS market grew to US$ 45 tn notional in 2007
Subprime mortgage market grew to US$ 1.3 tn in 2007
Financial tsunami emerged in 2007
Basel Committee issued guideline “Principles for Sound Liquidity Risk Management and
Supervision” in Sep 2008
Basel Committee issued consultative paper “International framework for liquidity risk
measurement, standards and monitoring “ in Dec 2009
6
Regulatory liquidity
Standards
Liquidity coverage ratio
Net stable funding ratio
Monitoring tools
Contractual maturity mismatch
Concentration of funding
Available unencumbered assets
Market-related monitoring tools
Stock of high quality liquid assets
≥
≥ −
Stock of high quality liquid assets Cash outflows over a day time period
7
Liquidity coverage ratio
To ensure existing liquidity can support the cash
flows over a 30-day period under an acute liquidity
stress scenario
30
Cash lows over a day time period
Net cash outflows over a day time period
inf 30
100%
30
− −
−
8
High quality liquid assets
Fundamental characteristics
Low credit and market risks
Ease and certainty of valuation
Low correlation with risky assets
Listed on a developed and recognised exchange market
Market-related characteristics
Active and sizable market
Presence of committed market makers
Low market concentration
Flight to quality
3. 9
High quality liquid assets
Cash (100%)
Qualifying central bank receivables (100%)
Domestic sovereign or central bank debt in domestic currency (100%)
Qualifying marketable securities from sovereigns, central banks, public
sector entities, and multi-lateral development banks (100%)
Qualifying corporate bonds and covered bonds rated AA to AAA (80%)
Qualifying corporate bonds and covered bonds rated A- to AA- (60%)
10
Cash inflows
Amounts receivable from retail counterparties (100% of
planned inflows from performing assets)
Amounts receivable from wholesale counterparties (100% of
planned inflows from performing wholesale customers)
Receivables in respect of repo and reverse repo transactions
backed by illiquid assets and securities lending/borrowing
transactions where illiquid assets are borrowed (100%)
Other cash inflows, including planned contractual receivables
from derivatives
11
Cash outflows (1)
Retail deposits
Stable deposits (minimum 7.5%)
Less stable retail deposits (minimum 15%)
Unsecured wholesale funding
Stable, small business customers (minimum 7.5%)
Less stable, small business customers (minimum 15%)
Non-financial corporates, sovereigns, central banks and public sector entities with
operational relationships (25% of deposits needed for operational purposes)
Non-financial corporates, no operational relationship (75%)
Other legal entity customers and sovereigns, central banks, and PSEs without
operational relationships (100%)
Secured funding
Funding from repo of illiquid assets and securities lending/borrowing transactions
illiquid assets are lent out (100%)
12
Cash outflows (2)
Additional requirements
Liabilities related to derivative collateral calls related to a downgrade of up to
3-notches (100% of collateral that would be required to cover the contracts in
case of up to a 3-notch downgrade)
Market valuation changes on derivatives transactions (amount to be
nationally determined)
Valuation changes on posted noncash or non-high quality sovereign debt
collateral securing derivative transactions (20%)
ABCP, SIVs, Conduits, etc:
Liabilities from maturing ABCP, SIVs, SPVs, etc (100% of maturing amounts
and 100% of returnable assets)
Term Asset Backed Securities (including covered bonds) (100% of maturing
amounts)
4. 13
Cash outflows (3)
Currently undrawn portion of committed credit and liquidity facilities to:
Retail clients (10% of outstanding lines)
Non-financial corporates, credit facilities (10% of outstanding lines)
Non-financial corporates, liquidity facilities (100% of outstanding lines)
Other legal entity customers (100% of outstanding lines)
Other contingent funding liabilities (such as guarantees, letters of credit, revocable
credit and liquidity facilities, etc.) (to be determined by supervisors, specific to
needs at certain banks)
Planned outflows related to renewal or extension of new loans (retail or
wholesale) (100%)
Any other cash outflows (including planned derivative payables)
14
Net stable funding ratio
A minimum acceptable amount of stable funding
based on the liquidity characteristics of an
institution’s assets and activities over a one year
horizon
Availableamount of stable funding
quired amount of stable funding
100%
≥
Availableamount of stable funding Re
quired amount of stable funding
Re
≥
15
Available amount of stable funding
Capital
Preferred stock with maturity of equal to or greater than one
year
Liabilities with effective maturities of one year or greater
The portion of “stable” non-maturity deposits and/or term
deposits with maturities of less than one year that would be
expected to stay with the institution for an extended period
in an idiosyncratic stress event
16
Required amount of stable funding
The value of assets held and funded by the
institution, multiplied by a specific required stable
funding factor assigned to each particular asset type
The amount of off-balance sheet activity (or
potential liquidity exposure) multiplied by its
associated required stable funding factor
5. 17
Required stable funding (RSF) factor
The RSF factors assigned to various types of assets are parameters
intended to approximate the amount of a particular asset that could not
be monetised through sale or use as collateral in a secured borrowing on
an extended basis during a liquidity event lasting one year
The RSF factor applied to the reported values of each asset or off-balance
sheet exposure is the amount of that item that supervisors believe should
be supported with stable funding
Assets that are more liquid and more readily available to act as a source of
extended liquidity in the stressed environment identified above receive
lower RSF factors (and require less stable funding) than assets considered
less liquid in such circumstances and, therefore, require more stable
funding
18
Regulatory effort (1)
A big step from the Basel Committee guideline
“Principles for Sound Liquidity Risk Management and
Supervision” (Sep 2008)
Formally define regulatory liquidity in a consistent
and a measurable framework
Relatively easy to calculate
Deterministic, snapshot, rating factor approach
19
Regulatory effort (2)
Recognition of government related entities as the
top funding sources
Appreciation of high quality covered bonds
Regulatory liquidity economic liquidity
Limited details on derivatives
20
Regulatory effort (3)
HKMA Viewpoint article 11 June 2009
http://www.info.gov.hk/hkma/eng/viewpt/
20090611e.htm
*Source : Reorganisation of Banking
Departments in April 2010, HKMA
6. 21
Potential impacts to banking industry
Competition on high quality assets
= high cost of liquidity
Downward pressure on BBB rated corporate bonds and
covered bonds
Merge and acquisition of financial institutions
Political bias on funding to “too large to fail”
Acceleration of coverage to life insurance businesses
Stable and diversified funding from insurance premium
Mortality risk uncorrelated with credit market
More supervisory reporting, reviews and examinations
22
A simple question
What is my bank’s funding liquidity risk?
23
Outstanding questions
1. How to set funding liquidity risk limits?
2. Is the funding liquidity risk increasing or decreasing during
the last 12 months?
3. Which branch contributes the most funding liquidity risk?
4. How to diversify the funding sources?
5. How to perform funding liquidity stress testing?
6. What will be the potential loss in the next funding liquidity
crisis?
7. How to plan for contingency funding?
8. How to incorporate funding liquidity risk into cost?
24
Part II
Liquidity Risk
Measures
7. 25
Modelling total cash inflow
Probability
Amount
Expected total
cash inflow
Total cash inflow
Calculated according to regulatory liquidity requirements
Greater than or equal to 0
Asymmetric
Long right tail
26
Modelling total cash inflow
Lognormal total cash inflow model
= +
μ σ
dI Idt IdW
= − + ⋅
I I T T Normal
= × − + ⋅
0 : Total contractual cash inflow
I
T : Total cash inflow with cash management incorporated
I
μI
: Drift of total cash inflow
σI
: Volatility of total cash inflow
( )
[ ] (0,1)
2
exp
) 0,1
2
exp (
2
2
0
I I I
I
T
I I I
I
T I
I
T Normal
T
E I
σ
σ
σ
σ
μ
27
Modelling total cash outflow
Probability
Amount
Expected total
cash outflow
Total cash outflow
Calculated according to regulatory liquidity requirements
Greater than or equal to 0
Asymmetric
Long right tail
28
Modelling total cash outflow
Lognormal total cash inflow model
2
= +
μ σ
dO Odt OdW
= − + ⋅
O O T T Normal
= × − + ⋅
0 : Total contractual cash outflow
O
T : Total cash outflow with cash management incorporated
O
μO : Drift of total cash outflow
σO : Volatility of total cash outflow
( )
[ ] (0,1)
2
exp
) 0,1
2
exp (
2
0
O O
O
T
O O
O
T O
O
T Normal
T
E O
σ
σ
σ
σ
μ
8. 29
Regulatory liquidity surplus
gulatory liquidity surplus
Stock of high quality liquid assets
Total cash low next
inf month
Re
Total cash outflow next
=
+
−
A random variable subject to
month
Expected total cash inflow and expected total cash outflow
Volatilities of total cash inflow and total cash outflow
Correlation between total cash inflow and total cash outflow
30
Regulatory liquidity surplus
A random variable following a multi-lognormal
distribution
No closed form solutions
To be realized easily with Monte Carlo simulation
gulatory liquidity surplus
Stock of high quality liquid assets
[ ] ( ) [ ] ( )
+ × − + ⋅
Correlation[ (0,1), (0,1)]
0,1
× − + ⋅
2
0,1 - exp
2
exp
Re
2 2
I O
O O
O
I I T
I
T
Normal Normal
T Normal
T
T Normal E O
T
E I
=
=
ρ
σ
σ
σ
σ
31
Liquidity risk measures
Probability of regulatory liquidity shortage
What is the chance of having net cash outflow not covered
by current stock of high quality liquidity assets?
obability of regulatory liquidity shortage
[ ] Re 0 1
Pr
= gulatory liquidity surplus E
Regulatory liquidity surplus at 99.9% of confidence
level (once every 1,000 months)
Will there be any regulatory liquidity
shortage under extreme conditions?
32
Monte Carlo simulation in Excel
9. 33
Regulatory liquidity shortage
34
Findings of common sense
Regulatory liquidity 0
== probability of regulatory liquidity shortage = 0
$1 mn high quality liquid assets $1 mn planned
cash inflow
$1 mn planned cash inflow $1 mn planned cash
outflow
Two small funding sources are better than one large
funding source
Two small lending customers are better than one
large lending customer
35
Applications of liquidity risk measures
Trend analysis
What is the change of liquidity risk during last year?
Peer analysis
Which branch is the outlier?
Which branch contributes the most liquidity risk?
Liquidity risk limit
Positive regulatory liquidity surplus at 99.9% confidence level
Diversification analysis
What is the benefit of adding more funding sources?
Scenario analysis
How much more regulatory liquidity is required if a new branch is opened in
Shanghai?
Stress testing
Manipulation of expected cash inflow level, cash outflow level, volatilities and
correlation
36
Further extensions
Internal definition of liquidity and cash flows
Total cash inflow and total cash outflow broken
down by business line, funding source and customer
base
gulatory liquidity surplus
Stock of high quality liquid assets
M
Σ
=
k
Σ
=
=
+
−
N
k
Total cash low next
inf month
Total cash outflow next
1
k
1
k
month
Re
10.
37
Variance-covariance method
Approximate the multi-lognormal distribution with
multi-normal distribution
Closed form solutions available
A huge saving on computing power
gulatory liquidity surplus
Stock of high quality liquid assets
[ ] ( ) [ ] ( )
Σ Σ
⋅ + − × −
+ × − + ⋅
= =
Stock of high quality liquid assets
Σ [ ] ( ) Σ [ ] ( )
⋅ + − × −
+ × − + ⋅
= =
≈
=
N
k
O k O k
O k
T k
M
k
I k I k
I k
T k
N
k
O k O k
O k
T k
M
k
I k I k
I k
T k
T Normal
T
T Normal E O
T
E I
T Normal
T
T Normal E O
T
E I
1
, ,
2
,
,
1
, ,
2
,
,
1
, ,
2
,
,
1
, ,
2
,
,
0,1
2
0,1 1
2
1
0,1
2
0,1 exp
2
exp
Re
σ
σ
σ
σ
σ
σ
σ
σ
38
Your opinions
To download paper and simulation model
http://sites.google.com/site/quanrisk