Download to read offline
![PRESENTED BY:
PRASHANT GUPTA [201511005010080]
FACULTY MEMBER:
Er RAJ DEEPAK SIR](https://image.slidesharecdn.com/barchartcmt-191228153906/85/Bar-chart-1-320.jpg)
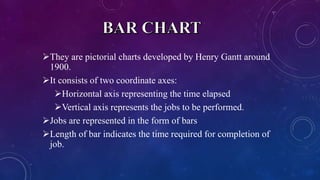
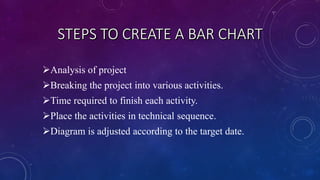
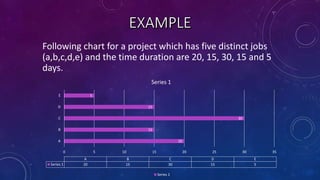
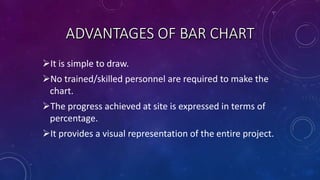


This document discusses Gantt charts, which are bar charts developed in the early 1900s to illustrate a project schedule. A Gantt chart uses two axes - horizontal for time and vertical for tasks. Tasks are represented as bars whose length indicates the time to complete that task. The document provides an example Gantt chart for a project with 5 tasks ranging from 5 to 30 days. It notes advantages like ease of creation and visual representation, but also limitations like lack of facilitating project control, monitoring, and updating for large projects.


