- Atomic absorption spectroscopy (AA) is a technique used to determine the concentration of metals in solutions. It works by vaporizing the metal analyte and measuring its absorption of light at characteristic wavelengths.
- The sample is nebulized and introduced into a flame or graphite furnace. A light source matches the metal and is passed through the vapor. Absorption is measured with a detector.
- Calibration curves of known standards are used to determine concentrations of unknown samples based on their absorbance readings. AA is sensitive in the parts-per-million range and requires only a small sample volume.

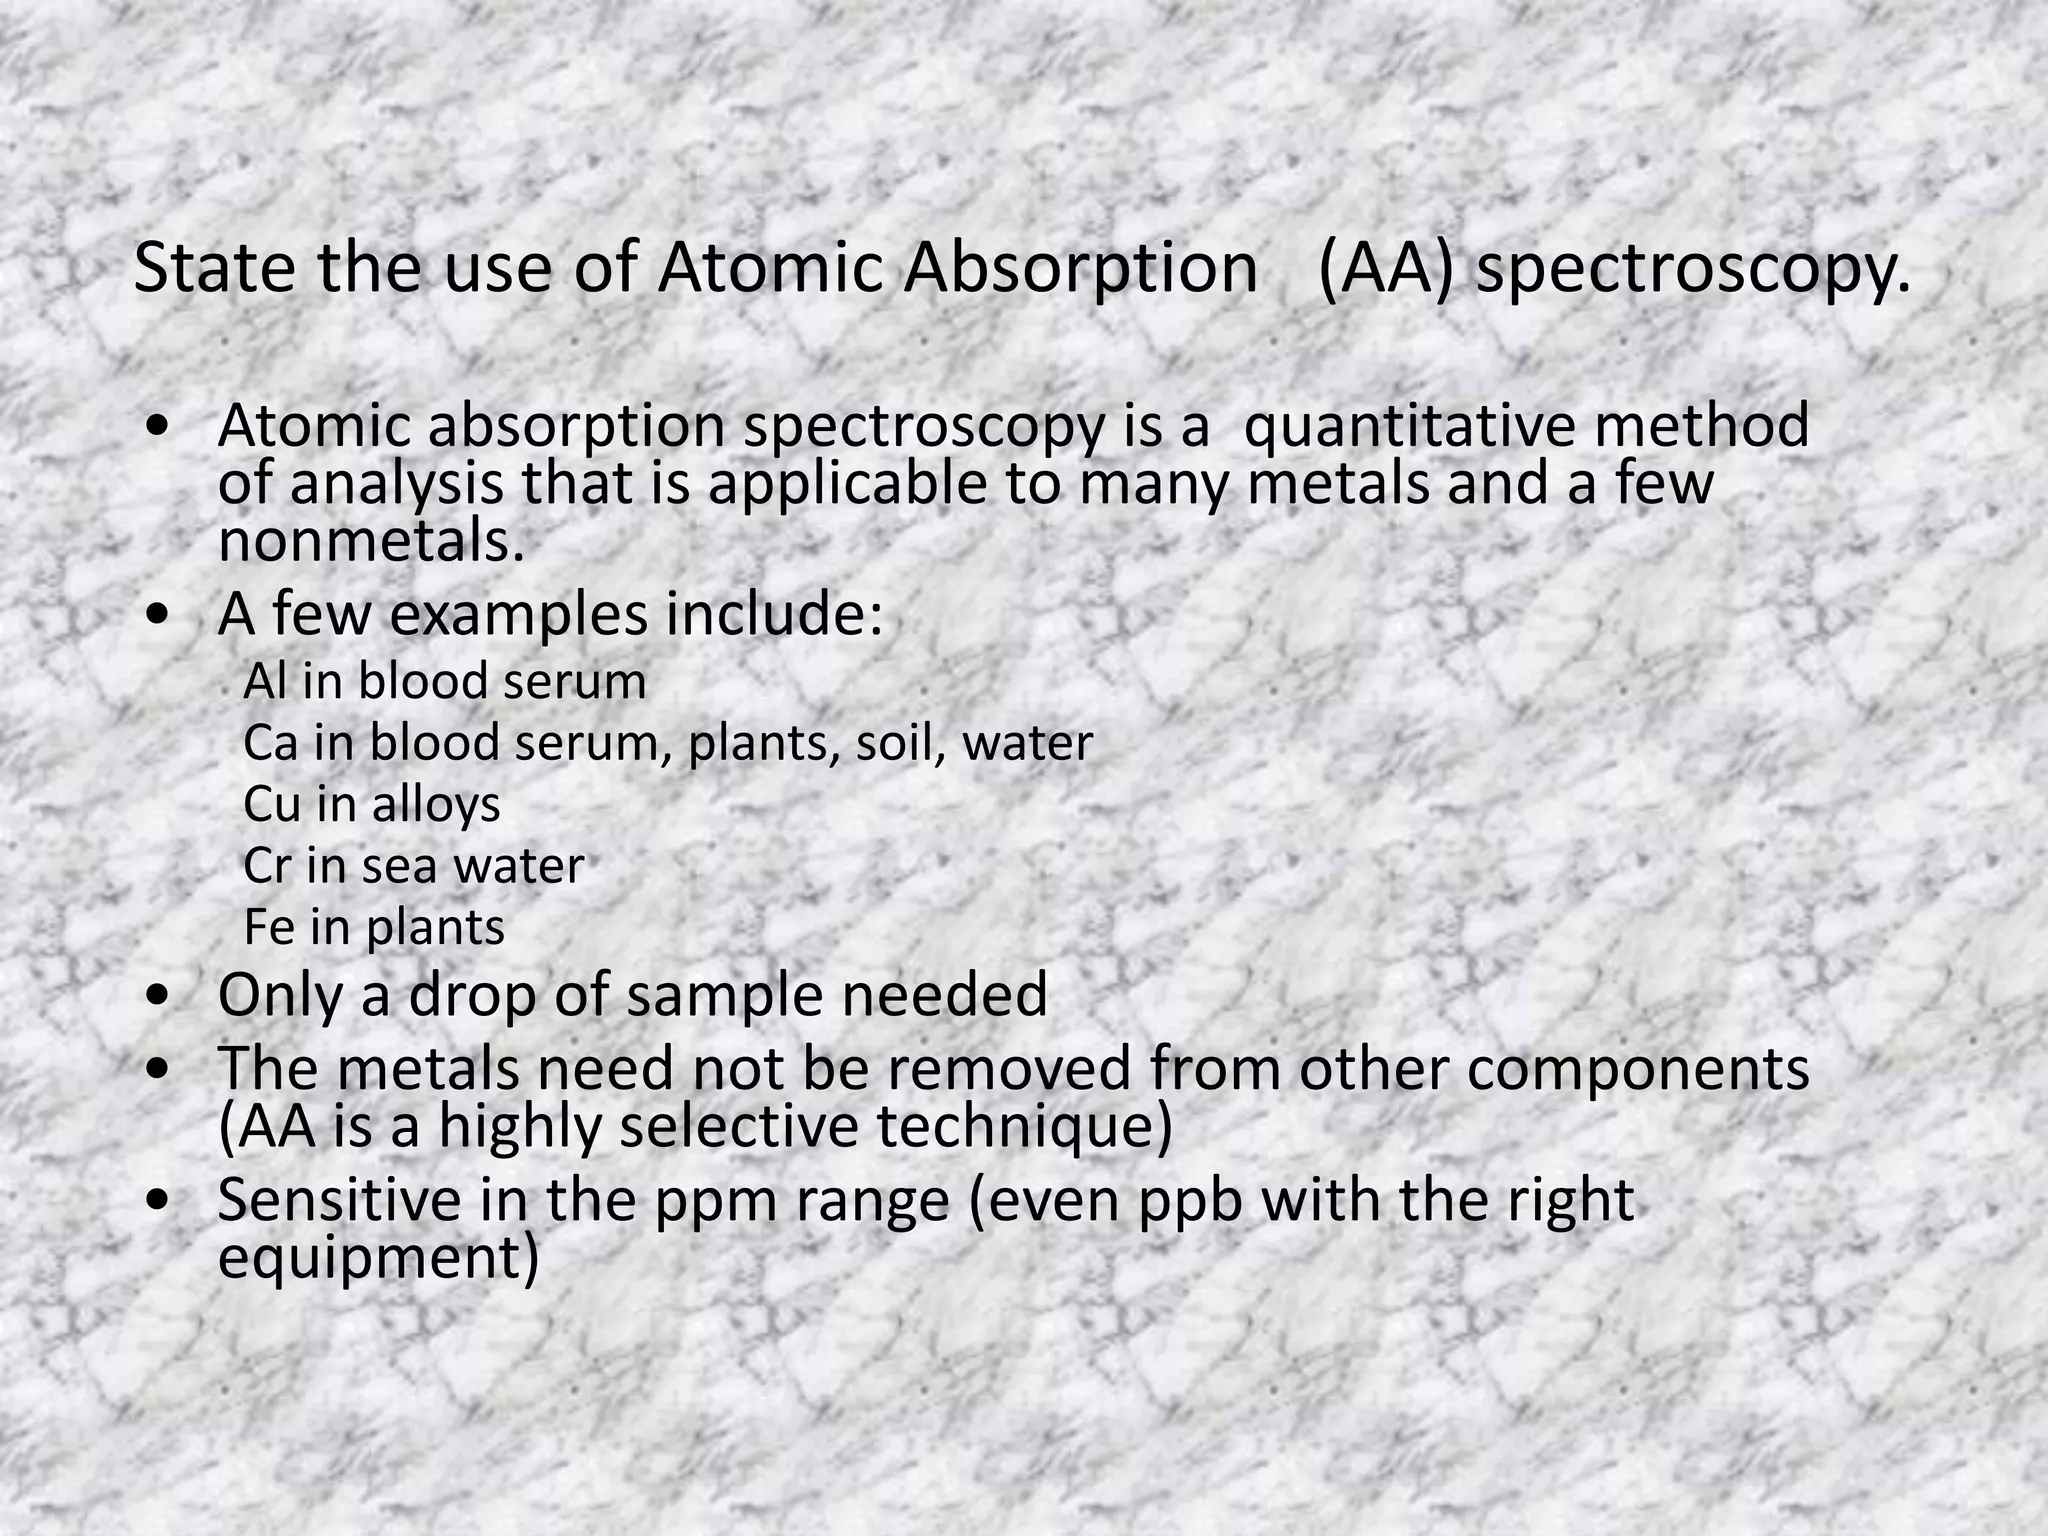
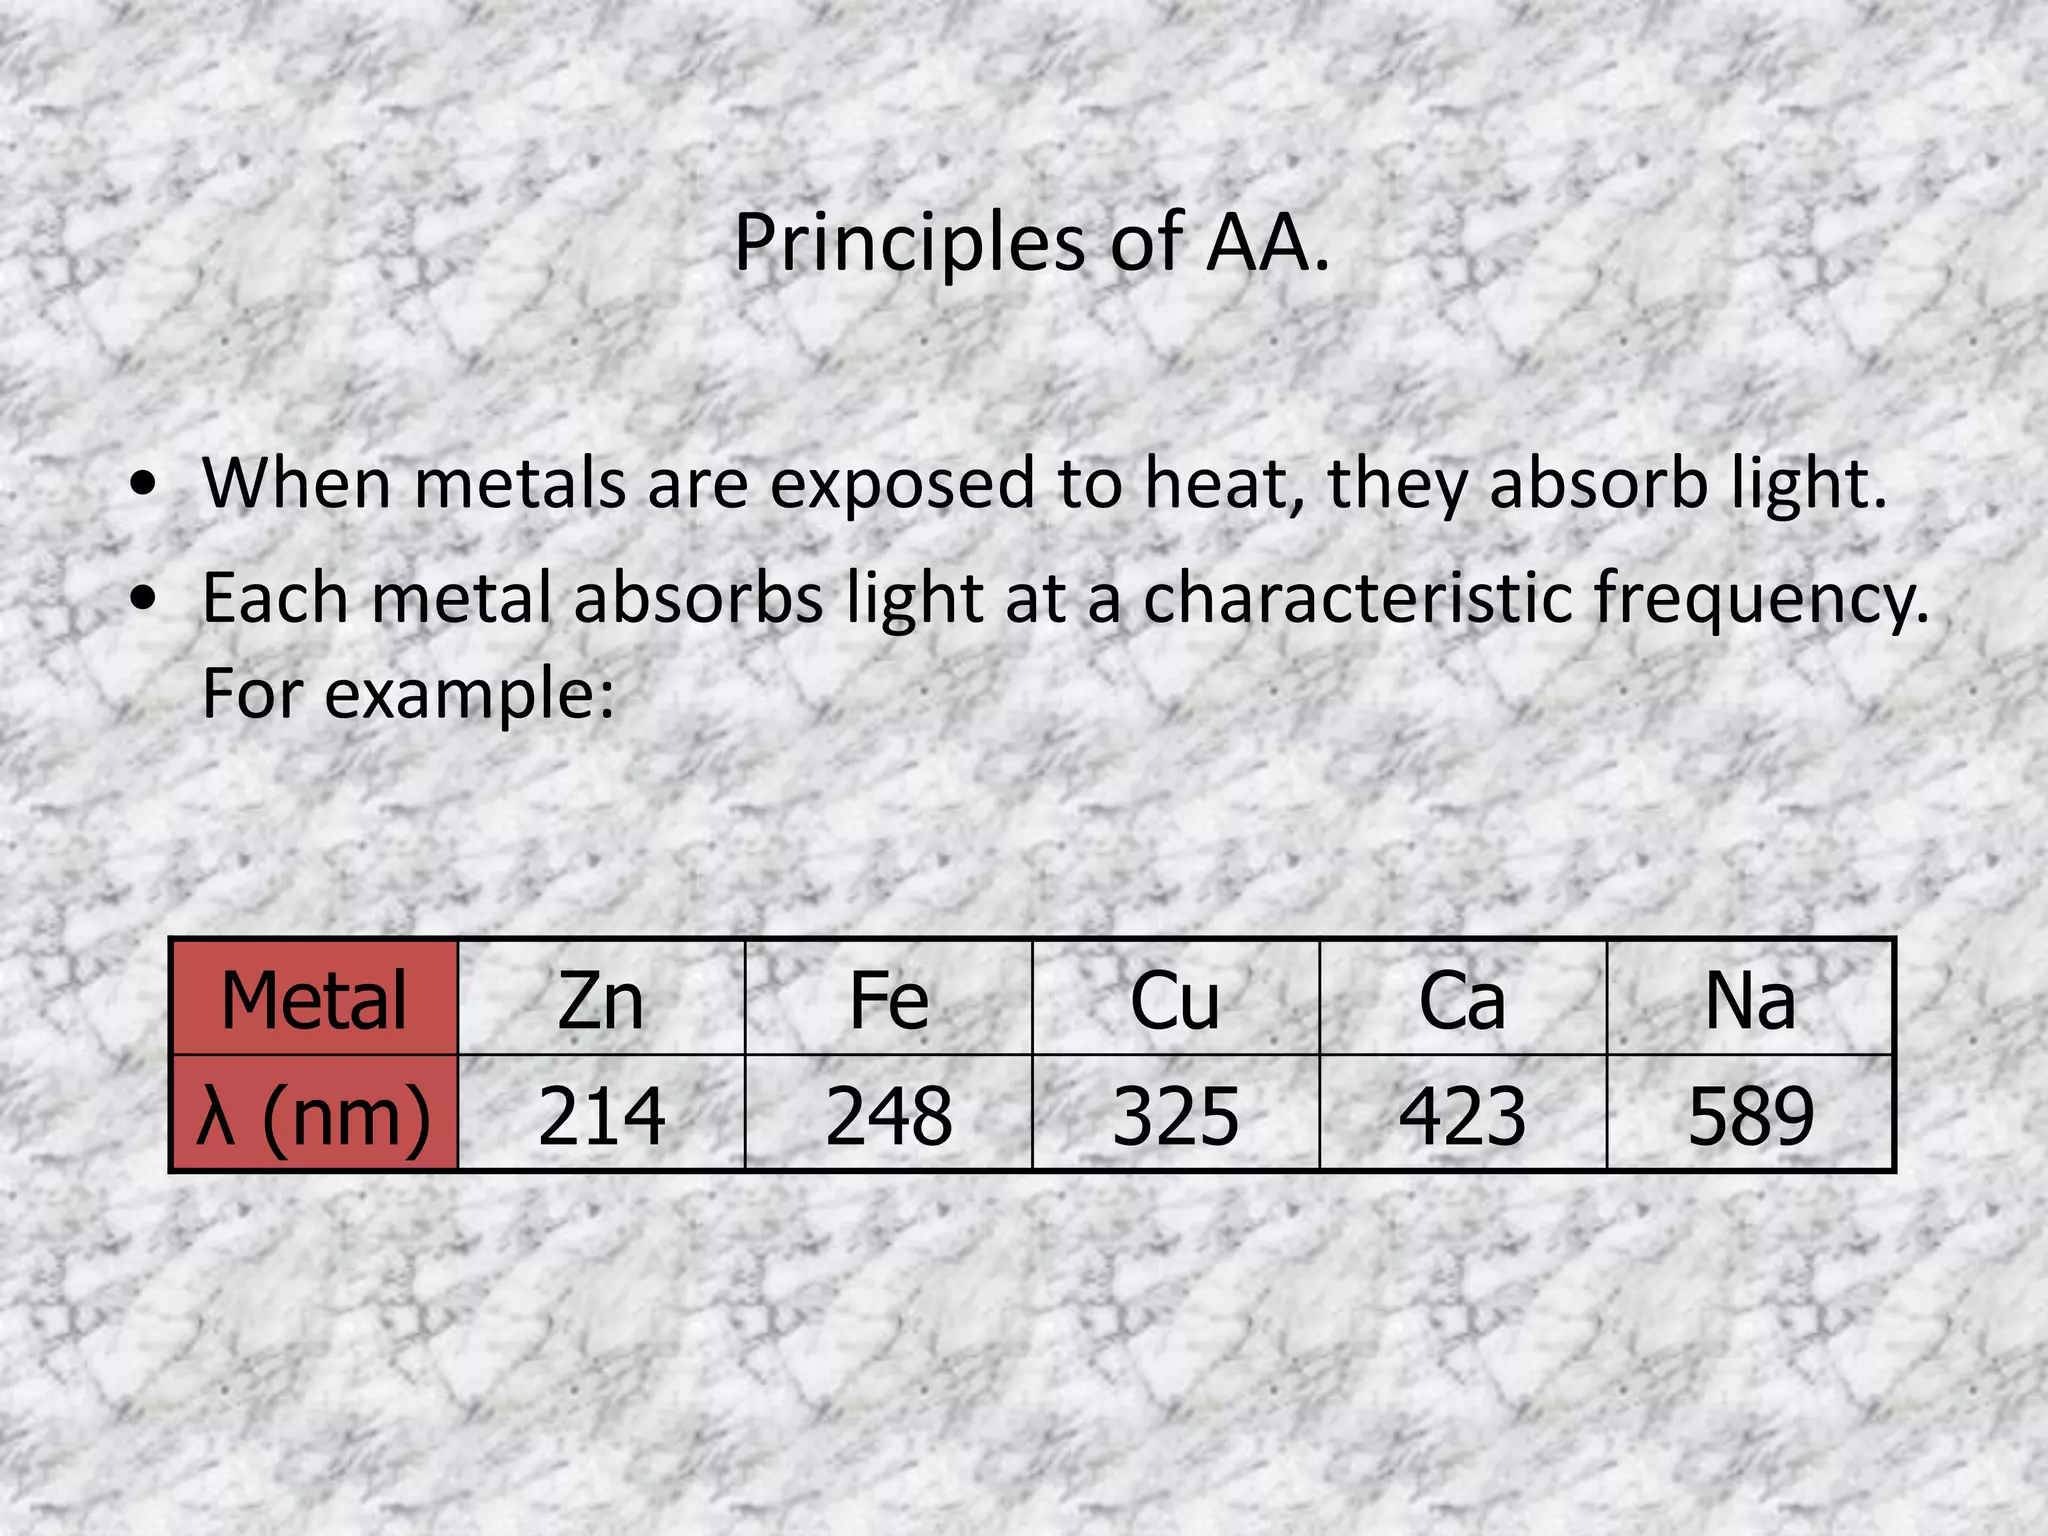
![Describe the principles of AA.
• The metal vapor absorbs energy from an external
light source, and electrons jump from the ground to
the excited states
• The ratio of the transmitted to incident light energy
is directly proportional to the concentration of
metal atoms present
• A calibration curve can thus be constructed
[Concentration (ppm) vs. Absorbance]](https://image.slidesharecdn.com/atomicabsorptionspectroscopy-201121142612/75/Atomic-absorption-spectroscopy-4-2048.jpg)


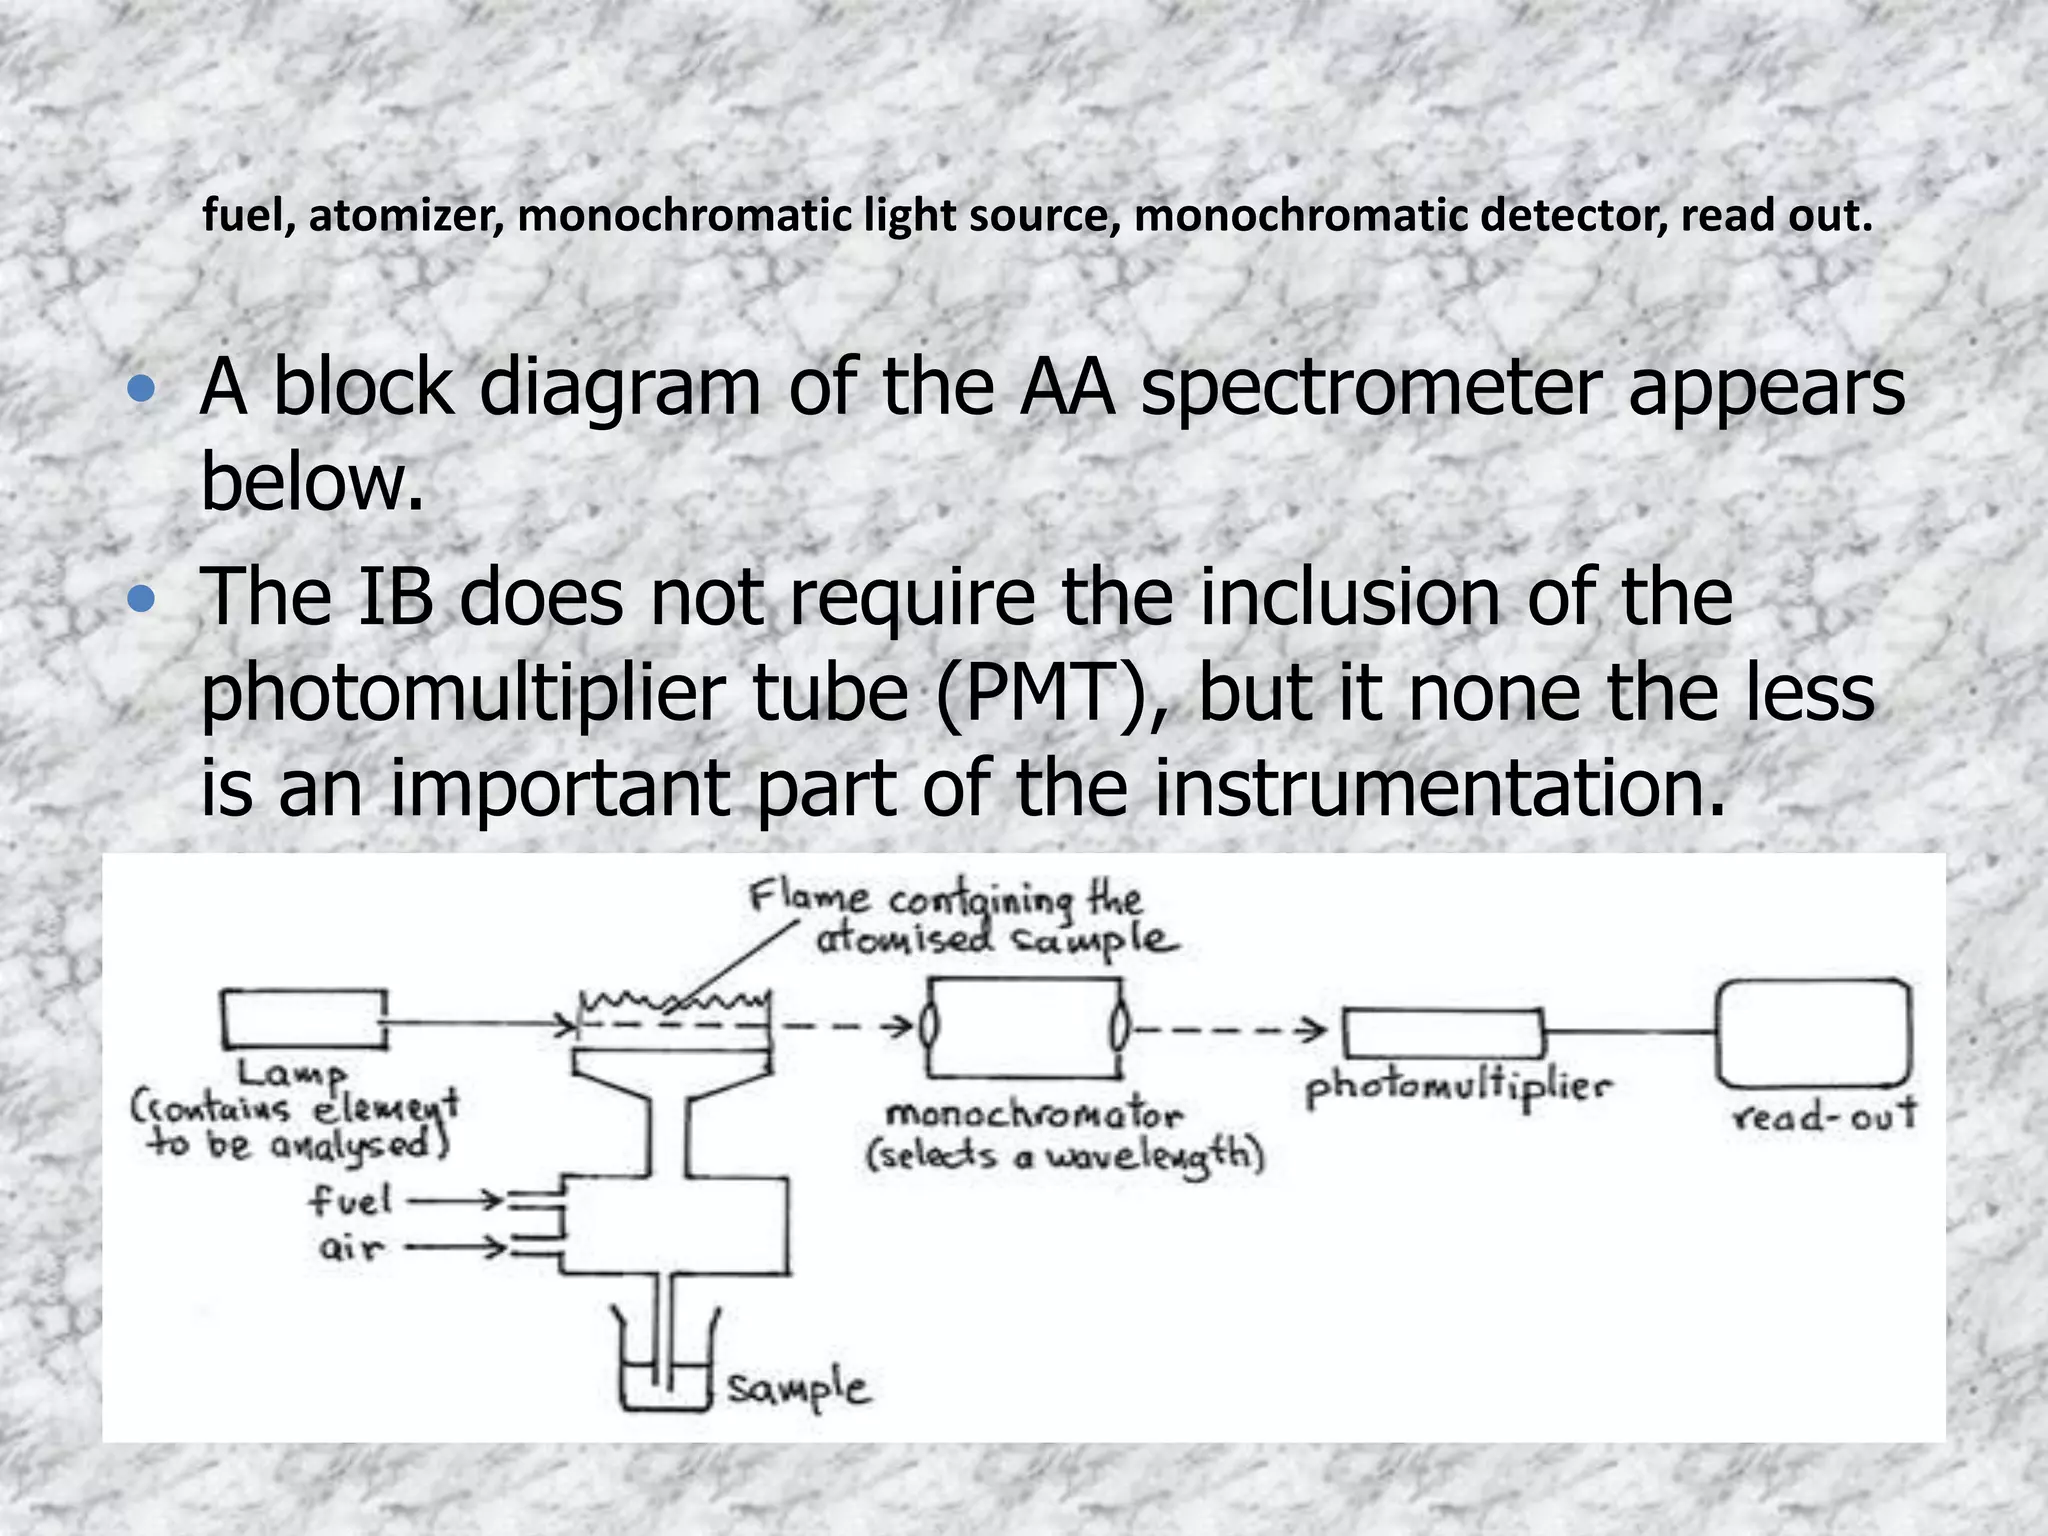


![fuel
• The sample is made up, typically in water
• A flame is created, usually using ethyne & oxygen
(fuel)
• The flame gases flowing into the burner create a
suction that pulls the liquid into the small tube from
the sample container. This liquid is transferred to the
flame where the sample is atomized [mixing the
sample with air to create fine droplets]. The metal
atoms then absorb light from the source (cathode
lamp).](https://image.slidesharecdn.com/atomicabsorptionspectroscopy-201121142612/75/Atomic-absorption-spectroscopy-12-2048.jpg)


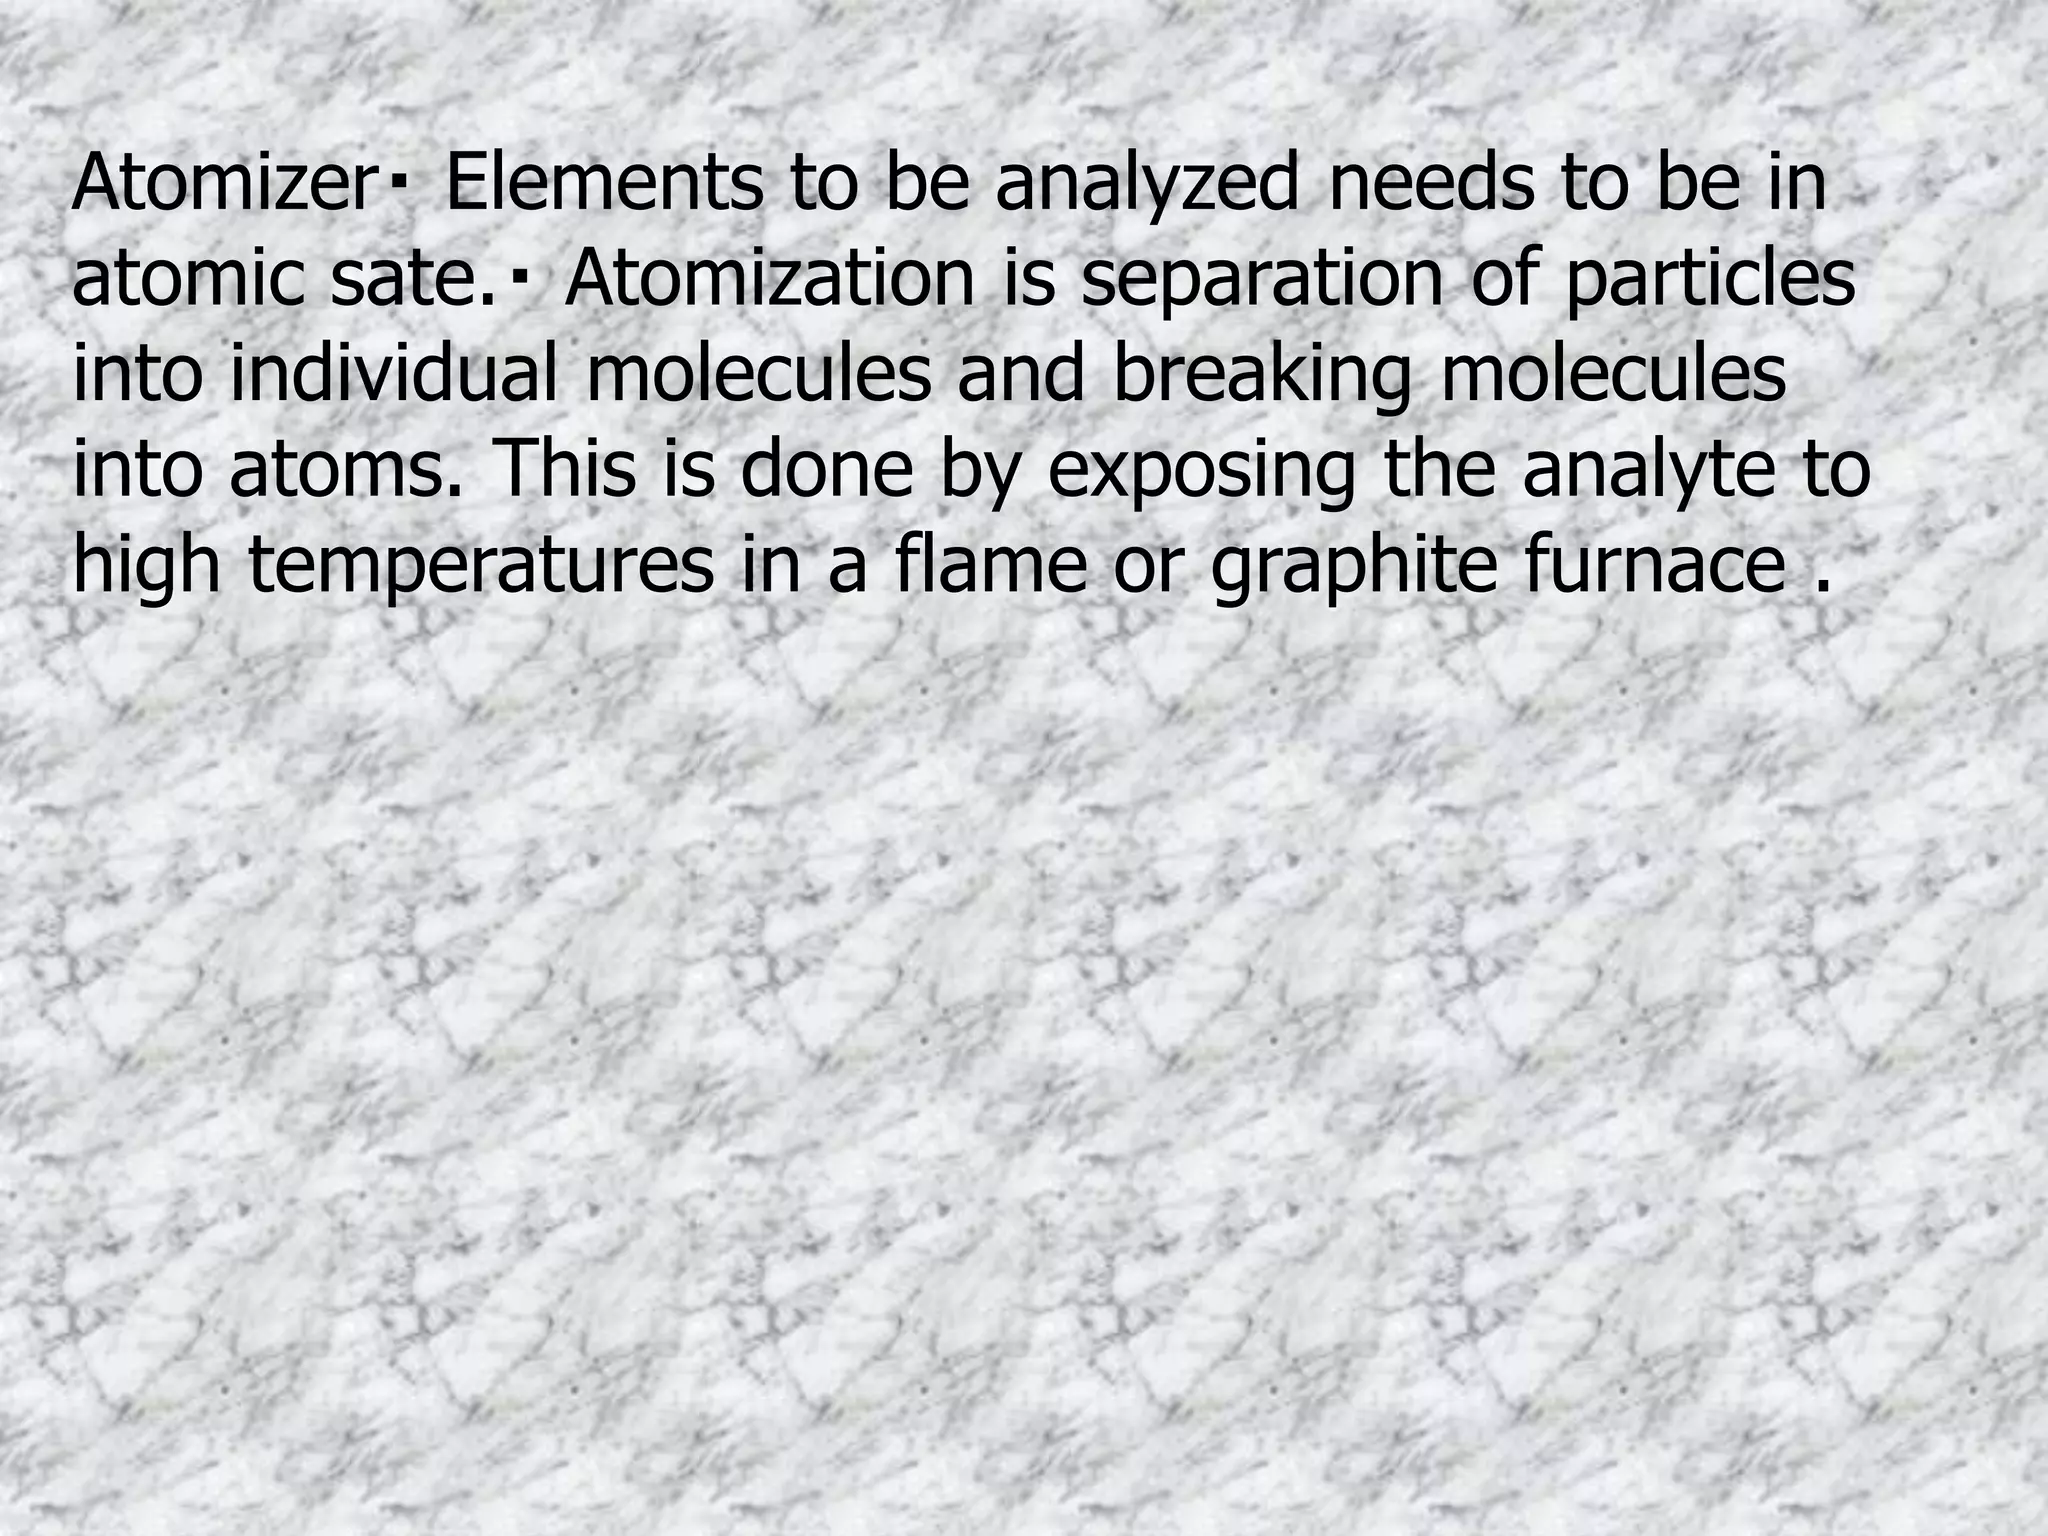


![Lead is extracted from a sample of blood and analyzed at 283 nm and gave an absorbance of
0.340 in an AA spectrometer. Using the data provided, graph a calibration curve and find the
concentration of lead ions in the blood sample.
[Pb+2] (ppm) Absorbance Calculated Pb (II) concentraions (ppm) Absorbance
0.000 0.000 0.357 0.340
0.100 0.116
0.200 0.216
0.300 0.310
0.400 0.425
0.500 0.520
Lead (II) Calibration Curve
y = 1.0505x
R2
= 0.9988
0.000
0.100
0.200
0.300
0.400
0.500
0.600
0.000 0.100 0.200 0.300 0.400 0.500 0.600
[Pb+2] (ppm)
Absorbance
• The data provided in
the problem appears
in the upper left hand
corner of this MS
EXCEL worksheet.
• The graph was used
to calculate the best
fit line.
• The equation was
then used to
calculate the
concentration of Pb
(II) ions with an
absorbance of 0.340.
• The result, 0.357
ppm, is displayed
above the graph.](https://image.slidesharecdn.com/atomicabsorptionspectroscopy-201121142612/75/Atomic-absorption-spectroscopy-22-2048.jpg)