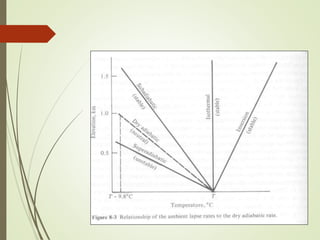
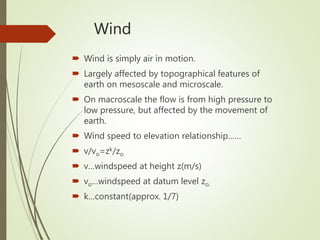
Atmospheric stability and
plume behavior
Dilution effect of air
 When a pocket of smoke, containing air pollutants, is released
into atmosphere from any source it gets dispersed into the
atmosphere in various directions depending upon the prevailing
wind, temperature and pressure conditions. This effect results in
dilution of the effect of pollutants.
 Various natural properties of nature, which continuously clean
the environment automatically are…..
 Dispersion,
 Gravitational settling,
 Absorption and adsorption,
 Rainout.
Lapse rate
 Temp. of air normally decreases with increase in altitude. This rate of
change of temp is called ‘lapse rate’.
 Prevailing lapse rate at a particular place, at a particular time is
called ‘environmental lapse rate’(ELR).
 When a parcel of hotter and lighter air than the surrounding is
released , then it is naturally tend to rise up until it reaches the
height at which its own temp and density becomes equal to that of
air surrounding it. It may be different than ELR.
 This internal cooling is assumed to be ‘adiabatic’ i.e. without
exchange of heat with outside environment. This change of temp of
air parcel with height is called ‘Adiabatic lapse rate’(ALR).
 Environmental lapse rate……..15 0
c/km
 Adiabatic lapse rate…..6.0(dry) to 9.8(wet) 0
c/km
Atmospheric stability
 Stability of the atmosphere is determined by knowing the
ALR and ELR. Three major relative positions of ELR with
respect to ALR defines the environmental stability.
 Stable atmosphere is bad for effective dispersal of air
pollutant while unstable atmosphere is ideal for effective
dispersal of air pollutant.
 In winter the atmosphere is comparatively stable, as
compaired to summer, which is unstable.
 Determination of mixing height and extent of dispersion can
be determined by plotting ALR and ELR.
Super adiabatic lapse rate-
 When ELR is more than ALR…… unstable atmosphere .
Sub adiabatic lapse rate-
 When ELR is less than ALR…… stable atmosphere .
Neutral lapse rate-
When ELR equals to ALR……Neutral atmosphere .
Negative lapse rate/ Inversion-
Temp .of environment increase with altitude.
1. Radiation inversion…unequal cooling of air and earth.
2. Subsidence inversion…sinking of air in high pressure area
surrounded by low pressure area.
Heat
 Heat is a critical atmospheric variable, the major catalyst of climatic
condition.
 The heat energy comes from sun in the form of short wave
radiation(0.5µm), while earth emits(10µm) much longer waves.
 Some solar waves never reach the earth but are reflected back.
 Some solar rays are scattered due to intervening air molecules.
 Some of suns rays are absorbed by ozone, water vapour, CO2 and
clouds.
 Heat is helpful in scattering of pollutants and thus reducing the
concentration of it.
Tropospheric heating
 Green house effect
 Evaporation- condensation cycle
 Conduction (direct contact of air and heat)
 Convection(rising of warm air and the sinking of
cold air.
Pressure
Pressure systems……
 High pressure systems….. Clear skies, light wind, and atmospheric
stability, vertical motion is downwards and horizontal motion is
clockwise.
 Under these stable condition pollutant are likely to buildup at
undesirable levels.
 Low pressure systems…… Cloudy skies, gusty wind, and atmospheric
instability.
 Vertical motion is upwards and horizontal motion is anti-clockwise.
 Pollution problems are minimal
Wind
 Wind is simply air in motion.
 Largely affected by topographical features of
earth on mesoscale and microscale.
 On macroscale the flow is from high pressure to
low pressure, but affected by the movement of
earth.
 Wind speed to elevation relationship……
 v/vo=zk/zo
 v…windspeed at height z(m/s)
 vo…windspeed at datum level zo.
 k…constant(approx. 1/7)
Wind rose
 A wind rose is defined as ‘ any one of a class of
diagrams designed to show the distribution of
wind direction experienced at a given location over
a considerable period’.
 Wind rose shows the prevailing direction of wind.
Wind rose may be constructed from the data
obtained over a given time period.
 Wind direction refers to the direction from which
wind is blowing.
 Observations corresponding to wind speed below
1km/hr are recorded as calm.
Wind rose diagram
Special wind roses are sometimes constructed like:
 Precipitation wind rose,
 Smoke wind rose,
 Sulfur dioxide wind rose,
 Hydrocarbon wind rose
Instead of windspeed the parameters like precipitation,
smoke, sulfur dioxide, HC etc are attached to the
wind direction. These are known as ‘pollution roses’.
Winds and dispersion
 Wind is one of the most important vehicles in
the distribution, transport and dispersion of
air contaminants.
 Velocity of wind determines the travel time for
a particulate to a receptor and also the
dispersion rate of air contaminants.
 Frequently topographic condition will have a
profound effect on winds and thus on air
quality.
Moisture and dispersion
 Moisture content and form in the atmosphere can have
profound effect upon the air quality of a region. The
presence and amount of water vapour in the atmosphere
affects the amount of solar radiation received and reflected
by earth. Water vapour serves to scatter or absorb the solar
energy and hence has major influence on air quality.
 Precipitation serves as a cleansing agent for the atmosphere,
removing the particulates and gaseous pollutant in a
process called washout.
 Washout has few detrimental effects like acid rain.
Plume behavior
 Plume- emitted gases,
 Stack- source of origin (chimney).
 Looping plume-
Under super-adiabatic condition, both upward and downward
movement of the plume is possible. Large eddies of a strong wind
cause a looping pattern, Although the large eddies tend to
disperse pollutants over a wide region, high ground level
concentrations may occur close to the stack.
Fanning
A fanning plume occurs in the presence of a negative lapse
rate when vertical dispersion is restricted, The pollutants
disperse at the stack height, horizontally in the from of a fanning
plume.
Neutral plume-
 It is vertical upward rise of plume, which
occurs when environmental lapse rate is
almost equals to adiabatic lapse rate. The
upward movement will continuous till it
reaches air of similar density.
Fumigative plume–
 when the emission from the stack is under an inversion layer, the
movement of the pollutants in the upward direction is
restricted. The pollutants moves downwards. The resulting
fumigation can lead to a high ground level concentration
downwind of the stack.
Trapping plume-
When inversion layer exist above the stack as well as
below the stack. The emitted plume will neither go
up nor will come down.
Conning plume-
 The neutral plume tends to cone when wind velocity is
greater than 32 kmph and cloud cover blocks the solar
radiation by day. It also occurs under sub adiabatic
condition.
Maximum mixing depth(MMD)
 It can be estimated by plotting maximum
surface temperature and drawing a line parallel
to dry adiabatic lapse rate from the point of
maximum surface temperature to the point at
which the line intersects the ambient lapse rate
for early morning.
Atmospheric stability and plume behaviour

Atmospheric stability and plume behaviour

  • 1.
  • 2.
    Dilution effect ofair  When a pocket of smoke, containing air pollutants, is released into atmosphere from any source it gets dispersed into the atmosphere in various directions depending upon the prevailing wind, temperature and pressure conditions. This effect results in dilution of the effect of pollutants.  Various natural properties of nature, which continuously clean the environment automatically are…..  Dispersion,  Gravitational settling,  Absorption and adsorption,  Rainout.
  • 3.
    Lapse rate  Temp.of air normally decreases with increase in altitude. This rate of change of temp is called ‘lapse rate’.  Prevailing lapse rate at a particular place, at a particular time is called ‘environmental lapse rate’(ELR).  When a parcel of hotter and lighter air than the surrounding is released , then it is naturally tend to rise up until it reaches the height at which its own temp and density becomes equal to that of air surrounding it. It may be different than ELR.  This internal cooling is assumed to be ‘adiabatic’ i.e. without exchange of heat with outside environment. This change of temp of air parcel with height is called ‘Adiabatic lapse rate’(ALR).  Environmental lapse rate……..15 0 c/km  Adiabatic lapse rate…..6.0(dry) to 9.8(wet) 0 c/km
  • 5.
    Atmospheric stability  Stabilityof the atmosphere is determined by knowing the ALR and ELR. Three major relative positions of ELR with respect to ALR defines the environmental stability.  Stable atmosphere is bad for effective dispersal of air pollutant while unstable atmosphere is ideal for effective dispersal of air pollutant.  In winter the atmosphere is comparatively stable, as compaired to summer, which is unstable.  Determination of mixing height and extent of dispersion can be determined by plotting ALR and ELR.
  • 6.
    Super adiabatic lapserate-  When ELR is more than ALR…… unstable atmosphere . Sub adiabatic lapse rate-  When ELR is less than ALR…… stable atmosphere . Neutral lapse rate- When ELR equals to ALR……Neutral atmosphere . Negative lapse rate/ Inversion- Temp .of environment increase with altitude. 1. Radiation inversion…unequal cooling of air and earth. 2. Subsidence inversion…sinking of air in high pressure area surrounded by low pressure area.
  • 8.
    Heat  Heat isa critical atmospheric variable, the major catalyst of climatic condition.  The heat energy comes from sun in the form of short wave radiation(0.5µm), while earth emits(10µm) much longer waves.  Some solar waves never reach the earth but are reflected back.  Some solar rays are scattered due to intervening air molecules.  Some of suns rays are absorbed by ozone, water vapour, CO2 and clouds.  Heat is helpful in scattering of pollutants and thus reducing the concentration of it.
  • 9.
    Tropospheric heating  Greenhouse effect  Evaporation- condensation cycle  Conduction (direct contact of air and heat)  Convection(rising of warm air and the sinking of cold air.
  • 10.
    Pressure Pressure systems……  Highpressure systems….. Clear skies, light wind, and atmospheric stability, vertical motion is downwards and horizontal motion is clockwise.  Under these stable condition pollutant are likely to buildup at undesirable levels.  Low pressure systems…… Cloudy skies, gusty wind, and atmospheric instability.  Vertical motion is upwards and horizontal motion is anti-clockwise.  Pollution problems are minimal
  • 11.
    Wind  Wind issimply air in motion.  Largely affected by topographical features of earth on mesoscale and microscale.  On macroscale the flow is from high pressure to low pressure, but affected by the movement of earth.  Wind speed to elevation relationship……  v/vo=zk/zo  v…windspeed at height z(m/s)  vo…windspeed at datum level zo.  k…constant(approx. 1/7)
  • 12.
    Wind rose  Awind rose is defined as ‘ any one of a class of diagrams designed to show the distribution of wind direction experienced at a given location over a considerable period’.  Wind rose shows the prevailing direction of wind. Wind rose may be constructed from the data obtained over a given time period.  Wind direction refers to the direction from which wind is blowing.  Observations corresponding to wind speed below 1km/hr are recorded as calm.
  • 13.
  • 14.
    Special wind rosesare sometimes constructed like:  Precipitation wind rose,  Smoke wind rose,  Sulfur dioxide wind rose,  Hydrocarbon wind rose Instead of windspeed the parameters like precipitation, smoke, sulfur dioxide, HC etc are attached to the wind direction. These are known as ‘pollution roses’.
  • 15.
    Winds and dispersion Wind is one of the most important vehicles in the distribution, transport and dispersion of air contaminants.  Velocity of wind determines the travel time for a particulate to a receptor and also the dispersion rate of air contaminants.  Frequently topographic condition will have a profound effect on winds and thus on air quality.
  • 16.
    Moisture and dispersion Moisture content and form in the atmosphere can have profound effect upon the air quality of a region. The presence and amount of water vapour in the atmosphere affects the amount of solar radiation received and reflected by earth. Water vapour serves to scatter or absorb the solar energy and hence has major influence on air quality.  Precipitation serves as a cleansing agent for the atmosphere, removing the particulates and gaseous pollutant in a process called washout.  Washout has few detrimental effects like acid rain.
  • 17.
    Plume behavior  Plume-emitted gases,  Stack- source of origin (chimney).  Looping plume- Under super-adiabatic condition, both upward and downward movement of the plume is possible. Large eddies of a strong wind cause a looping pattern, Although the large eddies tend to disperse pollutants over a wide region, high ground level concentrations may occur close to the stack.
  • 18.
    Fanning A fanning plumeoccurs in the presence of a negative lapse rate when vertical dispersion is restricted, The pollutants disperse at the stack height, horizontally in the from of a fanning plume.
  • 19.
    Neutral plume-  Itis vertical upward rise of plume, which occurs when environmental lapse rate is almost equals to adiabatic lapse rate. The upward movement will continuous till it reaches air of similar density.
  • 20.
    Fumigative plume–  whenthe emission from the stack is under an inversion layer, the movement of the pollutants in the upward direction is restricted. The pollutants moves downwards. The resulting fumigation can lead to a high ground level concentration downwind of the stack.
  • 21.
    Trapping plume- When inversionlayer exist above the stack as well as below the stack. The emitted plume will neither go up nor will come down.
  • 22.
    Conning plume-  Theneutral plume tends to cone when wind velocity is greater than 32 kmph and cloud cover blocks the solar radiation by day. It also occurs under sub adiabatic condition.
  • 23.
    Maximum mixing depth(MMD) It can be estimated by plotting maximum surface temperature and drawing a line parallel to dry adiabatic lapse rate from the point of maximum surface temperature to the point at which the line intersects the ambient lapse rate for early morning.