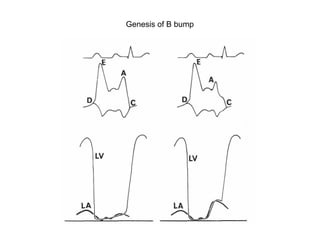
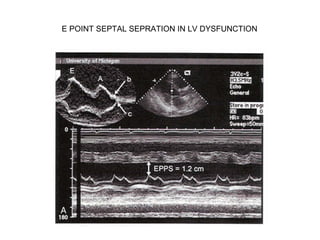
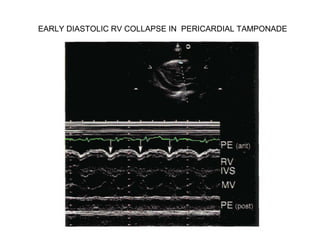
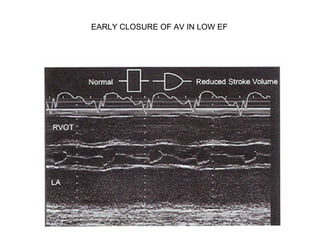
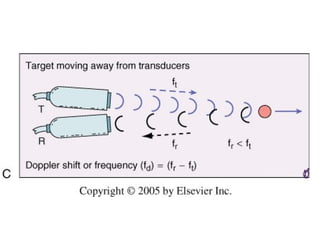
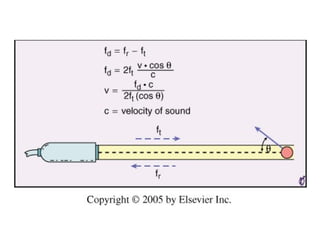
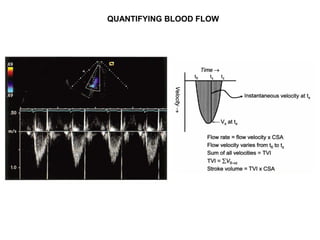
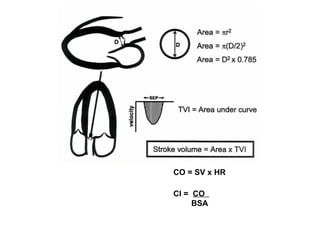
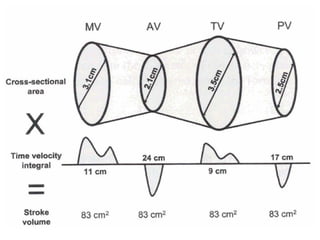
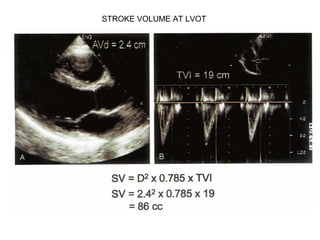
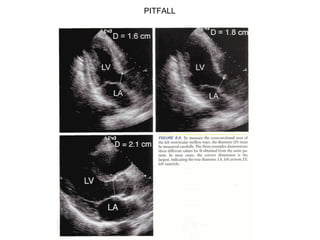
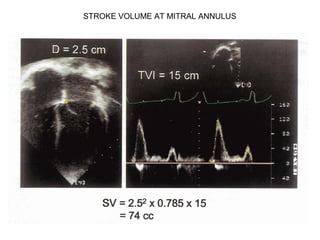
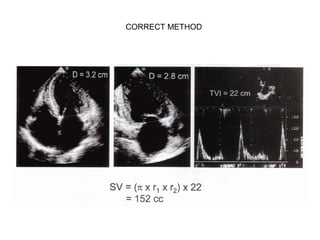
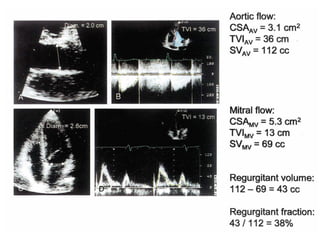
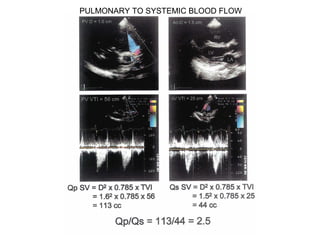
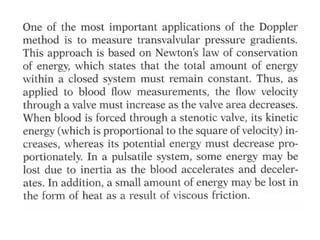
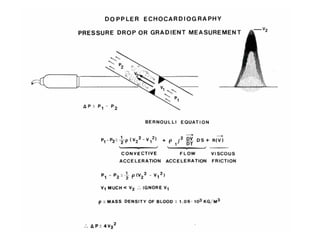
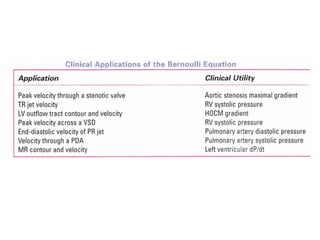
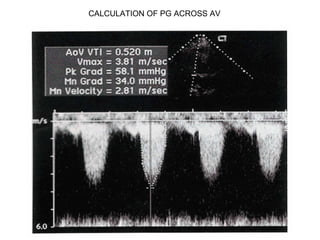
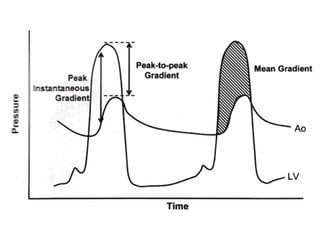
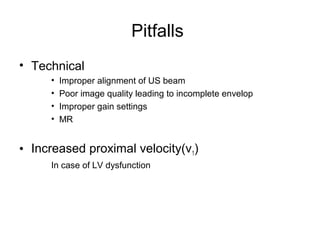
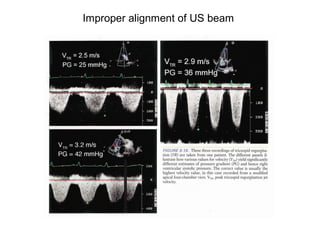
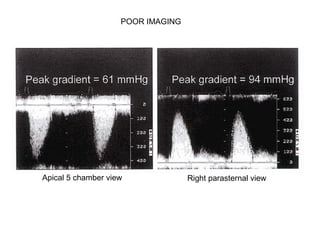
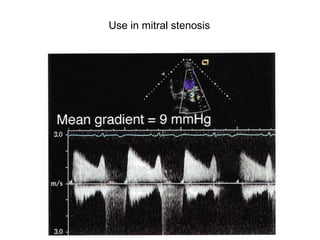
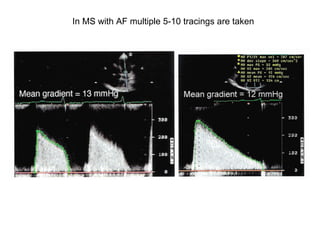
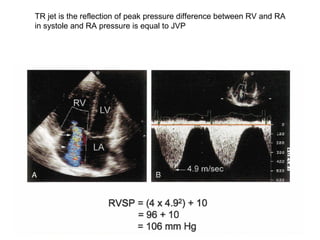
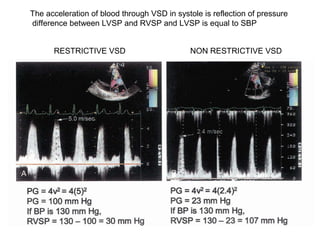
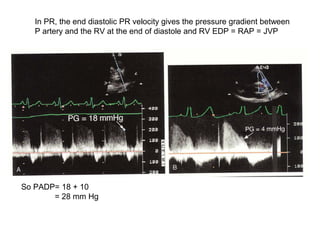
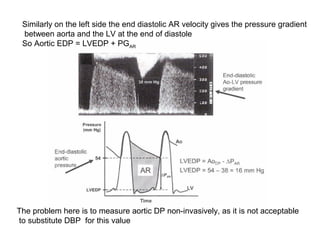
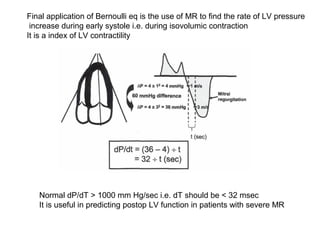
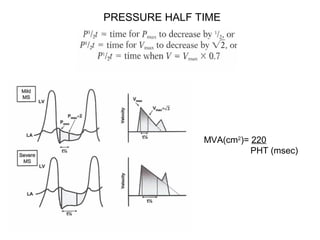
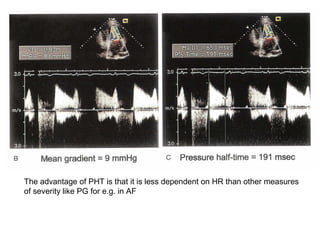
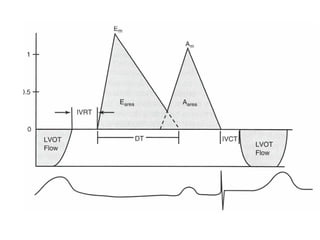
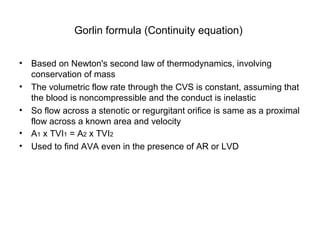
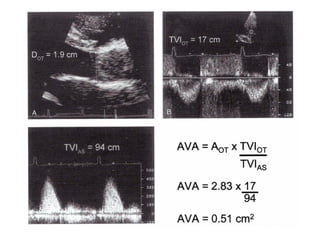
HEMODYNAMIC ASSESSMENT BY ECHOCARDIOGRAPHY
DR NISHANT TYAGI
DR NISHANT TYAGI
MODERATOR : DR R R KASLIWAL
Escorts Heart Institute And Research CentreEscorts Heart Institute And Research Centre
In acute AR
B BUMP IN LV DYSFUNCTION
Genesis of B bump
E POINT SEPTAL SEPRATION IN LV DYSFUNCTION
EARLY DIASTOLIC RV COLLAPSE IN PERICARDIAL TAMPONADE
EARLY CLOSURE OF AV IN LOW EF
EARLY SYSTOLIC DOWNWARD MOVEMENT OF IVS IN LBBB
DOPPLER SHIFT
• Christian Doppler in 1842 described the Doppler effect that sound frequency
increases as a sound source moves towards the observer and decreases as
the source moves away, the change in frequency is called Doppler shift
• Doppler shift depends on transmitted frequency, velocity of target and the
angle between the ultrasound beam and the direction of moving target
• Based on Doppler shift blood flow velocities are calculated
• Blood flow velocities can be then be converted to pressure gradients in
mmHg by Bernoulli equation
QUANTIFYING BLOOD FLOW
CO = SV x HR
CI = CO
BSA
STROKE VOLUME AT LVOT
PITFALL
STROKE VOLUME AT MITRAL ANNULUS
CORRECT METHOD
PULMONARY TO SYSTEMIC BLOOD FLOW
CALCULATION OF PG ACROSS AV
Pitfalls
• Technical
• Improper alignment of US beam
• Poor image quality leading to incomplete envelop
• Improper gain settings
• MR
• Increased proximal velocity(v1)
In case of LV dysfunction
Improper alignment of US beam
Apical 5 chamber view Right parasternal view
POOR IMAGING
Use in mitral stenosis
In MS with AF multiple 5-10 tracings are taken
TR jet is the reflection of peak pressure difference between RV and RA
in systole and RA pressure is equal to JVP
The acceleration of blood through VSD in systole is reflection of pressure
difference between LVSP and RVSP and LVSP is equal to SBP
RESTRICTIVE VSD NON RESTRICTIVE VSD
In PR, the end diastolic PR velocity gives the pressure gradient between
P artery and the RV at the end of diastole and RV EDP = RAP = JVP
So PADP= 18 + 10
= 28 mm Hg
Similarly on the left side the end diastolic AR velocity gives the pressure gradient
between aorta and the LV at the end of diastole
So Aortic EDP = LVEDP + PGAR
The problem here is to measure aortic DP non-invasively, as it is not acceptable
to substitute DBP for this value
Final application of Bernoulli eq is the use of MR to find the rate of LV pressure
increase during early systole i.e. during isovolumic contraction
It is a index of LV contractility
Normal dP/dT > 1000 mm Hg/sec i.e. dT should be < 32 msec
It is useful in predicting postop LV function in patients with severe MR
PRESSURE HALF TIME
MVA(cm2
)= 220
PHT (msec)
The advantage of PHT is that it is less dependent on HR than other measures
of severity like PG for e.g. in AF
PITFALLS
• Presence of AR
• Presence of LVH
• For 48 - 72 hours after BMV
IN AR
Rate of decrease in the Velocity is reflection of increase in
LVDP and fall in aortic pressure.
So severe the AR the steeper will be the slope and lesser the PHT
PHT < 250 msec indicates severe AR
Pitfall
In chronic AR, LV becomes dilated and complaint
and so LVDP rises slowly leading to falsely prolonged PHT
INDICATERS OF INCREASED LVEDP
IF dt < 130 msec ,
IF Pva(t) – MIPa (t) > 50 msec IT INDICATES LVEDP >20 mm Hg
Gorlin formula (Continuity equation)
• Based on Newton's second law of thermodynamics, involving
conservation of mass
• The volumetric flow rate through the CVS is constant, assuming that
the blood is noncompressible and the conduct is inelastic
• So flow across a stenotic or regurgitant orifice is same as a proximal
flow across a known area and velocity
• A1 x TVI1 = A2 x TVI2
• Used to find AVA even in the presence of AR or LVD
THANKS

Hemodynamic Assessment by Echocardiography

  • 1.
    HEMODYNAMIC ASSESSMENT BYECHOCARDIOGRAPHY DR NISHANT TYAGI DR NISHANT TYAGI MODERATOR : DR R R KASLIWAL Escorts Heart Institute And Research CentreEscorts Heart Institute And Research Centre
  • 3.
  • 4.
    B BUMP INLV DYSFUNCTION
  • 5.
  • 6.
    E POINT SEPTALSEPRATION IN LV DYSFUNCTION
  • 7.
    EARLY DIASTOLIC RVCOLLAPSE IN PERICARDIAL TAMPONADE
  • 8.
    EARLY CLOSURE OFAV IN LOW EF
  • 9.
    EARLY SYSTOLIC DOWNWARDMOVEMENT OF IVS IN LBBB
  • 10.
    DOPPLER SHIFT • ChristianDoppler in 1842 described the Doppler effect that sound frequency increases as a sound source moves towards the observer and decreases as the source moves away, the change in frequency is called Doppler shift • Doppler shift depends on transmitted frequency, velocity of target and the angle between the ultrasound beam and the direction of moving target • Based on Doppler shift blood flow velocities are calculated • Blood flow velocities can be then be converted to pressure gradients in mmHg by Bernoulli equation
  • 15.
  • 16.
    CO = SVx HR CI = CO BSA
  • 18.
  • 19.
  • 20.
    STROKE VOLUME ATMITRAL ANNULUS
  • 21.
  • 23.
  • 27.
  • 29.
    Pitfalls • Technical • Improperalignment of US beam • Poor image quality leading to incomplete envelop • Improper gain settings • MR • Increased proximal velocity(v1) In case of LV dysfunction
  • 30.
  • 31.
    Apical 5 chamberview Right parasternal view POOR IMAGING
  • 32.
    Use in mitralstenosis
  • 33.
    In MS withAF multiple 5-10 tracings are taken
  • 34.
    TR jet isthe reflection of peak pressure difference between RV and RA in systole and RA pressure is equal to JVP
  • 35.
    The acceleration ofblood through VSD in systole is reflection of pressure difference between LVSP and RVSP and LVSP is equal to SBP RESTRICTIVE VSD NON RESTRICTIVE VSD
  • 36.
    In PR, theend diastolic PR velocity gives the pressure gradient between P artery and the RV at the end of diastole and RV EDP = RAP = JVP So PADP= 18 + 10 = 28 mm Hg
  • 37.
    Similarly on theleft side the end diastolic AR velocity gives the pressure gradient between aorta and the LV at the end of diastole So Aortic EDP = LVEDP + PGAR The problem here is to measure aortic DP non-invasively, as it is not acceptable to substitute DBP for this value
  • 38.
    Final application ofBernoulli eq is the use of MR to find the rate of LV pressure increase during early systole i.e. during isovolumic contraction It is a index of LV contractility Normal dP/dT > 1000 mm Hg/sec i.e. dT should be < 32 msec It is useful in predicting postop LV function in patients with severe MR
  • 40.
  • 41.
    The advantage ofPHT is that it is less dependent on HR than other measures of severity like PG for e.g. in AF
  • 42.
    PITFALLS • Presence ofAR • Presence of LVH • For 48 - 72 hours after BMV
  • 43.
    IN AR Rate ofdecrease in the Velocity is reflection of increase in LVDP and fall in aortic pressure. So severe the AR the steeper will be the slope and lesser the PHT PHT < 250 msec indicates severe AR Pitfall In chronic AR, LV becomes dilated and complaint and so LVDP rises slowly leading to falsely prolonged PHT
  • 46.
    INDICATERS OF INCREASEDLVEDP IF dt < 130 msec , IF Pva(t) – MIPa (t) > 50 msec IT INDICATES LVEDP >20 mm Hg
  • 47.
    Gorlin formula (Continuityequation) • Based on Newton's second law of thermodynamics, involving conservation of mass • The volumetric flow rate through the CVS is constant, assuming that the blood is noncompressible and the conduct is inelastic • So flow across a stenotic or regurgitant orifice is same as a proximal flow across a known area and velocity • A1 x TVI1 = A2 x TVI2 • Used to find AVA even in the presence of AR or LVD
  • 49.