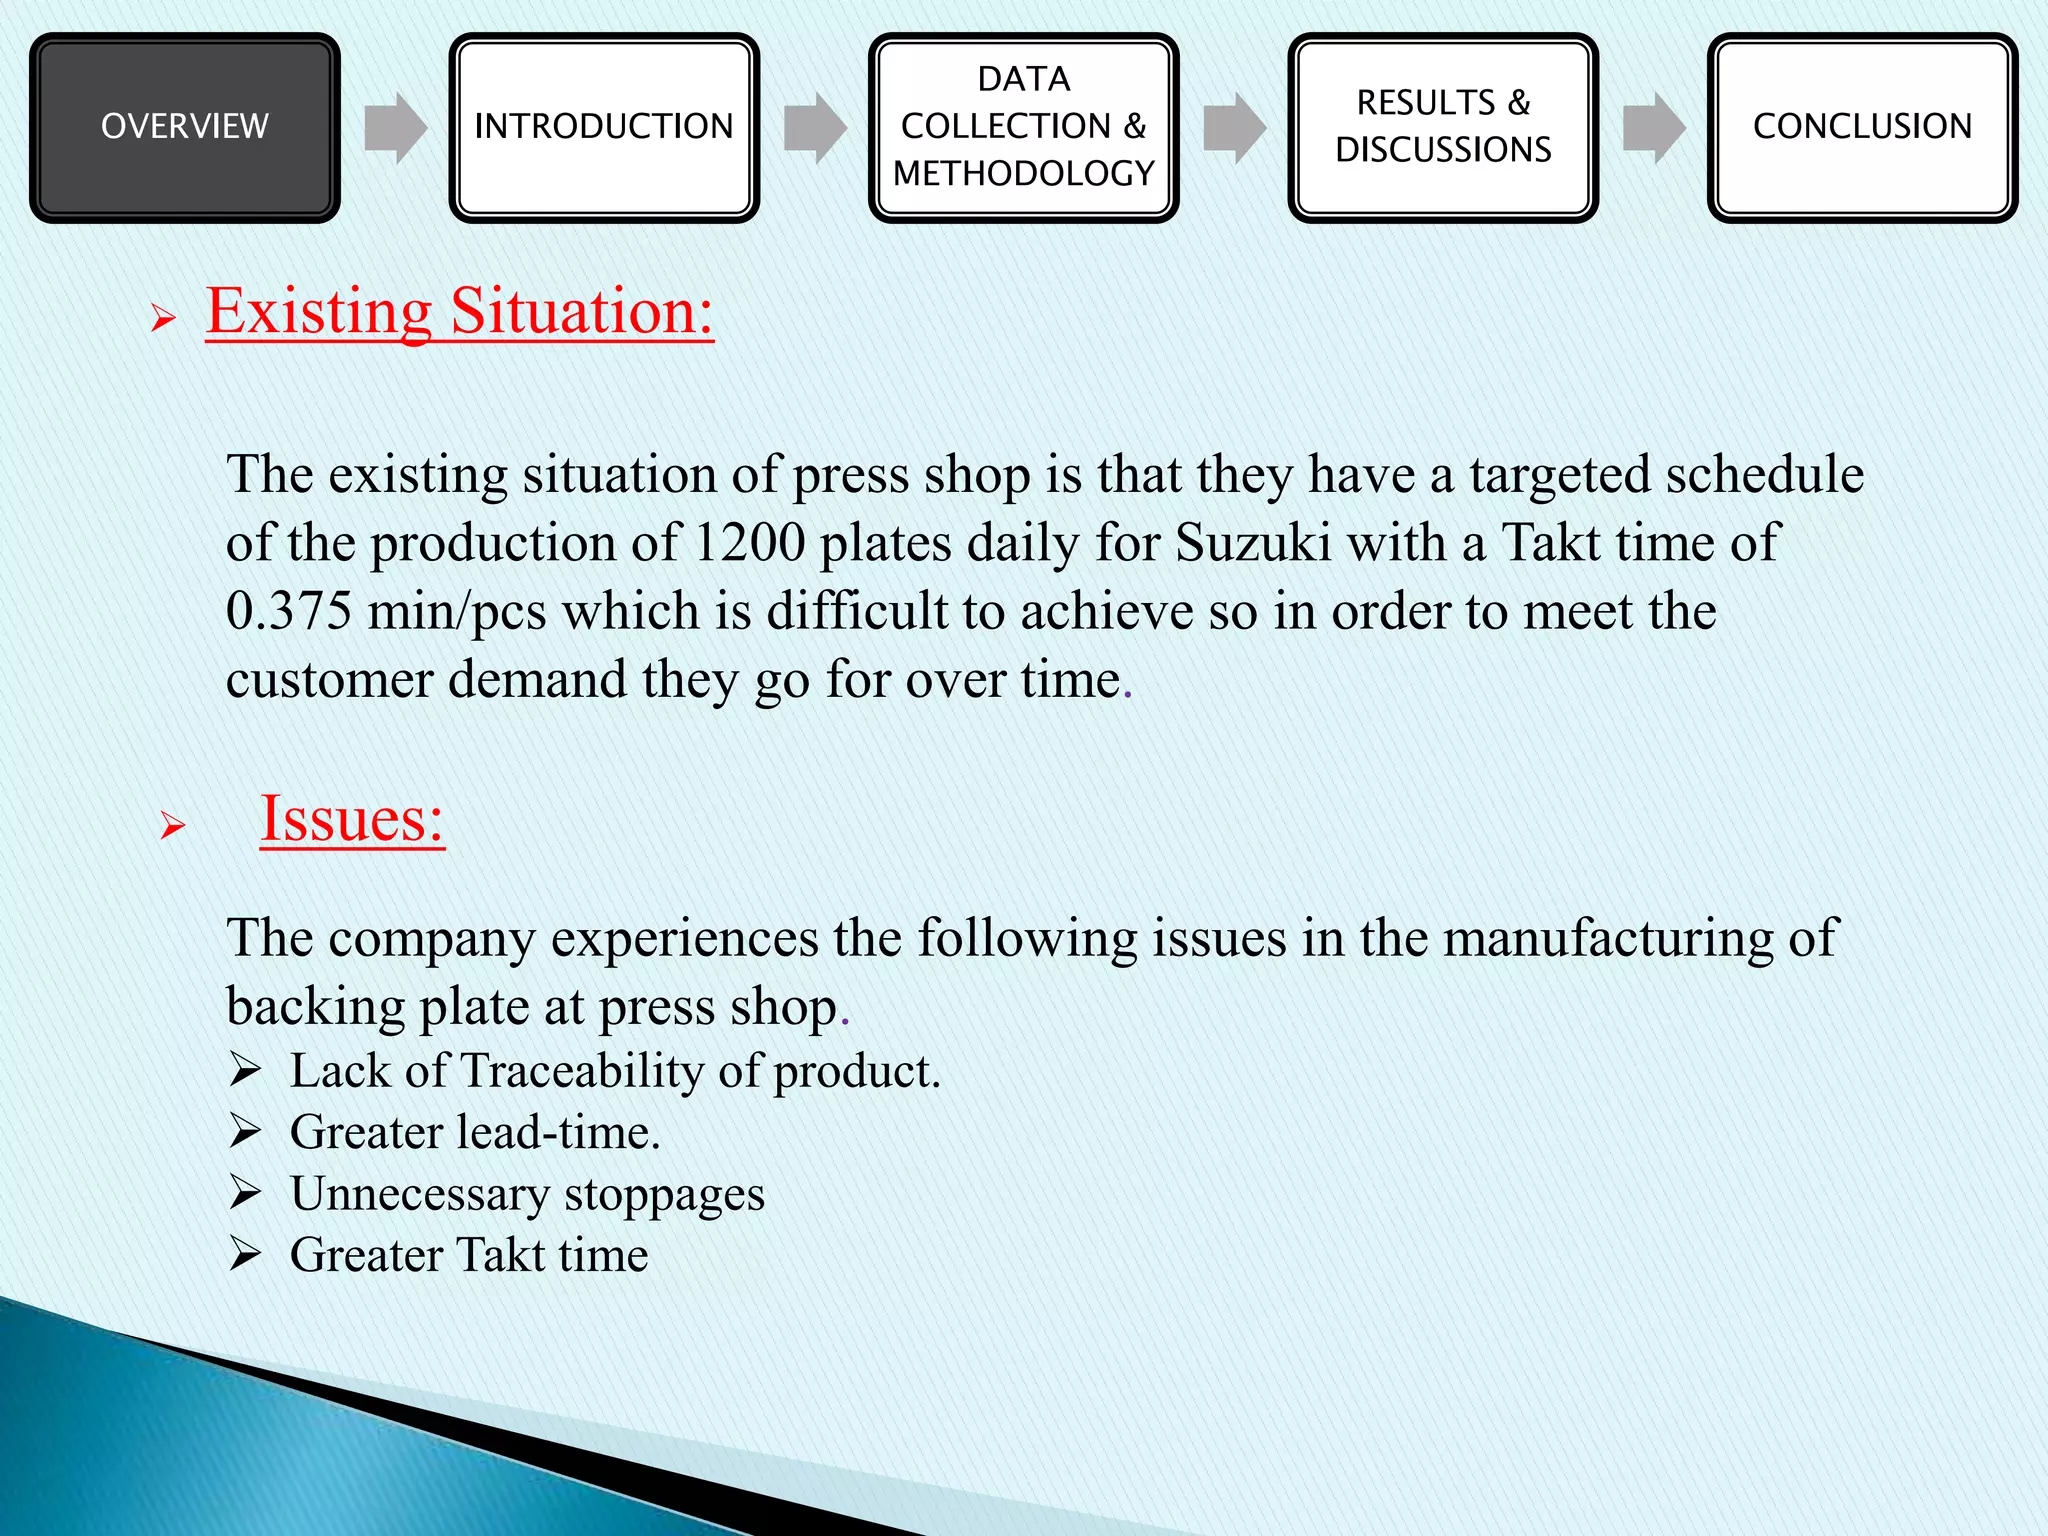
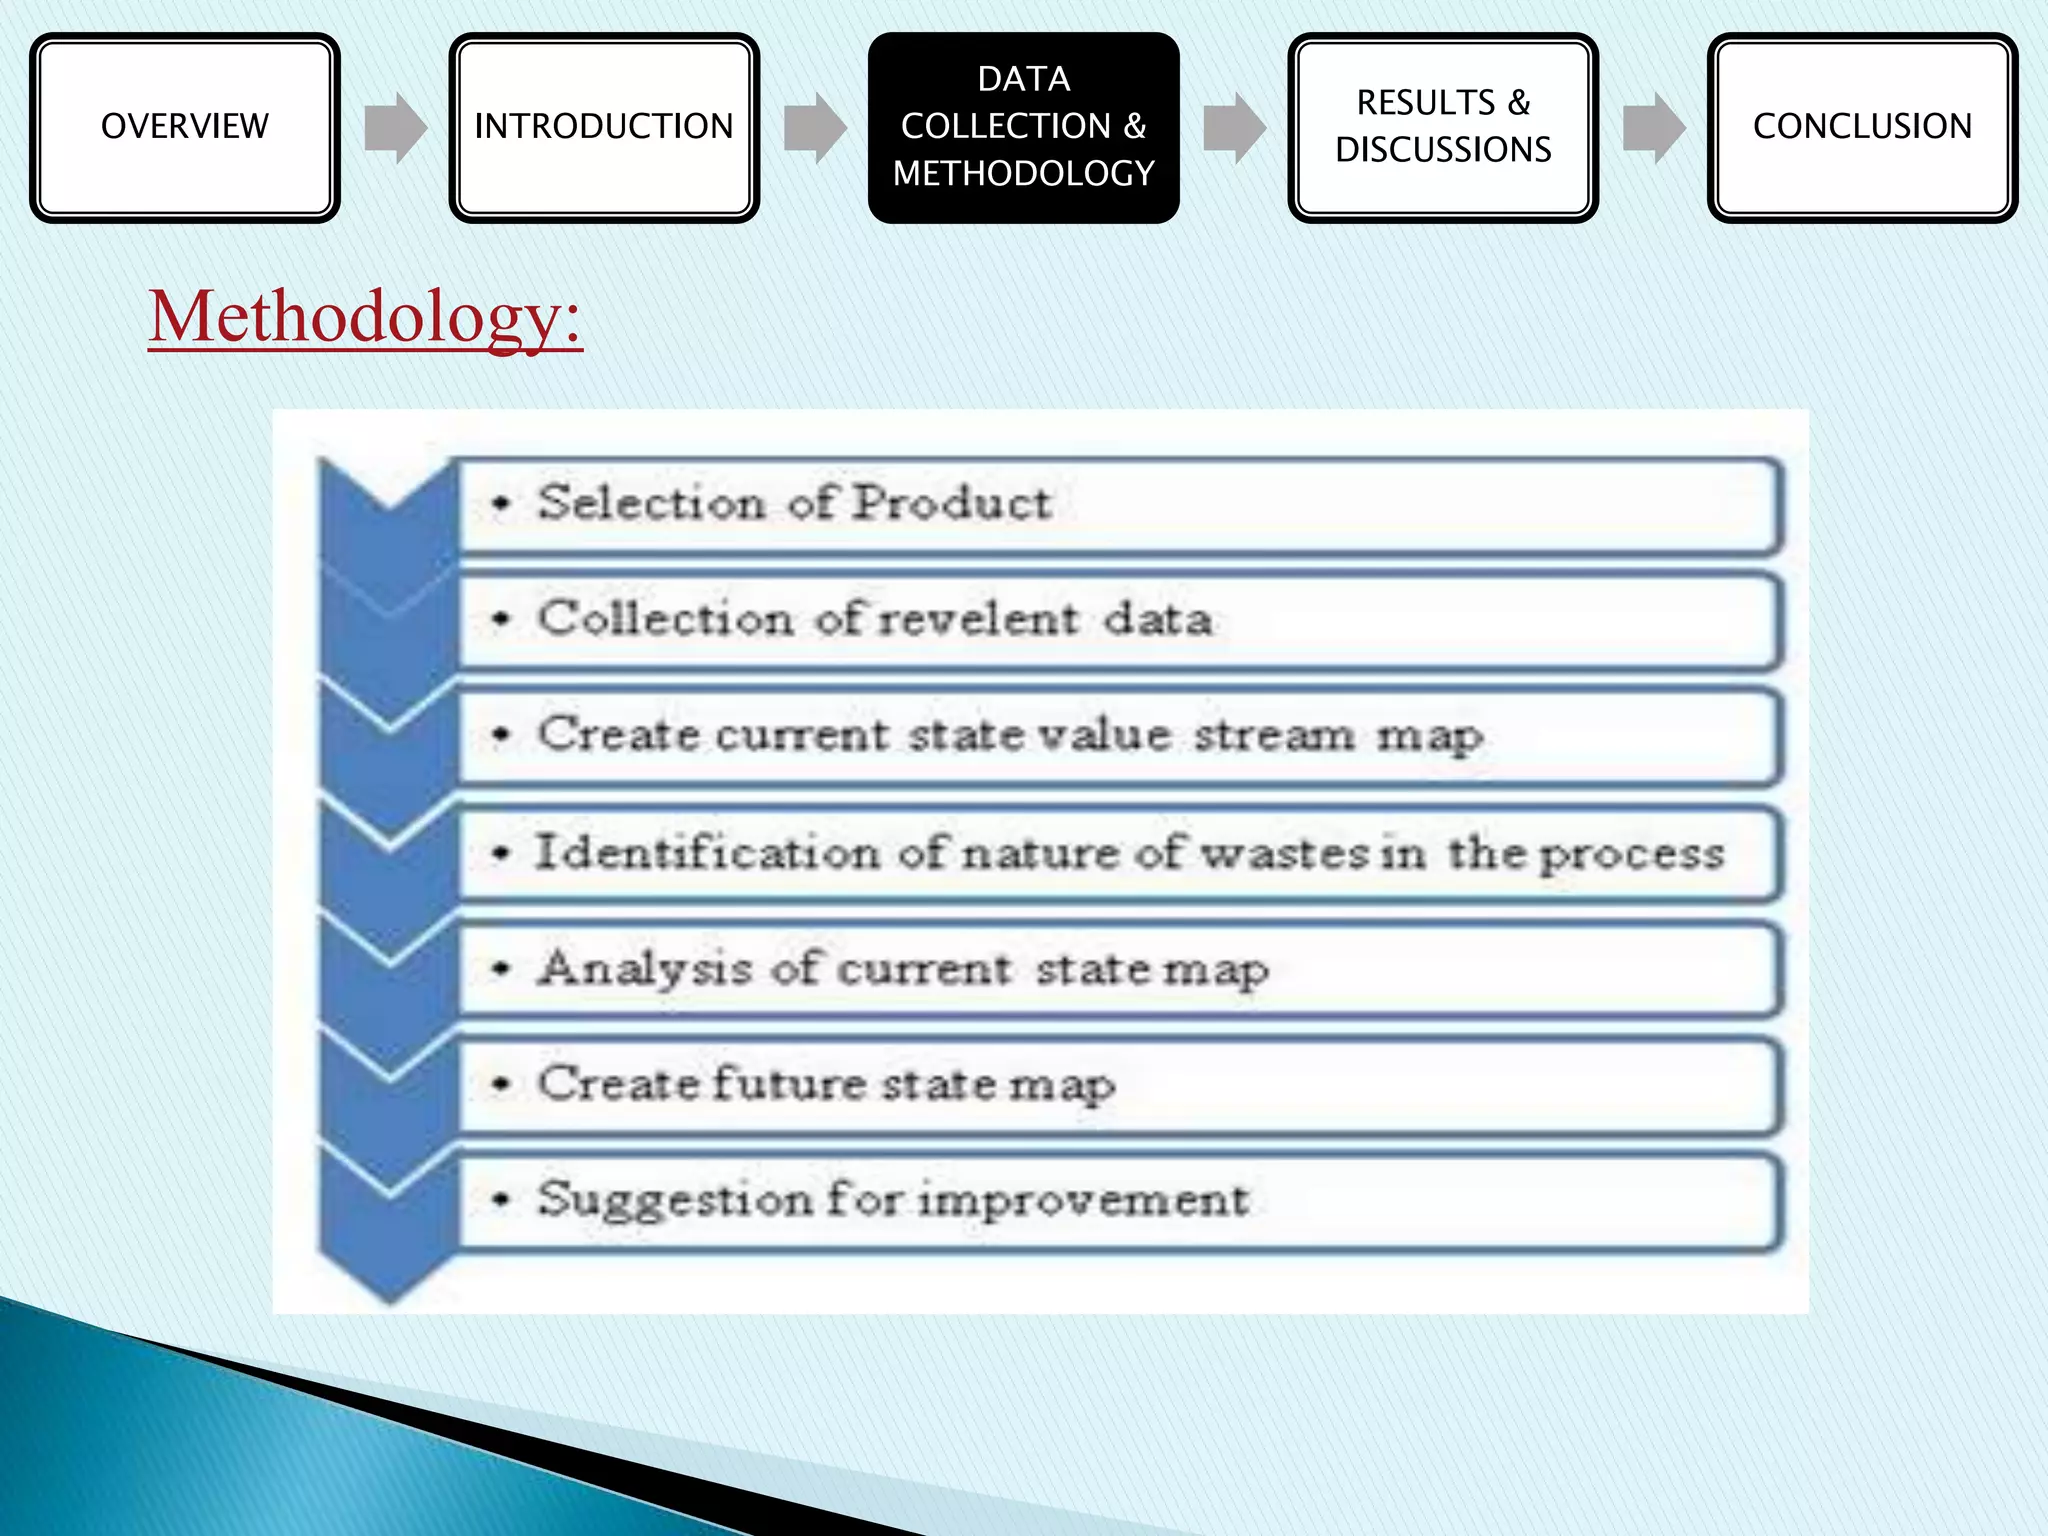
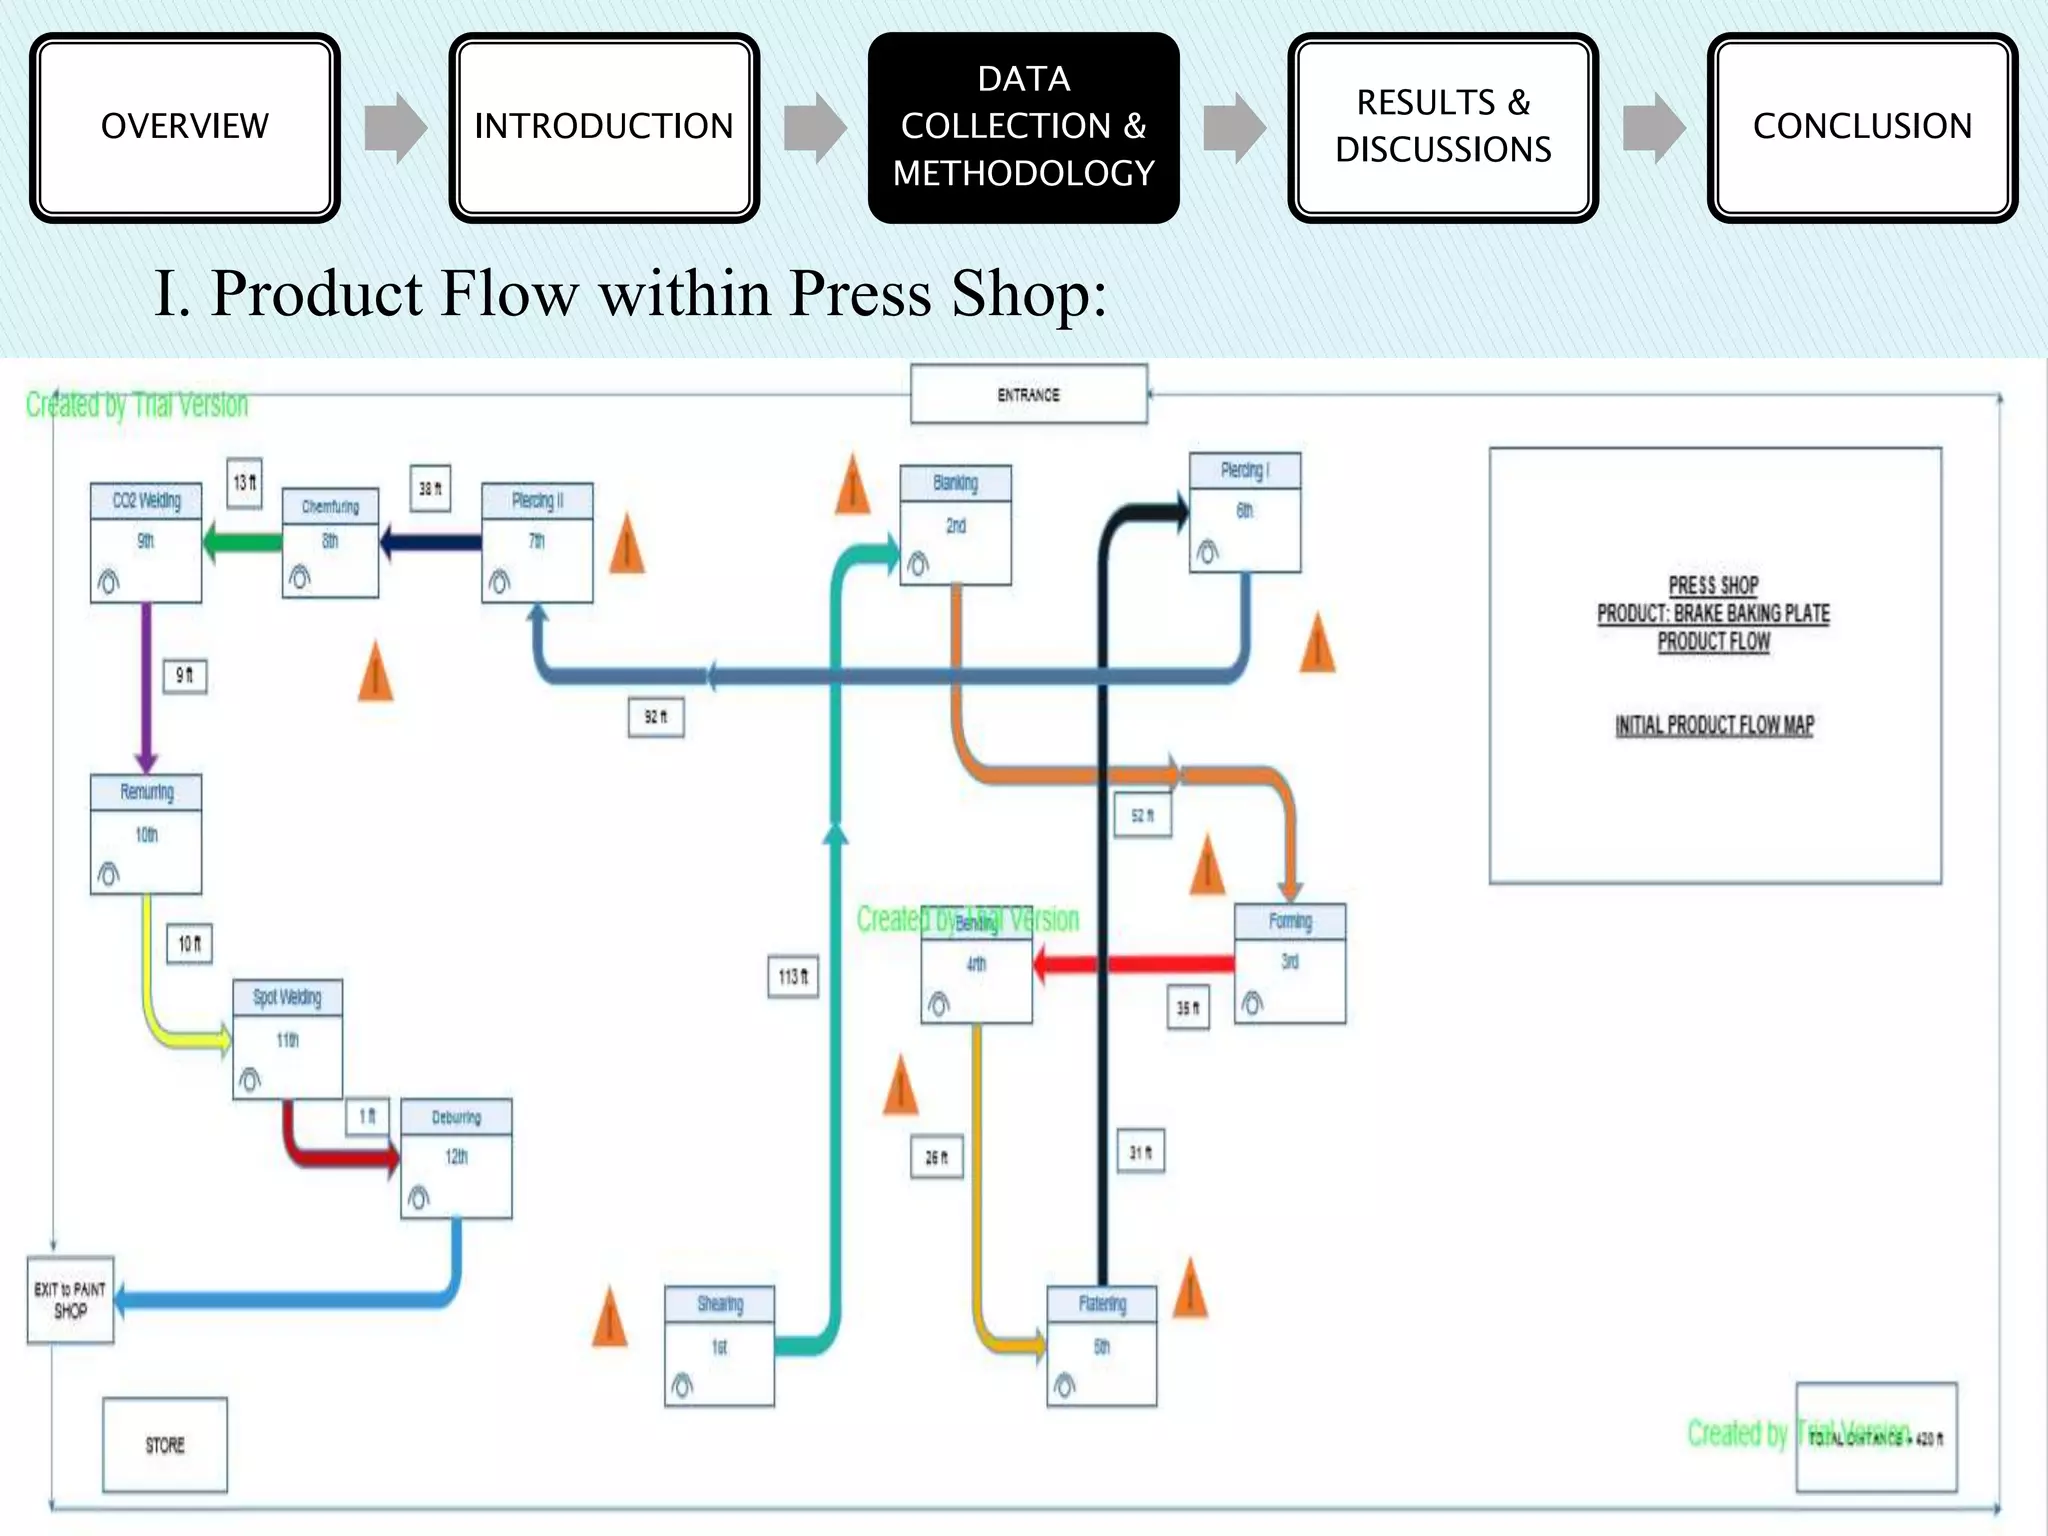
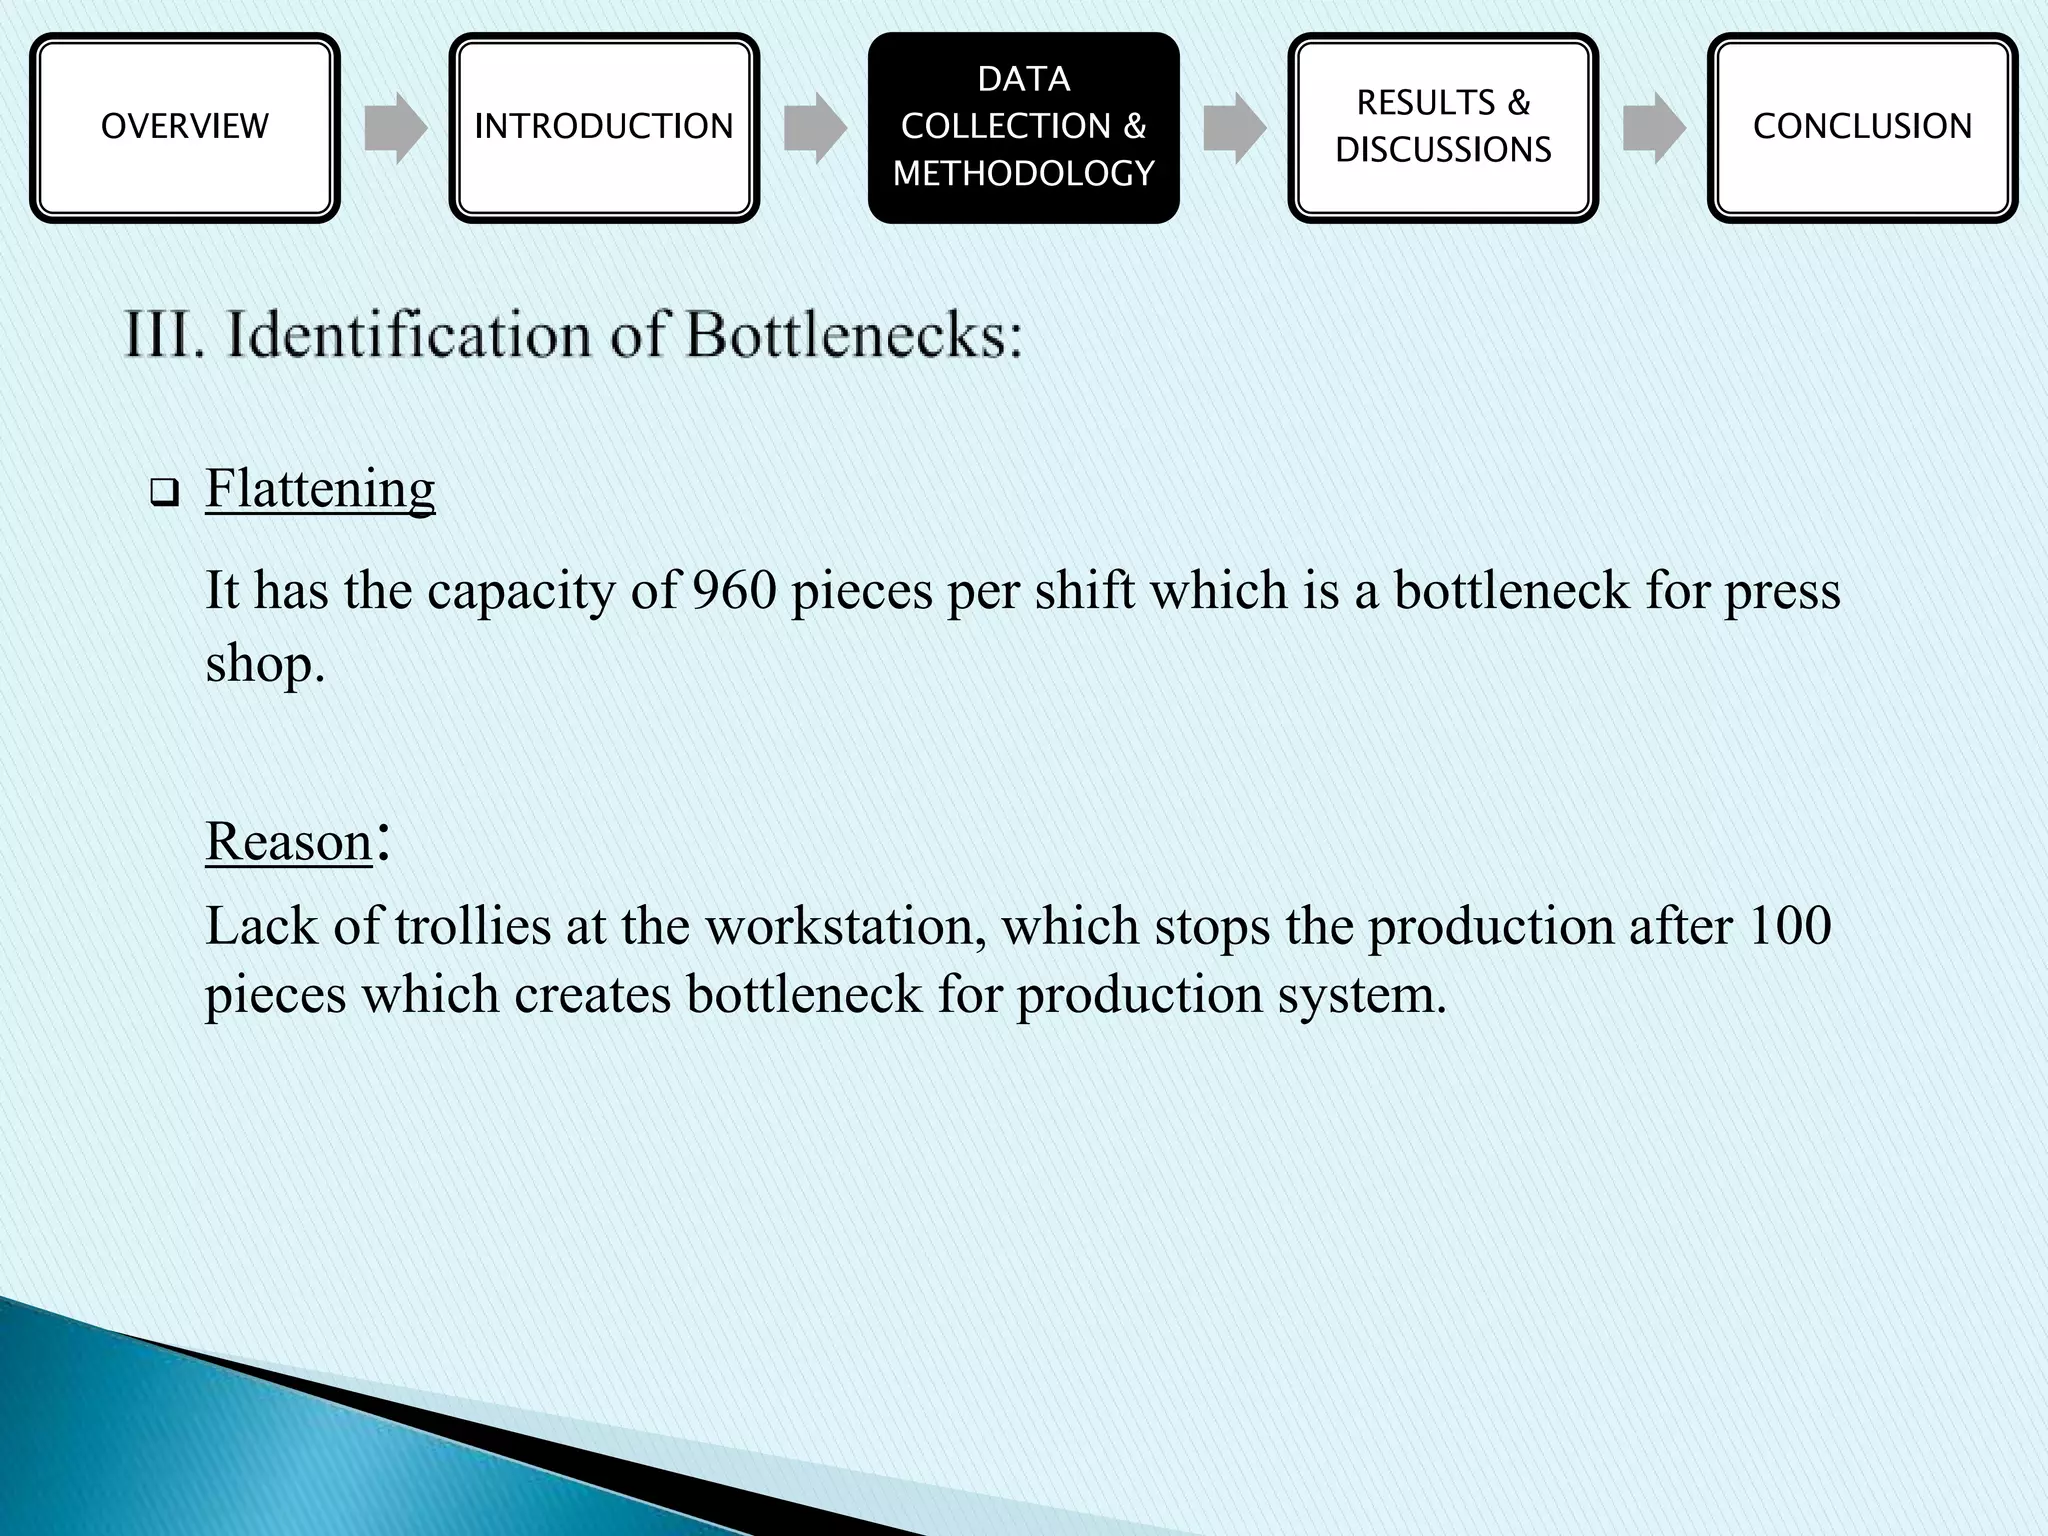
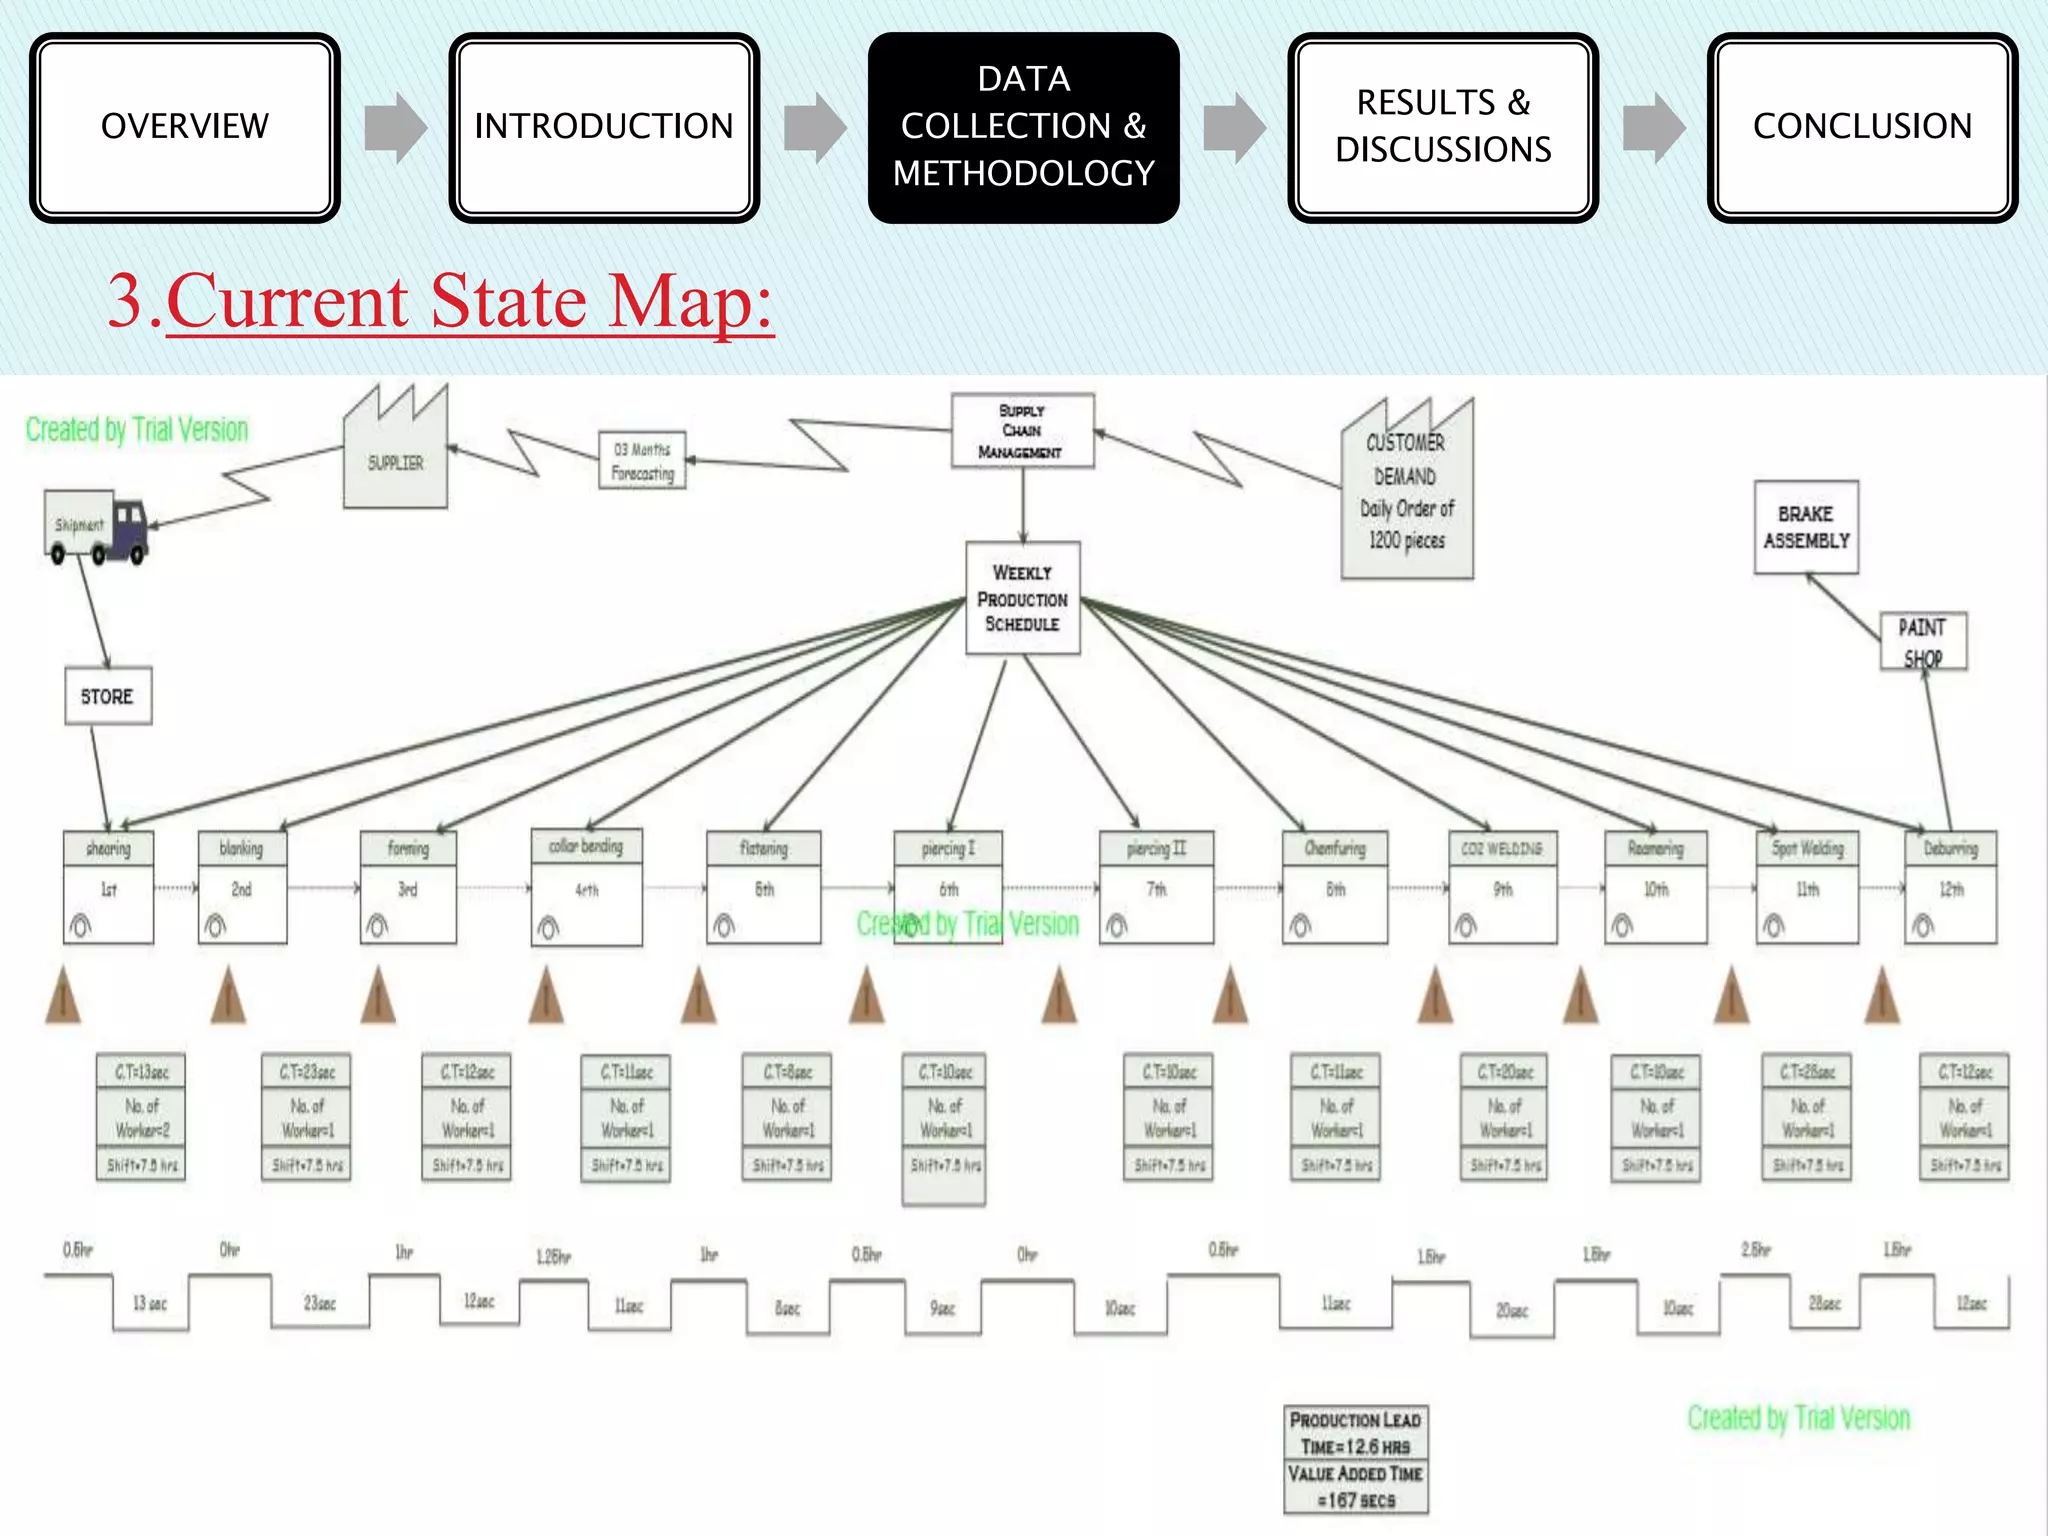
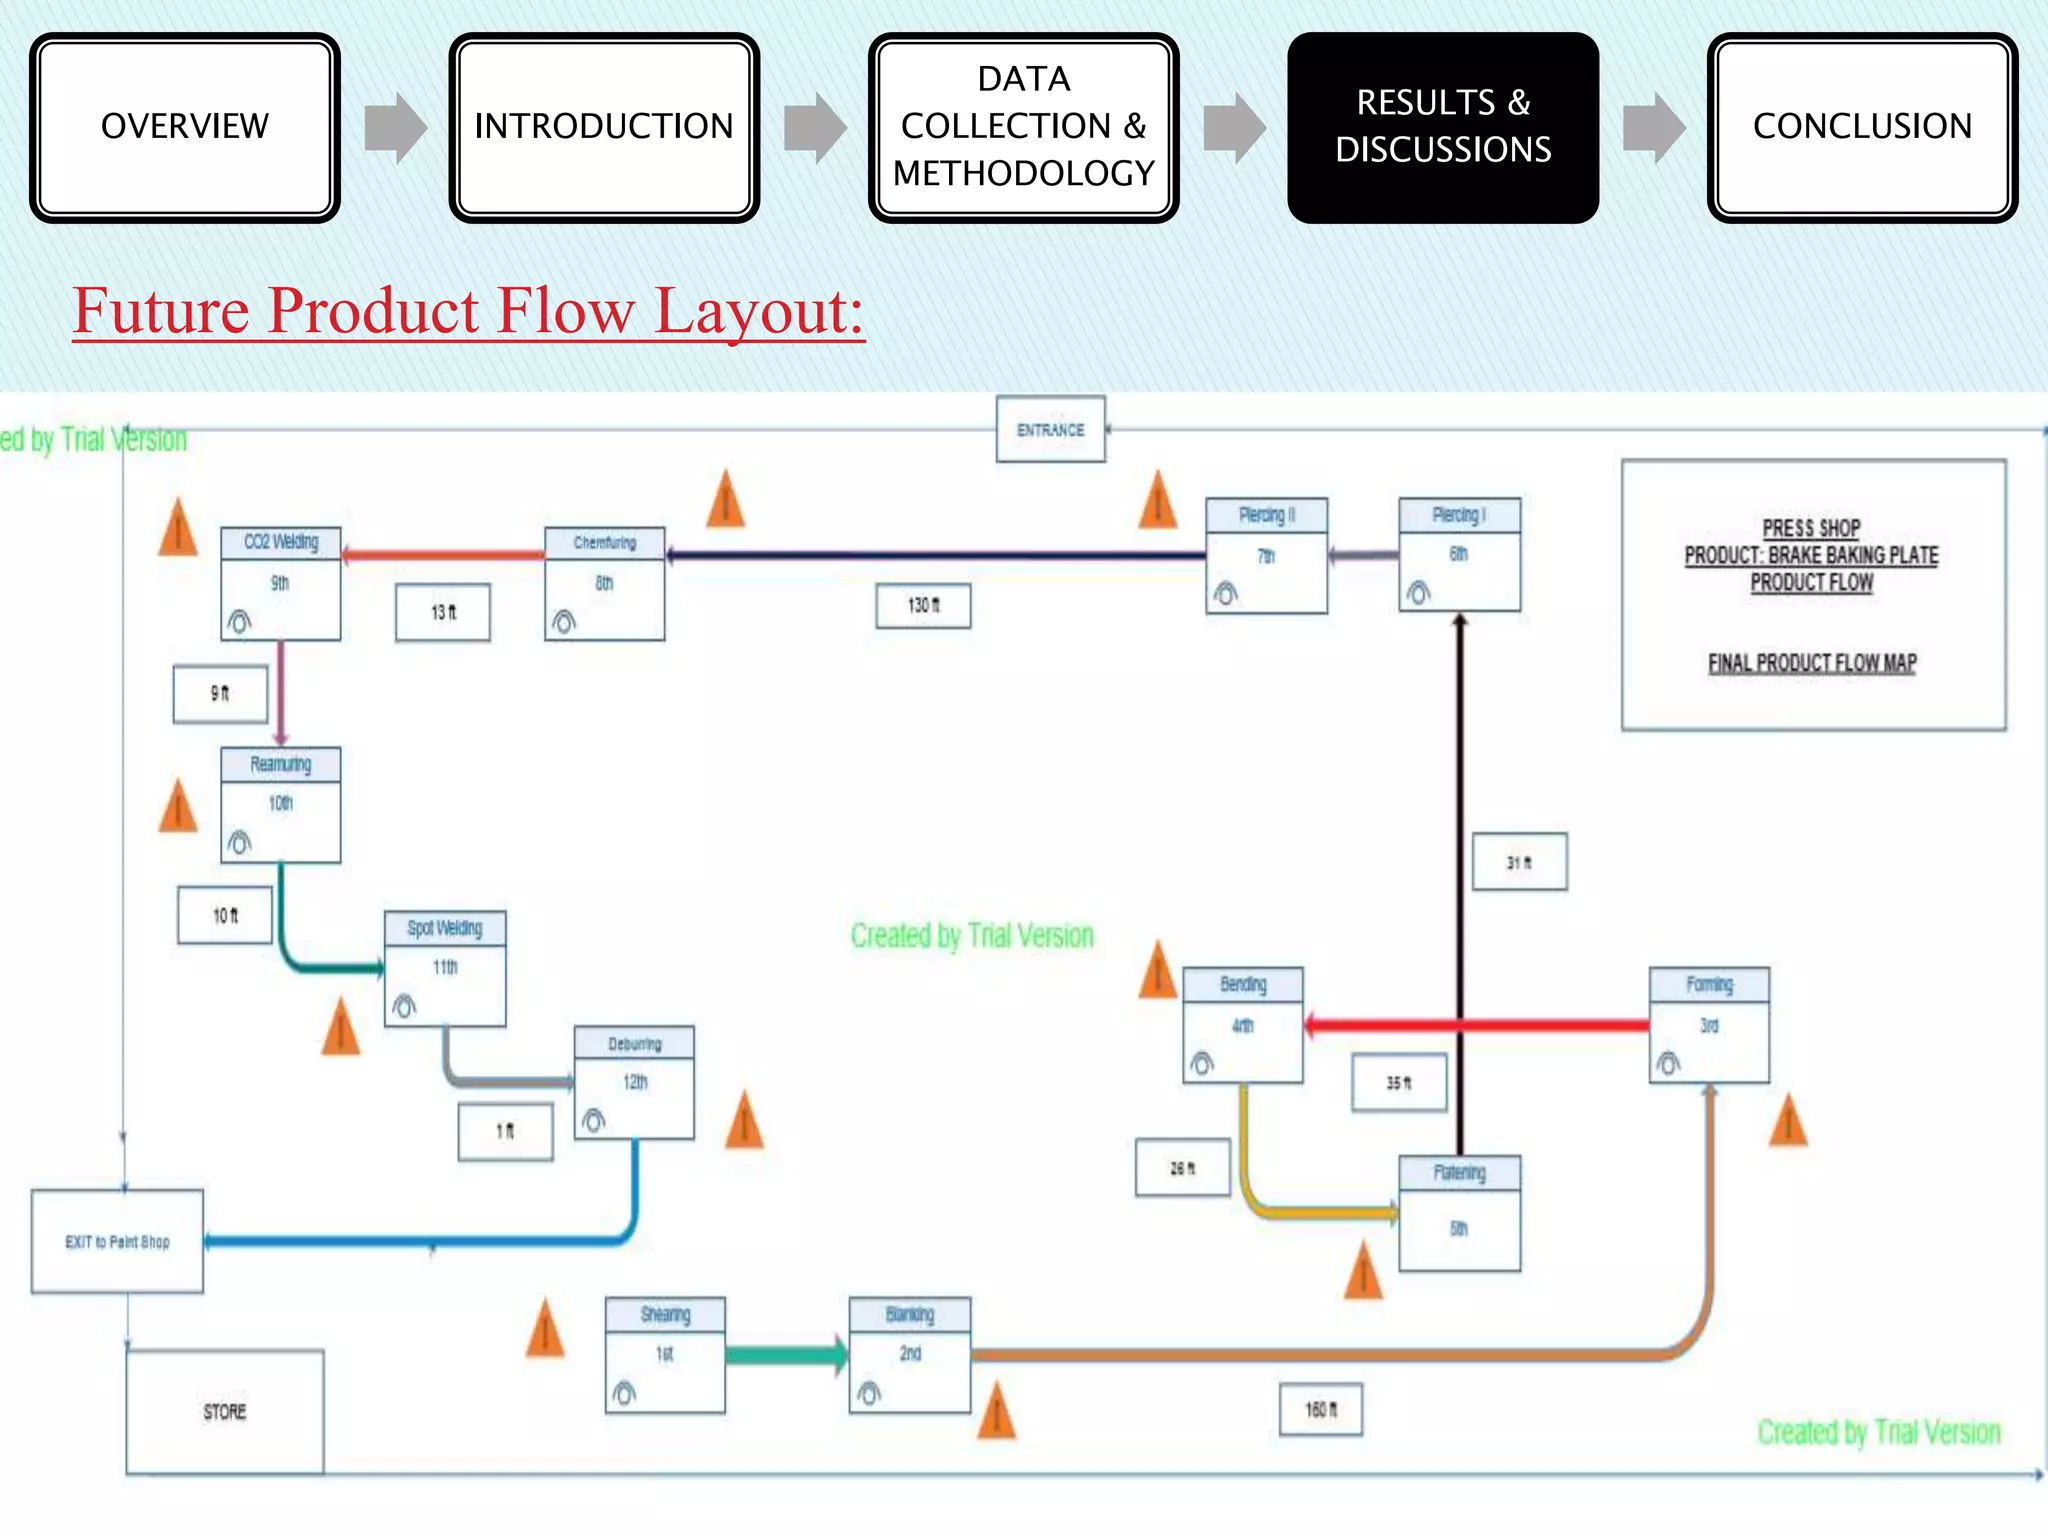
This document summarizes a project to reduce production lead time at a automotive parts manufacturing company using value stream mapping. It describes collecting data on current processes, creating a current state map showing a 12.6 hour lead time, identifying wastes like transportation delays, and proposing a future state map with a reduced 2.25 hour lead time through improvements like relocating machines, improved material handling, and adding a new welding machine. The project aimed to improve productivity, understand waste, and provide a plan for a more efficient lean production line.
Value stream mapping is a practical and highly effective way to learn to see and resolve disconnects, redundancies, and gaps in how work gets done.
This VSM project template helps you and your project team to put together a "storyboard" for effective presentation to your key stakeholders. It includes four key phases:
1) Define and pick product/service family
2) Create a current state map
3) Develop a future state map
4) Develop an implementation plan
This document consists of a VSM project template in Powerpoint format and a set of Excel templates comprising VSM charter, Results table, Implementation Plan and common VSM icons.
This presentation gives simple but effective techniques for mapping a business process. Process Mapping is a strong initial step in continuous improvement of any business process.
What is Value Stream Mapping?
History:
What is Value?
What is a Value Stream?
Different things flow through the Stream:
Reason for Mapping & Analysis :
Objectives:
Team Members and Roles in VSM Study Project:
How to create a Value Stream Mapping?:
Value Stream Mapping Process with example
Step 1 - Gather Data and Information:
Step 2 - Create a Current State Map
VSM Study Symbols:
Collecting Data and Time Studies in VSM Study:
Examples of data required in this study:
Process Steps in VSM Study:
Analysis of the Current State Map:
Step 3 – Future State Map & Action Plans:
Creating an Ideal and Future State
Analysis of Future State Map:
Step 4 – Execute the Plan:
Step 5 – Align & Analysis of Current and Future State:
Keys Points for Successful VSM Study:
Mouhcine NAHAL
The Training is a 1 day course covering impartation knowledge of Kaizen and its associated Tools and; -application of Lean concepts to lead Kaizen Workshop/s with Innovation Projects for Change in a World Class Manufacturing Environment.
This training aims to impart a systematic review on all the critical aspects of Lean use to; lead Kaizen workshop and presentation using Standardize Kaizen form and methodology with;
Innovation to be competitive in the Global Business Environment.
COURSE CONTENT
Kaizen, its definition and Principles
Kaizen definition, Innovation Definition
Kaizen vs Innovation
Characteristics of a Lean Factory
Cellular Factory Layout
Multi-skilled Operators
6S and Visual Control
Kanban and Supermarkets
Rapid Changeover
Total Quality Approach
Right-sized, flexible equipment
Water Strider
Moving Production Lines
Total Productive Maintenance
Continuous Improvement
The 3 Pillars of Kaizen
1. 6S (5+1S) Housekeeping
2. Waste Elimination
- Types of Waste CLOSEDMITT
- Valued-added vs Non-value
added
3. Standard Operation
Three factors that accounts the 3 Pillars Activities.
1. Visual management,
2. The role of the supervisor,
3. Importance of training and
creating a learning
organization.
Innovation & Workshop Projects
Types of Innovation in Kaizen. Why Innovation?
Degree of Innovation-the act of creating new products,
processes, ideas, etc...
Examples of Types of Innovation
Innovating Process using Typical Kaizen concepts (Lean
methods)
Phase 1: Pre-Planning for Innovation
Phase 2: Execution - Innovation Week
Role of Leader, Facilitator, Participant in Innovation
Projects
Innovation Projects Implementation using Kaizen Forms for:
Daily and Weekly Report Outs
Follow-up for further Innovation
This says about the basic concepts pertaining to Process Mapping and Value Stream Mapping , as an initiative towards Lean implemntation in Industrial environment.
A flowchart is an outline or schematic drawing of the process your team is trying to measure or improve. It can also be a picture of an ideal process that you would like to use.
I invite you to join as a member of the PEX Network Group http://tinyurl.com/3hwakem, you will have access to Key Leaders Globally, Events, Webinars, Presentations, Articles, Case Studies, Blog Discussions, White Papers, and Tools and Templates. To access this free content please take 2 minutes for a 1 time FREE registration at http://tiny.cc/tpkd0
Warm Regards,
Steven Bonacorsi, LSS MBB, President
International Standard for Lean Six Sigma
Cell: 603-401-7047
skype: sbonacorsi
E-mail: sbonacorsi@comcast.net
Twitter: http://twitter.com/Sbonacorsi (Follow Lean Six Sigma Content)
LinkedIn: http://www.linkedin.com/in/StevenBonacorsi
FREE Lean Six Sigma and BPM content - register at http://tiny.cc/tpkd0
More Information:
https://flevy.com/browse/business-document/lean-manufacturing-160
BENEFITS OF DOCUMENT
Learn how to eliminate waste to save time and make more money.
Learn how to apply simple Lean methods and tools in the workplace to improve productivity and quality.
DOCUMENT DESCRIPTION
Lean is a management philosophy based on the Toyota Production System (TPS). With Lean Manufacturing, you will be able to enhance value for your customers by improving and smoothing the process flow and eliminating waste. Simply put, with Lean, you will be able to increase productivity and create greater customer value with less resources.
By teaching this presentation, managers and employees will have a better understanding of the Lean principles and approach to eliminating waste, and will be more forthcoming to lead and participate in the Lean implementation process.
LEARNING OBJECTIVES
1. Understand the key concepts and principles of Lean
2. Acquire knowledge on the common Lean methods and tools and their applications to eliminate waste and create more value for customers
3. Identify ways to develop "Kaizen eyes" to look for improvement opportunities
4. Describe the various Lean roles
5. Define the critical success factors for sustaining a Lean culture
CONTENTS
1. Introduction to Lean Thinking
- The case for Lean Manufacturing
- Where did Lean originate?
- Toyota's philosophy
- Lean adoption in various environments
- Impact of Lean principles in industry
- Lean applications in manufacturing, process and service industries
- What is Lean?
- What Lean is not
- Traditional thinking versus Lean thinking
- Traditional culture vs. Lean culture
- Lean management framework
- Lean and six sigma
- Benefits of Lean manufacturing
Got a question about this presentation? Email us at support@flevy.com.
Lean Concepts "8 Forms of Waste Cause & Effect : How to Eliminate / Reduce Wa...SN Panigrahi, PMP
Lean Concepts "8 Forms of Waste Cause & Effect : How to Eliminate / Reduce Wastes" By SN Panigrahi
Lean Principles
Lean is a business philosophy, not just a tool set or method for improvement. This business philosophy was derived from Toyota experiences and in particular from its Toyota Production System (TPS).
The focus is on reducing waste in all business processes. The result is reduction of cost and lead-time as well as an increase in quality.
The seven wastes originated in Japan, where waste is known as “Muda."
"The seven wastes" is a tool to further categorize “Muda” and was originally developed by Toyota’s Chief Engineer Taiichi Ohno as the core of the Toyota Production System (TPS), also known as Lean Manufacturing.
Lean implementation focuses on Reducing the Seven (now expanded to 8 wastes) types of Waste (or Muda, which is the Japanese word for waste).
The 8th waste added is non-used employee talent (N), so that the 8 wastes can be easily remembered via the mnemonic “DOWN TIME” (Defective Production,Overproduction, Waiting, Non-used Employee Talent (the 8th form), Transportation, Inventory, Motion, and Excessive (Over) Processing)
Process planning SMED and VSM: Single minute exchange of die and Value stream...Yatinkumar Patel
in this presentation, two methods are described which is a very useful tool for process planning and production scheduling.
also, there are examples of this methods are well described.
Lean Value Stream Mapping (VSM) Training ModuleFrank-G. Adler
The Lean Value Stream Mapping (VSM) Training Module v8.0 includes:
1. MS PowerPoint Presentation including 154 slides covering History of Lean Manufacturing, Five Lean Principles, Seven Lean Wastes, A Step-by-Step Approach to Value Stream Mapping with Examples, Basic Lean Management Methods and Tools.
2. MS Excel Value Stream Mapping Team Charter Template
3. MS Excel Future State Transformation Plan Template
4. MS Excel Process Study Worksheet Template & Example, Work Chart Template, Work Combination Table Template & Example, and Process Capacity Worksheet Template & Example
In this presentation, Roni explains the basics of Kanban and the principles governing the application of Kanban for process improvement. We also look at a comparison between Scrum and Kanban and visit the basic differences between them.
It includes pointers telling what’s wrong with the current system, history of Kanban, introduction to Kanban, benefits of using Kanban, practices used in Kanban, principles of Kanban, how is Scrum different from Kanban. The tutorial begins with details about the current system and what’s wrong with it. It includes pointers like burnout, low throughput, unidentified bottlenecks, too much work which tell what’s wrong with the current system.
Followed by is a section about the history of Kanban which includes points like how the name originated, who discovered it, design, visual signals, based on which system. Resulting in an introduction section which talks about Kanban, what method it uses, scheduling system, what it consists of, amount of work, identification etc. Next comes the benefits section which includes the benefits of using Kanban like helps in visualizing the system, allows to evaluate, identify bottlenecks, establish trust in process etc.
Afterwards there is a section about Kanban practices. It includes practices used in Kanban like visualize, limit WIP in each phase of development, managing flow by keeping it under monitor, make policies explicit, improve collaboratively through the use of scientific models and some terms like lead time, cycle time, throughput etc. Moreover, it also includes the board for easy visualization, story card for keeping track, charts for measurement, control charts to measure average time taken for each task, cumulative flow diagrams showing relative amount of work.
Then comes the principles of Kanban. It includes principles which should be used in Kanban like agree to pursue incremental, evolutionary change, optimize what already exists, respect the current process, roles, responsibilities, leadership at all levels to empower the workforce to bring about change. The last section of this tutorial is Scrum vs Kanban. It explains how scrum is different from Kanban by giving pointers like Scrum prescribes roles, time boxed iterations, backlog items must fit, limit WIP in a different way. It also includes pointers giving reason why it shouldn’t matter because emphasis should be on the goal and not the tool.
Lean Manufacturing VSM Value Stream MappingLean Sigma
Para una empresa es crucial analizar la cadena de valor de sus procesos productivos de forma que se puedan identificar las pérdidas en dicha cadena para eliminarlas. De esta forma conseguiremos mayor beneficio en la producción. El VSM es una herramienta de análisis, consiste en plasmar en un documento todos los procesos productivos, todos los procesos informativos y asociarlos a sus tiempos.
Karen Martin, recognized expert on lean in office and administrative processes, shares instruction on applying value stream mapping to non-manufacturing organizations.
10 Things your Audience Hates About your PresentationStinson
See it with animations! https://vimeo.com/179236019
It’s impossible to win over an audience with a bad presentation. You might have the next big thing, but if your presentation falls flat, then so will your idea. While every audience is different, there are some universal cringe-worthy presentation mistakes that are all too common. Whether you’re an amateur or a seasoned presenter, you should always avoid this list of top 10 things your audience hates. Are you committing any of these 10 fatal presentation sins?
For more presentation help, visit stinsondesign.com/blog
Application of value stream mapping tool to reduce wastes in bearing industryijmech
In today’s highly competitive business environment, companies require improvement in Production Lead
Times, costs and customer service levels to survive. Because of this, companies have become more
customers focused. The result is that companies have been putting in significant effort to improve their
efficiency.
This paper present the practical application of Value Stream Mapping (VSM) tool implement in a bearing
industry. A value stream is an assortment of all actions (value added as well as non-value added) that are
required to bring a product through the essential flows, starting with raw material and ending with the
customer. For drawing current state value stream mapping, all relevant data has been collected and analyzed. Then analysis of current state map has been done for identifying non-value adding activities, in
other words waste and suggestions on how to remove or reduce different wastes. From the results achieved
by current VSM, it was observable that the two processes Annealing and CNC Machining have higher cycle
time and WIP. In order to increase their capacity, their cycle should be reduced.
By implementing some lean principles and changes in the production line, the future state map was created and the reduction the different types of wastes reduced. The total processing time was reduced from 409
seconds to 344 seconds.
Manufacturing Lead Time Reduction in Monoblock (SWJ) Pump Industry [irjet-v4 ...PERUMALSAMY M
Manufacturing lead time is the time required to produce product from its raw materials to final product.A company has to fulfill its customer needs to sustain in this competitive world. Lean has served the manufacturing sector with speed and quality. This project aims at lead time reduction in pump manufacturing company. Value Stream Map(VSM) served as an initiative for identifying bottlenecks process and waste in the manufacturing line; current state map is drawn by the observation made on the shop floor. The takt time is calculated for the demand to find out the bottleneck operations. After identifying the bottleneck operations line balancing is done. The Work In Process (WIP) inventory is reduced by balancing the workstation. Future state map is developed in the perspective of reduction of lead time and to match the takt time with bottleneck process. After line balancing implementation, the lead time for assembly of the SWJ pump is reduced 32 percent and work in process inventory is reduced 25 percent.
The Impact of Lean Production on the Cycle Time: A Case Study of a Welding As...ijsrd.com
The growing global competition is forcing the organisations to reduce the cost for increasing the profit. Lean manufacturing is a powerful tool for attaining this. The history of lean manufacturing starts from the craft production of 1900's. It is evolved through the contributions of F.W. Taylor, Henry Ford, Eiji Toyoda & Taiichi Ohno. The main concept of the lean manufacturing is the reduction in cost by eliminating waste. However, not all lean implementations have produced such results. In this study, a critical examination of lean manufacturing implementation experience at the welding department of a medium size industry located in Kerala, India. . Cycle time reduction is an important way by eliminating or reducing non-value-added activities. To reduce the overall cycle time of manufacturing, the cycle time of each sub-assembly needs to be reduced. Reducing cycle time will have a significant impact on a company's bottom line when implemented. The outcome of this study leads to substantial reduction in cycle time, reduced defects, better utilization of human resource and machines, and reduced cost of maintenance. It has been proved and validated by an empirical relation. The cause and effect diagram is used for analysing the cycle time reduction. The Quality control chart is also used. The improved return on investment (ROI) and reduction in cycle time shows the feasibility. The data for this study were obtained through interviews, Questionnaire survey and archival sources.
IMPROVING OSH & PRODUCTIVITY OF RMG INDUSTRIES BY IMPLEMENTING LEAN TOOLS AN...Karina Islam
The garment industry has played a pioneering role in the development of industrial sector of Bangladesh. The RMG sector is expected to grow despite the global financial crisis of 2009.As China is finding it challenging to make textile and foot wear items at cheap price, due to rising labor costs, many foreign investors, are coming to Bangladesh to take advantage of the low labor cost. Though Bangladesh produces garment with lowest cost but poor productivity. To survive and prosper in today's economic times, companies can no longer manage using financial measures alone, they have to track non-financial measures also such as customer satisfaction, brand preference, speed of response, employee satisfaction etc.Productivity can improve by applying lean tools like- 5s, JIT, Muda, Root Cause analysis, KPIs, VSM. For improving the ultimate productivity OHS of RMG sector of Bangladesh should be improved. In Ready Made Garments (RMG) sector of Bangladesh, the employees represent an organization's biggest and its most valuable asset. The company's productivity, and ultimately, its profitability depend on making sure all of its workers perform up to their full potential. This paper summarizes that how KPIs analysis improve productivity and OHS of RMG sectors. Appropriate indicators are first selected for KPI scoring then simulate the scores with the help of Adaptive Network-based Fuzzy Inference System (ANFIS) and finally illustrated how KPIs impacts on overall productivity.
M.tech (Production and Industrial Engineering) Thesis PresentationSanchit Jain
Presentation on - Improving System OEE in a French multinational using Lean Tools. OEE is redefined based on specific process parameters and is used as Key Performance Iindicator of improvement project.
5. OVERVIEW INTRODUCTION
DATA
COLLECTION &
METHODOLOGY
RESULTS &
DISCUSSIONS
CONCLUSION
Company Profile:
Alsons AutoParts (Pvt.) Ltd. Is an ISO 9001 and ISO-14001-2004 Certified
company which was established in 1988, and has become a leading name in
the Pakistan Automotive Industry.
6. Major Products:
Alsons AutoParts Pvt. Ltd. consists of three main products in their manufacturing
plant, which are given below;
Plastic Injection Moulding Products
OVERVIEW INTRODUCTION
DATA
COLLECTION &
METHODOLOGY
RESULTS &
DISCUSSIONS
CONCLUSION
7. Sheet Metal Products:
Automotive assembly products:
OVERVIEW INTRODUCTION
DATA
COLLECTION &
METHODOLOGY
RESULTS &
DISCUSSIONS
CONCLUSION
8. Existing Situation:
OVERVIEW INTRODUCTION
DATA
COLLECTION &
METHODOLOGY
RESULTS &
DISCUSSIONS
CONCLUSION
The existing situation of press shop is that they have a targeted schedule
of the production of 1200 plates daily for Suzuki with a Takt time of
0.375 min/pcs which is difficult to achieve so in order to meet the
customer demand they go for over time.
The company experiences the following issues in the manufacturing of
backing plate at press shop.
Lack of Traceability of product.
Greater lead-time.
Unnecessary stoppages
Greater Takt time
Issues:
9. INTRODUCTION:
Industries are in the favor to get more capital and resources to improve their
productivity.
It is necessary to optimize their capital, time and working environment. Industries
needed improvement tools to optimize its processes to attain more capable results.
Many improvement techniques and tools were developed and adapted to work in the
different types of business.
Now day’s industries focused on more production with higher efficiency in less lead
time. The companies focused mainly on customer satisfaction. In an increasingly
competitive environment, many manufacturing firms are looking for a winning card
over their competitor. Manufacturers have to understand that the conventional
production system has to connect with the lean tools and techniques.
Lean manufacturing system was developed by Toyota, Japan.
OVERVIEW INTRODUCTION
DATA
COLLECTION &
METHODOLOGY
RESULTS &
DISCUSSIONS
CONCLUSION
10. Project Background:
A shorter lead time results into better utilization of manufacturing resources,
quick adaptation to customer’s demand, reduced cost and better products.
Today companies are intensively indulging in activities to reduce their
production lead times.
Our Team, keeping in mind, the importance of a short lead time, therefore we
worked in Alsons AutoParts with the intention to reduce Production Lead time.
Technique that the team adopted was Value Stream Mapping .
Value stream mapping is the technique of Lean Manufacturing.
OVERVIEW INTRODUCTION
DATA
COLLECTION &
METHODOLOGY
RESULTS &
DISCUSSIONS
CONCLUSION
11. VALUE STREAM MAPPING:
Value Stream Mapping (VSM) tool shows all the activities, from supply to
final product through the different processing steps.In other words it is a
sketch of a production line.
Value stream map is the technique that bring the all processing steps at one
place. It shows the big picture of shop floor rather than individual processes
and improving the each area at the production line. It is used to draw
attention to different wastes and eliminating them in Future State Map.
It is necessary that every process as closely as possible produces only what
its customers need. The existing processes have some types the waste in a
production line which is the result of product design and machinery.
OVERVIEW INTRODUCTION
DATA
COLLECTION &
METHODOLOGY
RESULTS &
DISCUSSIONS
CONCLUSION
12. Lead Time:
• A lead time is the time interval between the initiation and
execution of a process.
• In industry, lead time reduction is an important part of lean manufacturing
OVERVIEW INTRODUCTION
DATA
COLLECTION &
METHODOLOGY
RESULTS &
DISCUSSIONS
CONCLUSION
13. Critical inputs for the VSM:
The following data are considered to be important in a value stream
mapping project.
• Cycle time
• Number of operators
• Waiting time
• Process time per shift
OVERVIEW INTRODUCTION
DATA
COLLECTION &
METHODOLOGY
RESULTS &
DISCUSSIONS
CONCLUSION
15. 1.Selection of the Product:
The selection of the product is very important step in Value Stream Mapping.
Baking plate is the critical product of the Alsons AutoParts due to its
requirement and demand by the Suzuki Automobiles.
There is the lack of traceability, scheduling, greater lead time, unnecessary
stoppages, etc. Due to these problems the completion of the customer
demand on time will be difficult.
After observing all these major issues which will directly effects the whole
production system .BAKING PLATE is our critical product for working for
the improvement
OVERVIEW INTRODUCTION
DATA
COLLECTION &
METHODOLOGY
RESULTS &
DISCUSSIONS
CONCLUSION
16. 2.Collection of Relevant Data:
OVERVIEW INTRODUCTION
DATA
COLLECTION &
METHODOLOGY
RESULTS &
DISCUSSIONS
CONCLUSION
I. Product flow within press shop.
II. Cycle time of each process.
III. Identification of bottlenecks.
IV. Transportation of product within press shop.
19. Flattening
It has the capacity of 960 pieces per shift which is a bottleneck for press
shop.
Reason:
Lack of trollies at the workstation, which stops the production after 100
pieces which creates bottleneck for production system.
OVERVIEW INTRODUCTION
DATA
COLLECTION &
METHODOLOGY
RESULTS &
DISCUSSIONS
CONCLUSION
20. Spot Welding:
It has the capacity of 450pieces/shift by each machine. Press
shop has 2 spot welding machines which produces 900 pieces
per shift.
OVERVIEW INTRODUCTION
DATA
COLLECTION &
METHODOLOGY
RESULTS &
DISCUSSIONS
CONCLUSION
21. IV. Transportation Method:
1-With the help of trollies.
2-Fork lifter.
3-Manual lifter
OVERVIEW INTRODUCTION
DATA
COLLECTION &
METHODOLOGY
RESULTS &
DISCUSSIONS
CONCLUSION
23. Description:
• The current state map shows that the backing plate has the
production lead time of 12.6 hours.
• It clearly shows the unwanted Waiting Time between each
workstation .
• It shows the big picture about the real time process &
performance of the production process.
OVERVIEW INTRODUCTION
DATA
COLLECTION &
METHODOLOGY
RESULTS &
DISCUSSIONS
CONCLUSION
24. 4.Identification the nature of wastes in the process:
OVERVIEW INTRODUCTION
DATA
COLLECTION &
METHODOLOGY
RESULTS &
DISCUSSIONS
CONCLUSION
Wastage of time:
• Un necessary usage of lifter between the process shearing &
blanking which causes delays in production up to 1 hour due to un
availability of lifter at the press shop.
• Lack of availability of trollies at each work station which causes
the process to stop & wait for the raw material inventory .
27. Description:
• Lead time reduced about 2.25 hours i.e. 20% reduction
which reduces the companies overtime cost.
• Reduced the transportation between the processes.
• Kaizen burst:
1)Machine Relocation
2)Material handling equipments
3)New machine.
OVERVIEW INTRODUCTION
DATA
COLLECTION &
METHODOLOGY
RESULTS &
DISCUSSIONS
CONCLUSION
28. 6.Suggestion for Improvements:
OVERVIEW INTRODUCTION
DATA
COLLECTION &
METHODOLOGY
RESULTS &
DISCUSSIONS
CONCLUSION
Ergonomic trollies should be used
which provides effective
transportation within press shop.
I. Material Handling Equipments
29. II.Machine Relocation:
Relocation of blanking machine near to shearing machine so that the
operation of lifter will be eliminate which reduces:
1- Transportation time.
2- Transportation cost.
3- Process waiting due to un availability of lifter.
OVERVIEW INTRODUCTION
DATA
COLLECTION &
METHODOLOGY
RESULTS &
DISCUSSIONS
CONCLUSION
30. III. New Machine
Another Spot Welding Machine should be install to fulfill the requirements.
Cooling system must be maintained properly for effective working.
Good quality electrodes will help to increase productivity & on time
delivery of products.
OVERVIEW INTRODUCTION
DATA
COLLECTION &
METHODOLOGY
RESULTS &
DISCUSSIONS
CONCLUSION
31. Conclusion:
The project was to reduce the production lead time, for this purpose the team
selected lean manufacturing tool Value Stream Mapping.
In addition to reduction of lead time, following benefits were expected after
the completion of the project.
Improved productivity
Determination of Value stream
Better understanding of Wastes and their causes
A roadmap towards an efficient, lean production line
OVERVIEW INTRODUCTION
DATA
COLLECTION &
METHODOLOGY
RESULTS &
DISCUSSIONS
CONCLUSION