SlideShare a Scribd company logo
www.sagecomputing.com.auwww.sagecomputing.com.au
Aspects of 10g TuningAspects of 10g Tuning
Penny Cookson - Managing Director
SAGE Computing ServicesSAGE Computing Services
Customised Oracle Training WorkshopsCustomised Oracle Training Workshops
and Consultingand Consulting
www.sagecomputing.com.auwww.sagecomputing.com.au
NZOUG Masterclass Series
www.sagecomputing.com.auwww.sagecomputing.com.au2
AgendaAgenda
Performance enhancements in 10g
Recommendations on gathering statistics
System Statistics
Identifying the problem
The Automatic Workload Repository
Identifying high resource SQL
Resolving SQL problems
Bind variables
SQL Tuning Advisor
SQL Access Advisor
Using wait events – Tuning I/O
Common tuning problems – examples
Using ADDM
www.sagecomputing.com.auwww.sagecomputing.com.au3
ApproachApproach
Identify tuning goals
Investigate problem
Consider alternative solutions
Implement chosen solution
Test against goals
www.sagecomputing.com.auwww.sagecomputing.com.au4
Performance Enhancements in 10g
www.sagecomputing.com.auwww.sagecomputing.com.au5
Rule BasedRule Based OptimiserOptimiser
ObsoleteObsolete
OPTIMIZER_MODE
ALL_ROWS
Throughput
FIRST_ROWS
Response
FIRST_ROWS_N
Response + I hate full scans
www.sagecomputing.com.auwww.sagecomputing.com.au6
Statistics GatheringStatistics Gathering
Number of INSERT, UPDATE, and DELETE operations
recorded
SELECT * FROM DBA_TAB_MODIFICATIONS
Automatic statistics gathered on STALE objects
Tables and indexes
Job Name = GATHER_STATS_JOB
Program =
DBMS_STATS.GATHER_DATABASE_STATS_JOB_PROC
Schedule = MAINTENANCE_WINDOW_GROUP
Nights and weekend
Can be disabled using EXECUTE
DBMS_SCHEDULER.DISABLE('GATHER_STATS_JOB');
www.sagecomputing.com.auwww.sagecomputing.com.au7
Statistics ManagementStatistics Management
Statistics history
Stored by default for a period of 31 days
If statistics_level is TYPICAL or ALL they are
purged automatically
DBA_OPTSTAT_OPERATIONS
USER_TAB_STATS_HISTORY
DBMS_STATS.ALTER_STATS_HISTORY_RETENTION
DBMS_STATS.PURGE_STATS
DBMS_STATS.RESTORE
DBMS_STATS.GET_STATS_HISTORY_AVAILABILTY
www.sagecomputing.com.auwww.sagecomputing.com.au8
Statistics ManagementStatistics Management
Ability to lock statistics
DBMS_STATS.LOCK_SCHEMA_STATS
DBMS_STATS.LOCK_TABLE_STATS
Statistics can be unlocked
DBMS_STATS.UNLOCK_SCHEMA_STATS
DBMS_STATS.UNLOCK_TABLE_STATS
Dynamic sampling
For very dynamic data or missing statstics
OPTIMIZER_DYNAMIC_SAMPLING
--+ DYNAMIC_SAMPLING(tablealias level)
Levels 0 to 10
www.sagecomputing.com.auwww.sagecomputing.com.au9
Gathering StatisticsGathering Statistics
Check that statistics are up to date on all objects
Create histograms on skewed columns
NO_INVALIDATE
GATHER_FIXED_OBJECTS_STATS
Keep multiple sets of statistics
METHOD_OPT parameter
FOR COLUMNS col1,col2 SIZE n
FOR ALL COLUMNS SIZE n
FOR ALL INDEXED COLUMNS SIZE n
integer Number of histogram buckets
REPEAT already have histograms
AUTO data distribution and workloa
SKEWONLY data distribution
www.sagecomputing.com.auwww.sagecomputing.com.au10
Manually Setting StatsManually Setting Stats
DBMS_STATS.SET_TABLE_STATS
Set table, column or index stats manually
Regathering will overwrite
Freezing fixes stats – won’t respond to
changes
Use only for jobs where data is very
volatile and a fixed result gives good
results
** But if its all working fine – why change
the statistics **
www.sagecomputing.com.auwww.sagecomputing.com.au11
TrcessTrcess
End to end tracing
trcsess used to consolidate a number of trace files
trcsess output=output_file
session=session_id e.g. 152.3 This is the SID and
SERIAL# from v$session
clientid=client_id
service=service_name
action=action_name
module=module_name
trace_files the * wildcard can be used
DBMS_MONITOR package can be used to gather statistics for a
specific Client ID, Service or service, module and action
DBMS_APPLICATION_INFO package can be used to set the
module and action from within an application
www.sagecomputing.com.auwww.sagecomputing.com.au12
New HintsNew Hints
Specify index with name or column
--+ INDEX(org (org_id name))
Use nested loop with a specific index
--+ USE_NL_WITH_INDEX (alias (indexname))
Name a query block
--+ QB_NAME (q1).
Do not perform query transformation
--+ NO_QUERY_TRANSFORMATION
Perform index skip scan
--+ INDEX_SS
www.sagecomputing.com.auwww.sagecomputing.com.au13
OtherOther
Global temporary table SYS.PLAN_TABLE$
Private outlines
Fast DUAL access
New tuning tools
New costing model
CPU + IO
Uses MBRC system parameter for full scans
Statistics with or without workload
www.sagecomputing.com.auwww.sagecomputing.com.au14
Cost ModelCost Model
Prior to Oracle 9i
Number of I/Os
Estimates of index blocks in memory
OPTIMIZER_INDEX_CACHING
Estimates of cost of index scan
OPTIMZER_INDEX_COST_ADJ
Oracle 9i
I/O plus CPU costing if system statistics gathered
Oracle 10g
CPU and I/O
System statistics or defaults
www.sagecomputing.com.auwww.sagecomputing.com.au15
Gathering System StatisticsGathering System Statistics
Workload statistics
CPUSPEEDNW, IOSEEKTIME, IOTFRSPEED
Noworkload statistics
SREADTIME, MREADTIME, CPUSPEED, MBRC,
SLAVETHR
Optimiser uses workload statistics if available
SYS.AUX_STATS$
Gather at times of representative workload
Daytime OLTP set
Nightime batch / reporting set
Import as required
www.sagecomputing.com.auwww.sagecomputing.com.au16
Gathering System StatisticsGathering System Statistics
DBMS_STATS.CREATE_STAT_TABLE
('SYS','OLTP_SYSSTAT','STAT_TS');
DBMS_STATS.GATHER_SYSTEM_STATS
( gathering_mode => 'INTERVAL',
interval => 2, stattab => 'OLTP_SYSSTAT',
statid => 'OLTP');
DBMS_STATS. DELETE_SYSTEM_STATS;
DBMS_STATS.IMPORT_SYSTEM_STATS
( stattab => 'OLTP_SYSSTAT', statid => 'OLTP', statown
=> 'SYS');
www.sagecomputing.com.auwww.sagecomputing.com.au17
Identifying the problem
www.sagecomputing.com.auwww.sagecomputing.com.au18
Identifying the ProblemIdentifying the Problem
Something is
wrong with the HR
application
User information
www.sagecomputing.com.auwww.sagecomputing.com.au19
Identifying the ProblemIdentifying the Problem
Something is
wrong with the
payroll run, its
taking much longer
than normal
Advanced user information
www.sagecomputing.com.auwww.sagecomputing.com.au20
Identifying the ProblemIdentifying the Problem
Possible problems
Application issues - Contention
High resource SQL – This is always the most likely
Database configuration
OS configuration
Tools
Wait events
the V$ tables
Tracing
Dictionary tables
Enterprise Manager
www.sagecomputing.com.auwww.sagecomputing.com.au21
Identifying the ProblemIdentifying the Problem
When does it happen
Current session
At specific times
All the time
What is the scope of the problem
Single user
Particular time/job
Overall performance
Has anything changed
www.sagecomputing.com.auwww.sagecomputing.com.au22
Trace 10046Trace 10046
Turn tracing on for the system (performance
overhead) or session
Identify location of user_dump_dest
Check max_dump_file_size
BEGIN
dbms_monitor.session_trace_enable(session_id=>130,
serial_num=>708, waits=>TRUE, binds=>TRUE);
END;
ALTER system set events
’10046 trace name context forever, level 12’
trcsess output=all_traces.trc service=ora10g *.trc
tkprof all_traces.trc all_traces.prf sort=execpu,
prscpu, fchcpu
www.sagecomputing.com.auwww.sagecomputing.com.au23
Format the trace file
www.sagecomputing.com.auwww.sagecomputing.com.au24
High Resource SQLHigh Resource SQL
V$SQL has buffer gets and physical reads for
statements in the SGA
V$SQL_PLAN has plans for statements in the SGA
Use V$SQLSTATS (10g Rel 2)
Row for unique combinations of SQL statement and
optimizer plan (SQL_ID and PLAN_HASH_VALUE)
Retained longer than V$SQL
Does not include SQL PROFILE or OUTLINE
dba_hist_sqlstat and dba_hist_sqltext have buffer
gets and physical reads for past statement
dba_hist_sql_plan has plans for past statement
dba_hist_optimizer_env
www.sagecomputing.com.auwww.sagecomputing.com.au25
AWR Data for HighAWR Data for High
Resource SQLResource SQL
Look for high buffer gets
SELECT s.snap_id, s.sql_id, s.buffer_gets_total, s.executions_total,
s.buffer_gets_total/NULLIF(executions_total,0) reads, t.sql_text
FROM dba_hist_sqlstat s, dba_hist_sqltext t
WHERE t.sql_id = s.sql_id
AND buffer_gets_total/NULLIF(executions_total,0) > 1000000
SNAP_ID SQL_ID BUFFER_GETS_TOTAL EXECUTIONS_TOTAL READS
---------- ------------- ----------------- ---------------- ----------
SQL_TEXT
---------------------------------------------------------------------------
824 3s0z04m9qdusq 4979957 1 4979957
insert into bookings_large
select booking_seq.nextval, mod(event2_seq.nextval,100000)+201,
resource_code, chargeable, made_by, quantity,
cost, status, comments
from bookings_large
www.sagecomputing.com.auwww.sagecomputing.com.au26
AWR Data for HighAWR Data for High
Resource SQLResource SQL
Find execution path
SELECT lpad(to_char(id),level) ID, parent_id PT,
decode(id,0,'Cost: '||cost,object_name) OB,
operation OP, rpad(options,30)|| rpad(access_predicates,30)||
rpad(filter_predicates,30) OT,
to_number(decode(id,0,null,position)) PS, cardinality CD
FROM dba_hist_sql_plan
CONNECT BY prior id = parent_id
AND sql_id = '&&sql_id'
START WITH parent_id is null
AND sql_id = '&&sql_id';
Id Par Object Operation Options Pos Rows
------ --- -------------- -------------------- ------------------------------ ---- ----------
0 Cost: 1322 INSERT STATEMENT
1 0 SEQUENCE 1
2 1 BOOKINGS_LARGE TABLE ACCESS FULL 1 810770
www.sagecomputing.com.auwww.sagecomputing.com.au27
Problems with a CurrentProblems with a Current
SessionSession
Find waiting sessions
SELECT sid, serial# , username, event,
blocking_session, seconds_in_wait, sql_id
FROM v$session
WHERE state = 'WAITING'
AND wait_class != 'Idle'
SID SERIAL# USERNAME EVENT BLOCKING_SESSION SECONDS_IN_WAIT SQL_ID
---- ------- ------- ----------------------------- ---------------- --------------- -------------
161 573 TRAIN enq: TX - row lock contention 130 1207 g3xry817zpwk3
www.sagecomputing.com.auwww.sagecomputing.com.au28
Problems with a CurrentProblems with a Current
SessionSession
Find the SQL the session is running
SELECT sql_text
FROM v$sql
WHERE sql_id = 'g3xry817zpwk3'
SQL_TEXT
-------------------------------------------------------------------
UPDATE events set start_date = start_date+1 WHERE event_no = :b1
We can find the SQL the blocker is
running but it may not be the blocking
statement
www.sagecomputing.com.auwww.sagecomputing.com.au29
Find Bind VariablesFind Bind Variables
SELECT value_string
FROM v$sql_bind_capture
WHERE sql_id='g3xry817zpwk3'
VALUE_STRING
----------------------------
100
Bind capture is disabled when
STATISTICS_LEVEL =BASIC
www.sagecomputing.com.auwww.sagecomputing.com.au30
Session ProblemsSession Problems
Currently waiting
V$SESSION_WAIT
V$SESSION
V$SESSION_WAIT_CLASS
Recent sessions
V$SESSION_WAIT_HISTORY
V$ACTIVE_SESSION_HISTORY
Current sessions
DBA_HIST_ACTIVE_SESSION_HISTORY
Past
sessions
V$SESS_TIME_MODEL
www.sagecomputing.com.auwww.sagecomputing.com.au31
Current Session ProblemsCurrent Session Problems
If there is no current wait check the
session’s wait classes
SELECT wait_class_id, wait_class#, wait_class,
total_waits, time_waited
FROM v$session_wait_class
WHERE sid=161
WAIT_CLASS_ID WAIT_CLASS# WAIT_CLASS TOTAL_WAITS TIME_WAITED
------------- ----------- -------------------- ----------- -----------
4217450380 1 Application 210 62654
3386400367 5 Commit 3 0
2723168908 6 Idle 25 545088
2000153315 7 Network 31 0
1740759767 8 User I/O 11 10
Locking
problem
www.sagecomputing.com.auwww.sagecomputing.com.au32
Problems with a CurrentProblems with a Current
SessionSession –– Example 2Example 2
Find waiting sessions
SELECT sid, serial# , username, event,
blocking_session, seconds_in_wait, sql_id
FROM v$session
WHERE state = 'WAITING'
AND wait_class != 'Idle'
SID SERIAL# USERNAME EVENT BLOCKING_SESSION SECONDS_IN_WAIT SQL_ID
--- ------- ---------- ------------------------ ---------------- --------------- ------------
130 708 TRAIN2 db file scattered read 0 3s0z04m9qdusq
www.sagecomputing.com.auwww.sagecomputing.com.au33
Current Session ProblemsCurrent Session Problems
Is this a one off event or a pattern
SELECT wait_class_id, wait_class#, wait_class,
total_waits, time_waited
FROM v$session_wait_class
WHERE sid=130
WAIT_CLASS# WAIT_CLASS TOTAL_WAITS TIME_WAITED
----------- -------------------- ----------- -----------
0 Other 309 670
1 Application 318 74379
2 Configuration 1233 9735
4 Concurrency 31 0
5 Commit 495 325
6 Idle 605 771174
7 Network 694 4
8 User I/O 21278 15526
9 System I/O 3099 4013
www.sagecomputing.com.auwww.sagecomputing.com.au34
Current Session ProblemsCurrent Session Problems
Last 10 waits
SELECT event#, event, wait_time, wait_count
FROM v$session_wait_history
WHERE sid = 130
EVENT# EVENT WAIT_TIME WAIT_COUNT
---------- ---------------------------------------- ---------- ----------
294 db file sequential read 1 1
586 SQL*Net message to client 0 1
590 SQL*Net message from client 6 1
586 SQL*Net message to client 0 1
590 SQL*Net message from client 2 1
586 SQL*Net message to client 0 1
590 SQL*Net message from client 0 1
586 SQL*Net message to client 0 1
294 db file sequential read 0 1
www.sagecomputing.com.auwww.sagecomputing.com.au35
Recent Session ProblemsRecent Session Problems
Active session history
SELECT sample_time, event, wait_time, time_waited
FROM v$active_session_history
WHERE session_id = 130
AND session_serial# = 708
ORDER BY sample_time
SAMPLE_TIME EVENT WAIT_TIME TIME_WAITED
------------------------------ ------------------------------ ---------- -----------
21-MAY-05 08.35.46.570 AM control file sequential read 0 24076
21-MAY-05 08.35.47.601 AM db file scattered read 117906 0
21-MAY-05 08.35.48.632 AM db file scattered read 117734 0
21-MAY-05 08.35.49.663 AM log file switch completion 0 278636
21-MAY-05 08.35.50.694 AM db file sequential read 169 0
21-MAY-05 08.35.51.725 AM db file scattered read 0 21938
21-MAY-05 08.35.52.757 AM db file scattered read 0 71240
21-MAY-05 08.35.53.788 AM db file sequential read 0 14740
21-MAY-05 08.35.54.819 AM db file sequential read 186 0
21-MAY-05 08.35.55.850 AM db file sequential read 0 140
21-MAY-05 08.36.26.785 AM db file scattered read 0 8894
21-MAY-05 08.36.27.816 AM db file scattered read 0 5867
21-MAY-05 08.36.28.848 AM db file scattered read 0 45020
www.sagecomputing.com.auwww.sagecomputing.com.au36
Current Session ProblemsCurrent Session Problems
Find where the session has spent its
time
SELECT stat_name, value
FROM v$sess_time_model
WHERE sid=130
STAT_NAME VALUE
-------------------------------------------------- ----------
DB time 1258404159
DB CPU 167882212
background elapsed time 0
background cpu time 0
sequence load elapsed time 80535063
parse time elapsed 15047886
hard parse elapsed time 8505043
sql execute elapsed time 1228185696
connection management call elapsed time 2375
failed parse elapsed time 174792
failed parse (out of shared memory) elapsed time 0
hard parse (sharing criteria) elapsed time 27209
hard parse (bind mismatch) elapsed time 411
PL/SQL execution elapsed time 996461
inbound PL/SQL rpc elapsed time 0
PL/SQL compilation elapsed time 359583
Java execution elapsed time 0
www.sagecomputing.com.auwww.sagecomputing.com.au37 www.sagecomputing.com.auwww.sagecomputing.com.au38
www.sagecomputing.com.auwww.sagecomputing.com.au39 www.sagecomputing.com.auwww.sagecomputing.com.au40
www.sagecomputing.com.auwww.sagecomputing.com.au41 www.sagecomputing.com.auwww.sagecomputing.com.au42
Fix the ProblemFix the Problem
Kill one of the sessions
Fix the application problem
Identify and fix the high resource
SQL
www.sagecomputing.com.auwww.sagecomputing.com.au43
Overall PerformanceOverall Performance
ProblemsProblems -- SourcesSources
Alert log
Wait events
Oracle 10g gathers comprehensive
statistics
Active session history
Time model
Metrics
OS statistics
www.sagecomputing.com.auwww.sagecomputing.com.au44
Wait EventsWait Events
Look for system wait classes
SELECT wait_class_id, wait_class#, wait_class,
total_waits, time_waited
FROM v$system_wait_class
WAIT_CLASS_ID WAIT_CLASS# WAIT_CLASS TOTAL_WAITS TIME_WAITED
------------- ----------- -------------------- ----------- -----------
1893977003 0 Other 6238 444427
4217450380 1 Application 26661 826816
3290255840 2 Configuration 2096 12605
3875070507 4 Concurrency 136 186
3386400367 5 Commit 8151 1930
2723168908 6 Idle 683331 197711587
2000153315 7 Network 205150 70
1740759767 8 User I/O 69290 57267
4108307767 9 System I/O 134573 57583
www.sagecomputing.com.auwww.sagecomputing.com.au45
Wait EventsWait Events
Look for system wait events - Application
SELECT e.event, e.total_waits, e.total_timeouts,
e.time_waited, average_wait
FROM v$system_event e, v$event_name n
WHERE n.event_id = e.event_id
AND n.wait_class# = 1 -- Application
EVENT TOTAL_WAITS TOTAL_TIMEOUTS TIME_WAITED AVERAGE_WAIT
------------------------------ ----------- -------------- ----------- ------------
enq: RO - fast object reuse 33 0 11 0
enq: TX - row lock contention 2690 2686 826242 307
SQL*Net break/reset to client 24110 0 566 0
www.sagecomputing.com.auwww.sagecomputing.com.au46
Wait EventsWait Events
Look for system wait events – User I/O
SELECT e.event, e.total_waits, e.total_timeouts,
e.time_waited, average_wait
FROM v$system_event e, v$event_name n
WHERE n.event_id = e.event_id
AND n.wait_class# = 8 -- User I/O
EVENT TOTAL_WAITS TOTAL_TIMEOUTS TIME_WAITED AVERAGE_WAIT
------------------------------ ----------- -------------- ----------- ------------
local write wait 7 0 0 0
read by other session 1 0 1 1
db file sequential read 58691 0 47970 1
db file scattered read 7424 0 8271 1
db file single write 151 0 14 0
db file parallel read 1 0 3 3
direct path read 1474 0 925 1
direct path read temp 102 0 25 0
direct path write 1473 0 160 0
direct path write temp 168 0 2 0
www.sagecomputing.com.auwww.sagecomputing.com.au47
Wait EventsWait Events
Look for system wait events – System I/O
SELECT e.event, e.total_waits, e.total_timeouts,
e.time_waited, average_wait
FROM v$system_event e, v$event_name n
WHERE n.event_id = e.event_id
AND n.wait_class# = 9 -- System I/O
EVENT TOTAL_WAITS TOTAL_TIMEOUTS TIME_WAITED AVERAGE_WAIT
------------------------------ ----------- -------------- ----------- ------------
ksfd: async disk IO 288 0 15 0
control file sequential read 13938 0 21111 2
control file single write 714 0 128 0
control file parallel write 26960 0 10292 0
recovery read 6 0 0 0
log file sequential read 378 0 350 1
log file single write 375 0 40 0
log file parallel write 51020 0 17352 0
db file parallel write 42478 0 8626 0
www.sagecomputing.com.auwww.sagecomputing.com.au48
Wait EventsWait Events
Look for distribution of wait times
One event with a long wait time could skew the
results
SELECT wait_time_milli, wait_count
FROM v$event_histogram
WHERE event = ‘enq: TX - row lock contention’
WAIT_TIME_MILLI WAIT_COUNT
--------------- ----------
1 0
2 0
4 0
8 0
16 0
32 0
64 0
128 2
256 2
512 0
1024 0
2048 1
4096 2685
www.sagecomputing.com.auwww.sagecomputing.com.au49
Wait EventsWait Events
Look for distribution of wait times
SELECT wait_time_milli, wait_count
FROM v$event_histogram
WHERE event = ‘db file sequential read’
WAIT_TIME_MILLI WAIT_COUNT
--------------- ----------
1 28683
2 1120
4 3017
8 6987
16 10667
32 5671
64 1933
128 391
256 197
512 28
1024 1
www.sagecomputing.com.auwww.sagecomputing.com.au50
Time ModelTime Model
Records where the database is
spending time
DB Time is overall database activity
time
ADDM’s goal is to minimise this
Look for high parse time as
proportion of SQL execution time
www.sagecomputing.com.auwww.sagecomputing.com.au51
Time ModelTime Model
Find where the system has spent its
time
SELECT stat_name, value
FROM v$sys_time_model
STAT_NAME VALUE
------------------------------------------------- ----------
DB time 1.0306E+10
DB CPU 526468001
background elapsed time 5488738125
background cpu time 496628001
sequence load elapsed time 80675372
parse time elapsed 71915940
hard parse elapsed time 60198409
sql execute elapsed time 1.0231E+10
connection management call elapsed time 1390986
failed parse elapsed time 302227
failed parse (out of shared memory) elapsed time 0
hard parse (sharing criteria) elapsed time 591387
hard parse (bind mismatch) elapsed time 294519
PL/SQL execution elapsed time 1031366155
inbound PL/SQL rpc elapsed time 0
PL/SQL compilation elapsed time 8411615
Java execution elapsed time 1037473
www.sagecomputing.com.auwww.sagecomputing.com.au52
MetricsMetrics
Calculated at intervals
V$SYSMETRIC
V$EVENTMETRIC
V$WAITCLASSMETRIC
V$FILEMETRIC
V$METRICNAME
www.sagecomputing.com.auwww.sagecomputing.com.au53
MetricsMetrics
Shows traditional hit ratios
SELECT metric_name, AVG(value), metric_unit
FROM v$sysmetric
WHERE metric_unit LIKE '%%' ESCAPE ''
GROUP BY metric_name, metric_unit
METRIC_NAME AVG(VALUE) METRIC_UNIT
----------------------------------- ---------- --------------------------------
User Limit % 0 % Sessions/License_Limit
PGA Cache Hit % 99 % Bytes/TotalBytes
Process Limit % 22 % Processes/Limit
Session Limit % 21 % Sessions/Limit
Soft Parse Ratio 75 % SoftParses/TotalParses
User Calls Ratio 25 % UserCalls/AllCalls
Memory Sorts Ratio 100 % MemSort/(MemSort + DiskSort)
Shared Pool Free % 12 % Free/Total
Row Cache Hit Ratio 100 % Hits/Gets
Row Cache Miss Ratio 0 % Misses/Gets
Buffer Cache Hit Ratio 100 % (LogRead - PhyRead)/LogRead
Cursor Cache Hit Ratio 0 % CursorCacheHit/SoftParse
Database CPU Time Ratio 84.5 % Cpu/DB_Time
Library Cache Hit Ratio 99 % Hits/Pins
User Commits Percentage 100 % (UserCommit/TotalUserTxn)
Database Wait Time Ratio 31 % Wait/DB_Time
Host CPU Utilization (%) 1 % Busy/(Idle+Busy)
Library Cache Miss Ratio 0 % Misses/Gets
Redo Allocation Hit Ratio 100 % (#Redo - RedoSpaceReq)/#Redo
User Rollbacks Percentage 0 % (UserRollback/TotalUserTxn)
Execute Without Parse Ratio 90 % (ExecWOParse/TotalExec)
www.sagecomputing.com.auwww.sagecomputing.com.au54
Click here to analyse the problem
www.sagecomputing.com.auwww.sagecomputing.com.au55 www.sagecomputing.com.auwww.sagecomputing.com.au56
www.sagecomputing.com.auwww.sagecomputing.com.au57
The Automatic Workload Repository
(AWR)
www.sagecomputing.com.auwww.sagecomputing.com.au58
AWRAWR
Persistent storage of system statistics
Active session history
V$tables
Plans
Automatic Database Diagnostic Monitor results
Gathered in memory and flushed to disk
by MMON
Purged every 7 days
Snapshots can be preserved
Check that AWR collection is not causing
library cache waits
www.sagecomputing.com.auwww.sagecomputing.com.au59
DBMS_WORKLOAD_REPOSITORYDBMS_WORKLOAD_REPOSITORY
Create an AWR snapshot
dbms_workload_repository.create_snapshot
Produce a report using two
snapshots
dbms_workload_repository.awr_report_html
dbms_workload_repository.awr_report_text
$ORACLE_HOME/rdbms/admin/awrrpt.sql
Create a baseline
dbms_workload_repository.create_baseline
www.sagecomputing.com.auwww.sagecomputing.com.au60
DBA_HIST…….DBA_HIST…….
DBA_HIST_DATABASE_INSTANCE
DBA_HIST_SNAPSHOT
DBA_HIST_SNAP_ERROR
DBA_HIST_BASELINE
DBA_HIST_WR_CONTROL
DBA_HIST_DATAFILE
DBA_HIST_FILESTATXS
DBA_HIST_TEMPFILE
DBA_HIST_TEMPSTATXS
DBA_HIST_SQLSTAT
DBA_HIST_SQLTEXT
DBA_HIST_SQL_SUMMARY
DBA_HIST_SQL_PLAN
DBA_HIST_SQLBIND
DBA_HIST_OPTIMIZER_ENV
DBA_HIST_EVENT_NAME
DBA_HIST_SYSTEM_EVENT
DBA_HIST_BG_EVENT_SUMMARY
DBA_HIST_WAITSTAT
DBA_HIST_ENQUEUE_STAT
DBA_HIST_LATCH_NAME
DBA_HIST_LATCH
DBA_HIST_LATCH_CHILDREN
DBA_HIST_LATCH_PARENT
DBA_HIST_LATCH_MISSES_SUMMARY
DBA_HIST_LIBRARYCACHE
DBA_HIST_DB_CACHE_ADVICE
DBA_HIST_BUFFER_POOL_STAT
DBA_HIST_ROWCACHE_SUMMARY
DBA_HIST_SGA
DBA_HIST_SGASTAT
DBA_HIST_PGASTAT
DBA_HIST_RESOURCE_LIMIT
DBA_HIST_SHARED_POOL_ADVICE
DBA_HIST_SQL_WORKAREA_HSTGRM
DBA_HIST_PGA_TARGET_ADVICE
DBA_HIST_INSTANCE_RECOVERY
DBA_HIST_JAVA_POOL_ADVICE
DBA_HIST_THREAD
DBA_HIST_STAT_NAME
DBA_HIST_SYSSTAT
DBA_HIST_SYS_TIME_MODEL
DBA_HIST_OSSTAT_NAME
DBA_HIST_OSSTAT
DBA_HIST_PARAMETER_NAME
DBA_HIST_PARAMETER
DBA_HIST_UNDOSTAT
DBA_HIST_SEG_STAT
DBA_HIST_SEG_STAT_OBJ
DBA_HIST_METRIC_NAME
DBA_HIST_SYSMETRIC_HISTORY
DBA_HIST_SYSMETRIC_SUMMARY
DBA_HIST_SESSMETRIC_HISTORY
DBA_HIST_FILEMETRIC_HISTORY
www.sagecomputing.com.auwww.sagecomputing.com.au61
AWR TablesAWR Tables
WRH$.... Tables
History of statistics
e.g. WRH$_SQLSTAT_BL
WRI$...... Tables
Advice/recommendation tables
e.g WRI$_ADV_RECOMMENDATIONS
WRM$...... Tables
Snapshot / baseline tables
e.g WRM$_SNAPSHOT
www.sagecomputing.com.auwww.sagecomputing.com.au62
www.sagecomputing.com.auwww.sagecomputing.com.au63 www.sagecomputing.com.auwww.sagecomputing.com.au64
www.sagecomputing.com.auwww.sagecomputing.com.au65 www.sagecomputing.com.auwww.sagecomputing.com.au66
www.sagecomputing.com.auwww.sagecomputing.com.au67
AWRAWR
Save snapshots for standard
work profiles
Use as a source for ADDM
Use as a baseline
Compare timelines
Create a SQL Tuning set from a
range of snapshots
www.sagecomputing.com.auwww.sagecomputing.com.au68
Resolving SQL Problems
www.sagecomputing.com.auwww.sagecomputing.com.au69
Tune the SQLTune the SQL –– First stepsFirst steps
Are statistics up to date?
Are histograms gathered on skewed
data?
Are system statistics collected?
Are the initialisation parameters
appropriate
Use trace 10053
www.sagecomputing.com.auwww.sagecomputing.com.au70
Tune the SQLTune the SQL –– Second stepsSecond steps
Use SQL Tuning Advisor
Use SQL Access Advisor
Consider rewriting the statement
Consider hints
Consider new indexes
Run the statement overnight
Consider materialised views
Consider partitioning
www.sagecomputing.com.auwww.sagecomputing.com.au71
Automatic SQL TuningAutomatic SQL Tuning
SQL Tuning Advisor
Optimiser runs in tuning mode
Takes more time to decide
Uses dynamic sampling
Uses partial execution
Uses past execution
Source can be:
Top SQL
Statement
SQL Tuning Set
Snapshot
Preserved snapshot set
www.sagecomputing.com.auwww.sagecomputing.com.au72
Automatic TuningAutomatic Tuning OptimiserOptimiser
Statistics
Recommendations to gather
Implement these and rerun
Create auxiliary statistics
SQL Profiles
Store auxiliary statistics
Verify and correct estimates
Complex predicates
Skewed join data
Sparse join data
Custom optimiser mode
Not run in limited mode
Rerun when significant data changes
www.sagecomputing.com.auwww.sagecomputing.com.au73
Automatic TuningAutomatic Tuning OptimiserOptimiser
Access path
Indexes
Only for this statement
SQL Structure
Changes to code
Datatype mismatches
UNION/UNION ALL
Modified columns
www.sagecomputing.com.auwww.sagecomputing.com.au74
Outlines v SQL ProfileOutlines v SQL Profile
From Oracle 10g
Stored as
supplementary
optimiser information
Plan may change
Applies to different
literals if
force_match=>TRUE
From Oracle 8i
Stored as a set of
hints
Plan will be static
Will not apply to
different literals
unless
CURSOR_SHARING=
SIMILAR or FORCE
on creation and use
Outline SQL Profile
www.sagecomputing.com.auwww.sagecomputing.com.au75
Outlines v SQL ProfileOutlines v SQL Profile
Outline SQL Profile
This is the
way you
must do it
If I provide you with
this information I’m
sure you’ll make the
right decision
www.sagecomputing.com.auwww.sagecomputing.com.au76
SQL ProfilesSQL Profiles
Automatic Tuning Optimiser
Uses execution history
Uses partial execution
Store auxiliary statistics
Store optimizer settings
Verify and correct estimates
Complex predicates
Skewed join data
Sparse join data
Rerun when significant data changes
Use SQLTUNE_CATEGORY to test
www.sagecomputing.com.auwww.sagecomputing.com.au77 www.sagecomputing.com.auwww.sagecomputing.com.au78
www.sagecomputing.com.auwww.sagecomputing.com.au79 www.sagecomputing.com.auwww.sagecomputing.com.au80
www.sagecomputing.com.auwww.sagecomputing.com.au81 www.sagecomputing.com.auwww.sagecomputing.com.au82
What Does the SQL Profile DoWhat Does the SQL Profile Do
SELECT rec_id, type
FROM dba_advisor_recommendations
WHERE task_name = 'STATEMENT1';
www.sagecomputing.com.auwww.sagecomputing.com.au83
What Does the SQL Profile DoWhat Does the SQL Profile Do
SELECT rec_id, message, attr1
FROM dba_advisor_rationale
WHERE task_name = 'STATEMENT1';
www.sagecomputing.com.auwww.sagecomputing.com.au84
www.sagecomputing.com.auwww.sagecomputing.com.au85
Identify the SQL ProfileIdentify the SQL Profile
SELECT name, signature, sql_text, status, force_matching
FROM dba_sql_profiles
www.sagecomputing.com.auwww.sagecomputing.com.au86
Check the Profile is UsedCheck the Profile is Used
SELECT sql_profile, sql_text
FROM v$sql
WHERE sql_profile is not null
www.sagecomputing.com.auwww.sagecomputing.com.au87
How a SQL Profile WorksHow a SQL Profile Works
Calculates Signature for statement
Strips spaces
Converts to upper case
SELECT *
FROM sql$
www.sagecomputing.com.auwww.sagecomputing.com.au88
How a SQL Profile WorksHow a SQL Profile Works
Profile attributes contain optimiser
information
SELECT *
FROM sqlprof$
www.sagecomputing.com.auwww.sagecomputing.com.au89
How a SQL Profile WorksHow a SQL Profile Works
Profile attributes contain optimiser
information
SELECT *
FROM sqlprof$attr
www.sagecomputing.com.auwww.sagecomputing.com.au90
Formatted Trace FileFormatted Trace File
www.sagecomputing.com.auwww.sagecomputing.com.au91
SQL ProfileSQL Profile -- ExampleExample
SELECT sql_text, sql_id, sql_profile, exact_matching_signature,
force_matching_signature
FROM v$sql WHERE upper(sql_text) like '%BOOKINGS%'
Both of these statements use the same profile
www.sagecomputing.com.auwww.sagecomputing.com.au92
BEGIN
dbms_sqltune.accept_sql_profile(task_name=>'STATEMENT1',
force_match=>TRUE);
END;
Use force_match to make literals behave like
bind variables
Handling LiteralsHandling Literals
www.sagecomputing.com.auwww.sagecomputing.com.au93
SELECT sql_text, sql_id, sql_profile, exact_matching_signature,
force_matching_signature
FROM v$sql WHERE upper(sql_text) like '%BOOKINGS%'
Both of these statements use the same profile
Handling LiteralsHandling Literals
www.sagecomputing.com.auwww.sagecomputing.com.au94
SQL ProfilesSQL Profiles -- CategoriesCategories
Accept profile in a category to test
DBMS_SQLTUNE.ACCEPT_SQL_PROFILE (
task_name => ‘Task_Name’,
category => ‘TEST_CATEGORY’)
Set the category for your session
ALTER SESSION SET
SQLTUNE_CATEGORY=‘TEST_CATEGORY’
Test the code
Reset the category
DBMS_SQLTUNE.ALTER_SQL_PROFILE (
name => ‘SQL_Profile_Name’,
attribute_name => ‘category’, value => ‘DEFAULT’);
www.sagecomputing.com.auwww.sagecomputing.com.au95
SQL ProfilesSQL Profiles –– Export/Export/ImprtImprt
Use staging table
dbms_sqltune.create_stgtab_sqlprof(
table_name=>'PROFILE_TEMP');
Add profile to staging table
dbms_sqltune.pack_stgtab_sqlprof (
profile_name => 'PROFILE1',
staging_table_name => 'PROFILE_TEMP');
Data pump
dbms_sqltune.unpack_stgtab_sqlprof(
staging_table_name => 'PROFILE_TEMP'
,REPLACE=>TRUE);
www.sagecomputing.com.auwww.sagecomputing.com.au96
SQL Access AdvisorSQL Access Advisor
Source can be:
Top SQL
SQL Tuning Set
Defined SQL
Schemas and/or tables
Filter by
Users
Tables
Top resource users
Module IDs
Actions
www.sagecomputing.com.auwww.sagecomputing.com.au97
SQL Access AdvisorSQL Access Advisor
Options
Define workload type
Include dropping indexes
Indexes
Materialised views
Both
Limited
Comprehensive
www.sagecomputing.com.auwww.sagecomputing.com.au98
www.sagecomputing.com.auwww.sagecomputing.com.au99 www.sagecomputing.com.auwww.sagecomputing.com.au100
www.sagecomputing.com.auwww.sagecomputing.com.au101 www.sagecomputing.com.auwww.sagecomputing.com.au102
www.sagecomputing.com.auwww.sagecomputing.com.au103 www.sagecomputing.com.auwww.sagecomputing.com.au104
www.sagecomputing.com.auwww.sagecomputing.com.au105
Wait Events
www.sagecomputing.com.auwww.sagecomputing.com.au106
Wait Event ClassesWait Event Classes
SELECT distinct wait_class#, wait_class
FROM v$event_name
ORDER BY wait_class#
WAIT_CLASS# WAIT_CLASS
----------- ----------------------------------
0 Other
1 Application
2 Configuration
3 Administrative
4 Concurrency
5 Commit
6 Idle
7 Network
8 User I/O
9 System I/O
10 Scheduler
11 Cluster
www.sagecomputing.com.auwww.sagecomputing.com.au107
Wait Event ClassesWait Event Classes
Application Includes locking problems
Configuration Database configuration problems
Administrative Caused by database administration
Concurrency Contention for buffers and latches
Commit log file synchronisation
Idle Waiting for something to do
Network Network delays
User I/O Disk read / write waits by users,
SMON and MMON
System I/O Disk read/ write waits by background
process except SMON and MMON
Scheduler Resource manager waits
Cluster RAC waits
Other Other insignificant waits www.sagecomputing.com.auwww.sagecomputing.com.au108
What Class is CausingWhat Class is Causing
WaitsWaits
SELECT wait_class_id, wait_class#, wait_class,
total_waits, time_waited
FROM v$system_wait_class
WAIT_CLASS_ID WAIT_CLASS# WAIT_CLASS TOTAL_WAITS TIME_WAITED
------------- ----------- ------------------------------ ----------- -----------
1893977003 0 Other 2000 52528
4217450380 1 Application 320 10
3290255840 2 Configuration 111 523
3875070507 4 Concurrency 765 3655
3386400367 5 Commit 527 385
2723168908 6 Idle 555098 11965178
2000153315 7 Network 526262 89
1740759767 8 User I/O 97884 120198
4108307767 9 System I/O 8699 6811
www.sagecomputing.com.auwww.sagecomputing.com.au109
User I/O EventsUser I/O Events
SELECT name
FROM v$event_name
WHERE wait_class# = 8
NAME
---------------------------
local write wait
buffer read retry
read by other session
db file sequential read
db file scattered read
db file single write
db file parallel read
direct path read
direct path read temp
direct path write
direct path write temp
BFILE read
www.sagecomputing.com.auwww.sagecomputing.com.au110
What Events are CausingWhat Events are Causing
User I/O WaitsUser I/O Waits
System wait events – User I/O
SELECT e.event, e.total_waits, e.total_timeouts,
e.time_waited, average_wait
FROM v$system_event e, v$event_name n
WHERE n.event_id = e.event_id
AND n.wait_class# = 8 – User I/O
EVENT TOTAL_WAITS TOTAL_TIMEOUTS TIME_WAITED AVERAGE_WAIT
------------------------- ----------- -------------- ----------- ------------
read by other session 45432 0 40824 1
db file sequential read 49525 0 74044 1
db file scattered read 3311 0 5610 2
db file single write 8 0 3 0
db file parallel read 1 0 1 1
direct path read 92 0 34 0
direct path read temp 6 0 0 0
direct path write 108 0 4 0
direct path write temp 35 0 0 0
www.sagecomputing.com.auwww.sagecomputing.com.au111
User I/O ClassUser I/O Class
db file sequential read
Single block IO
May be index access
db file scattered read
Multi block IO
Table full scan or index fast full scan
Sort operation
db file single write
Writing file headers
BFILE read
Waiting for read of external bfile
Direct path read and direct path read temp
Sort operations written to disk
Parrallel slaves
www.sagecomputing.com.auwww.sagecomputing.com.au112
What Objects are CausingWhat Objects are Causing
Sequential readsSequential reads
SELECT object_name, current_obj#, current_file#,
current_block#, wait_time, time_waited
FROM v$active_session_history h, dba_objects o
WHERE session_id = 141
AND session_serial# = 2
AND o.object_id = h.current_obj#
AND event = 'db file sequential read'
OBJECT_NAME CURRENT_OBJ# CURRENT_FILE# CURRENT_BLOCK# WAIT_TIME TIME_WAITED
--------------- ------------ ------------- -------------- ---------- -----------
BK_LG_EVTNO 54674 8 16442 0 2440
BK_LG_EVTNO 54674 8 16374 0 180
BOOKINGS_LARGE 54577 8 9645 0 20874
BOOKINGS_LARGE 54577 8 8904 0 63567
BOOKINGS_LARGE 54577 8 12850 0 6029
BOOKINGS_LARGE 54577 8 4011 0 13001
BK_LG_EVTNO 54674 8 16265 0 14899
BK_LG_EVTNO 54674 8 16229 0 173
BK_LG_EVTNO 54674 8 16216 0 14479
www.sagecomputing.com.auwww.sagecomputing.com.au113
ExampleExample –– Sequential ReadsSequential Reads
www.sagecomputing.com.auwww.sagecomputing.com.au114
www.sagecomputing.com.auwww.sagecomputing.com.au115 www.sagecomputing.com.auwww.sagecomputing.com.au116
www.sagecomputing.com.auwww.sagecomputing.com.au117 www.sagecomputing.com.auwww.sagecomputing.com.au118
www.sagecomputing.com.auwww.sagecomputing.com.au119 www.sagecomputing.com.auwww.sagecomputing.com.au120
www.sagecomputing.com.auwww.sagecomputing.com.au121 www.sagecomputing.com.auwww.sagecomputing.com.au122
TuningTuning –– Sequential ReadsSequential Reads
Abnormally high wait level may be an index
that should not be used
For table access
For nested loop join
Check
Statistics on the index are current
Optimiser mode is not FIRST_ROWS
Column has a histogram if data is skewed
There is not an old SQL*Profile
Bind peeking
If all this is OK – tune the SQL
www.sagecomputing.com.auwww.sagecomputing.com.au123
ExampleExample –– Scattered ReadsScattered Reads
DECLARE
v_1 VARCHAR2(4) := 'VCR1';
v_2 NUMBER;
BEGIN
SELECT count(b.comments)
INTO v_2
FROM bookings_large b
WHERE b.resource_code = v_1;
v_1 := 'PC1';
FOR counter IN 1..20 LOOP
SELECT count(b.comments)
INTO v_2
FROM bookings_large b
WHERE b.resource_code = v_1;
END LOOP;
END; www.sagecomputing.com.auwww.sagecomputing.com.au124
Skewed data + HistogramSkewed data + Histogram
SELECT resource_code, COUNT(*)
FROM bookings_large
GROUP BY resource_code
RESO COUNT(*)
---- ----------
BRLG 297763
BRSM 148879
CONF 99255
FLPC 99252
LNCH 148881
PC1 9629
TAP1 49626
VCR1 489252
VCR2 99255
SELECT endpoint_number, endpoint_value
FROM user_histograms
WHERE table_name = 'BOOKINGS_LARGE'
AND column_name = 'RESOURCE_CODE'
ENDPOINT_NUMBER ENDPOINT_VALUE
-------------- --------------
1198 3.4436E+35
1760 3.4436E+35
2124 3.4949E+35
2456 3.6501E+35
3040 3.9620E+35
3079 4.1675E+35
3279 4.3748E+35
5173 4.4790E+35
5554 4.4790E+35
www.sagecomputing.com.auwww.sagecomputing.com.au125 www.sagecomputing.com.auwww.sagecomputing.com.au126
www.sagecomputing.com.auwww.sagecomputing.com.au127 www.sagecomputing.com.auwww.sagecomputing.com.au128
www.sagecomputing.com.auwww.sagecomputing.com.au129
TuningTuning –– Scattered ReadsScattered Reads
Abnormally high levels may be a full scan of
large table
Check
Statistics on the table and indexes are current
System statistics are gathered
Column has a histogram if data is skewed
There is not an old SQL*Profile
Bind peeking
If all this is OK – tune the SQL
www.sagecomputing.com.auwww.sagecomputing.com.au130
Bind PeekingBind Peeking
Values of bind variable inspected on hard
parse
Subsequent executions use the same plan
If selective value first, subsequent executions
may use innapropriate index
If non selective value first, subsequent
executions may full scan
Set _optim_peek_user_binds to FALSE
www.sagecomputing.com.auwww.sagecomputing.com.au131
TuningTuning –– I/OI/O
Minimise I/O
Distribute I/O
Tune sorts
Tune buffer cache
Use KEEP buffer pool for
small scans on commonly used tables
tables with sequential reads and commonly used
data
Use RECYCLE buffer pool for
random access to large tables
www.sagecomputing.com.auwww.sagecomputing.com.au132
Common Tuning Problems - examples
www.sagecomputing.com.auwww.sagecomputing.com.au133 www.sagecomputing.com.auwww.sagecomputing.com.au134
www.sagecomputing.com.auwww.sagecomputing.com.au135 www.sagecomputing.com.auwww.sagecomputing.com.au136
www.sagecomputing.com.auwww.sagecomputing.com.au137
Wait EventWait Event ––
direct path read tempdirect path read temp
Blocks read directly to the user
Occurs when sorting performed on disk
Sort area determined:
By PGA_AGGREGATE target
By SORT_AREA_SIZE if manual
Default = 20% of SGA
Increase for DSS databases
www.sagecomputing.com.auwww.sagecomputing.com.au138
www.sagecomputing.com.auwww.sagecomputing.com.au139
Wait EventWait Event ––
buffer busy waitsbuffer busy waits
Wait for a specific buffer that someone else is
using
Another session may be reading the buffer in
Another session may have the block pinned in
the buffer
Index hot spots
Table insert hot spots
www.sagecomputing.com.auwww.sagecomputing.com.au140
www.sagecomputing.com.auwww.sagecomputing.com.au141 www.sagecomputing.com.auwww.sagecomputing.com.au142
www.sagecomputing.com.auwww.sagecomputing.com.au143
Find the ObjectFind the Object
SELECT object_name, current_obj#, current_file#, current_block#,
wait_time, time_waited
FROM v$active_session_history h, dba_objects o
WHERE o.object_id = h.current_obj#
AND event = 'buffer busy waits'
OBJECT_NAME CURRENT_OBJ# CURRENT_FILE# CURRENT_BLOCK# WAIT_TIME TIME_WAITED
--------------- ------------ ------------- -------------- ---------- -----------
BK_LG_EVTNO 54674 8 14477 0 391
BK_LG_EVTNO 54674 8 15194 17 0
BK_LG_EVTNO 54674 8 15294 1 0
BK_LG_EVTNO 54674 8 22947 0 281891
BK_LG_EVTNO 54674 8 16774 30 0
BK_RES2 54692 8 20465 0 1022386
BK_RES2 54692 8 21655 0 961881
BK_RES2 54692 8 21655 0 961218
BK_RES2 54692 8 21741 0 475933
BK_RES2 54692 8 21741 0 475356
BOOKINGS_LARGE 54577 8 20636 3 0
BOOKINGS_LARGE 54577 8 20746 0 1027986
BOOKINGS_LARGE 54577 8 20844 44 0
BOOKLG_PK 54578 8 19995 0 269731
BOOKLG_PK 54578 8 19995 0 269694
www.sagecomputing.com.auwww.sagecomputing.com.au144
Wait EventWait Event ––
buffer busy waitsbuffer busy waits
Automatic segment storage management
Freelists if not ASSM
Reverse key indexes
Hash Partitioning
Use automatic undo management
www.sagecomputing.com.auwww.sagecomputing.com.au145
Wait EventWait Event –– log bufferlog buffer
spacespace
Wait to write to the log buffer
I/O to the log file is not keeping up with write
requests to the buffer
Move log files to faster drives
Increase log buffer
www.sagecomputing.com.auwww.sagecomputing.com.au146
www.sagecomputing.com.auwww.sagecomputing.com.au147 www.sagecomputing.com.auwww.sagecomputing.com.au148
Wait EventWait Event –– log file synclog file sync
Wait class = Commit
Write redo information from log buffer to redo
log files
On user commit
Reduce commit frequency
Move redo log files to faster disk
www.sagecomputing.com.auwww.sagecomputing.com.au149
Wait EventWait Event –– log file parallellog file parallel
writewrite
Wait class = System I/O
LGWR waiting to write to redo log files
May occur in conjunction with log file synclog file sync
Move redo log files to faster disk
Don’t overdo number of redo group members
Reduce amount of redo
No logging
Global temporary tables
www.sagecomputing.com.auwww.sagecomputing.com.au150
Wait EventWait Event –– log file switchlog file switch
(archiving needed)
Required redo not finished being archived
Check alert log
Increase archiver processes
(checkpoint incomplete)
Required log needed to complete checkpoint
Check sufficient redo log files
(clearing log file)
Required logfile waiting to be cleared
(completion)
Normal log file switch not complete
www.sagecomputing.com.auwww.sagecomputing.com.au151 www.sagecomputing.com.auwww.sagecomputing.com.au152
Wait EventWait Event ––
library cache latch waitslibrary cache latch waits
Library cache latch taken to add new
statement
Reduce hard parsing
Use bind variables
Use cursor_sharing = SIMILAR
Consider increasing the SGA
www.sagecomputing.com.auwww.sagecomputing.com.au153
Wait EventWait Event ––
free buffer waitfree buffer wait
DBWR not keeping up
Look at wait events for DBWR
Optimise I/O
Buffer cache too big
Buffer cache too small
www.sagecomputing.com.auwww.sagecomputing.com.au154
Background ProcessesBackground Processes
SELECT program, serial#, sid
FROM v$session
WHERE program like 'ORACLE.EXE%'
PROGRAM SERIAL# SID
------------------------------ ---------- ----------
ORACLE.EXE (q002) 2208 128
ORACLE.EXE (MMNL) 1 156
ORACLE.EXE (MMON) 1 158
ORACLE.EXE (QMNC) 3 160
ORACLE.EXE (CJQ0) 1 163
ORACLE.EXE (RECO) 1 164
ORACLE.EXE (SMON) 1 165
ORACLE.EXE (CKPT) 1 166
ORACLE.EXE (LGWR) 1 167
ORACLE.EXE (DBW0) 1 168
ORACLE.EXE (MMAN) 1 169
ORACLE.EXE (PMON) 1 170
www.sagecomputing.com.auwww.sagecomputing.com.au155
Background ProcessBackground Process –– WaitWait
EventsEvents
SELECT event, wait_time, time_waited
FROM v$active_session_history
WHERE session_id = 168
AND session_serial# = 1
EVENT WAIT_TIME TIME_WAITED
------------------------------ ---------- -----------
rdbms ipc message 3078109 0
db file parallel write 0 1074
rdbms ipc message 3077900 0
rdbms ipc message 3077814 0
db file parallel write 0 68898
db file parallel write 0 2664
db file parallel write 0 62162
rdbms ipc message 3077741 0
rdbms ipc message 3077854 0
db file parallel write 0 5607
db file parallel write 0 166
db file parallel write 1596 0
db file parallel write 0 161
control file sequential read 222 0
control file sequential read 0 20607
control file sequential read 0 46275
control file sequential read 0 20838
www.sagecomputing.com.auwww.sagecomputing.com.au156
Using ADDM
www.sagecomputing.com.auwww.sagecomputing.com.au157
ADDMADDM
Automatic Database Diagnostic Monitor
Performs self diagnosis
Run for each AWR snapshot (hourly)
Aim is to reduce DB time
Identify bottlenecks
Make recommendations
Impact
Benefit
Action and rationale
STATISTICS_LEVEL TYPICAL or ALL www.sagecomputing.com.auwww.sagecomputing.com.au158
ADDMADDM
Hot objects
High resource SQL / PL/SQL / Java
Memory structures
I/O Performance
Log files / archiving / checkpoints
Contention
RAC issues
Documents wait classes not causing problems
www.sagecomputing.com.auwww.sagecomputing.com.au159
ADDM RecommendationsADDM Recommendations
Tune the SQL
Application changes
Use of bind variables
Sequence caching
Schema changes
Partitioning
Configuration
Changes to init parameters
Changes to file sizes
Hardware changes
www.sagecomputing.com.auwww.sagecomputing.com.au160
Accessed through EnterpriseAccessed through Enterprise
ManagerManager
View ADDM output for up to 7 days
www.sagecomputing.com.auwww.sagecomputing.com.au161
Accessed through EnterpriseAccessed through Enterprise
ManagerManager
View ADDM output for a snapshot
www.sagecomputing.com.auwww.sagecomputing.com.au162
ADDM AnalysisADDM Analysis
Perform analysis between two snapshots
No shutdown between snapshots
Run from Enterprise Manager
Run using
@$ORACLE_HOME/rdbms/admin/addmrpt.sql
Run using DBMS_ADVISOR
Produces report
Text
HTML
Results in the following views
DBA_ADVISOR_TASKS
DBA_ADVISOR_LOG
DBA_ADVISOR_RECOMMENDATIONS
DBA_ADVISOR_FINDINGS
www.sagecomputing.com.auwww.sagecomputing.com.au163
DBA_ADVISOR_FINDINGSDBA_ADVISOR_FINDINGS
Top 10 findings
SELECT type, message
FROM (SELECT type, message, count(*) num
FROM dba_advisor_findings
GROUP BY type, message
ORDER BY num desc)
WHERE rownum < 10
TYPE MESSAGE
------------ ---------------------------------------------------------------------------------------
SYMPTOM Wait class "User I/O" was consuming significant database time.
INFORMATION There was no significant database activity to run the ADDM.
PROBLEM SQL statements consuming significant database time were found.
PROBLEM Wait event "class slave wait" in wait class "Other" was consuming significant database
SYMPTOM Wait class "Other" was consuming significant database time.
PROBLEM PL/SQL execution consumed significant database time.
SYMPTOM The throughput of the I/O subsystem was significantly lower than expected.
PROBLEM Individual database segments responsible for significant user I/O wait were found.
PROBLEM Time spent on the CPU by the instance was responsible for a substantial part of databas
www.sagecomputing.com.auwww.sagecomputing.com.au164
www.sagecomputing.com.auwww.sagecomputing.com.au165
Thank You For Your Attention
Enquiries@sagecomputing.com.au
Any Questions?
SAGE Computing ServicesSAGE Computing Services
Customised Oracle Training WorkshopsCustomised Oracle Training Workshops
and Consultingand Consulting
www.sagecomputing.com.auwww.sagecomputing.com.au

More Related Content

What's hot

Automated Testing with CMake, CTest and CDash
Automated Testing with CMake, CTest and CDashAutomated Testing with CMake, CTest and CDash
Automated Testing with CMake, CTest and CDash
Richard Thomson
 
Introduction to Parallel Execution
Introduction to Parallel ExecutionIntroduction to Parallel Execution
Introduction to Parallel Execution
Doug Burns
 
Oracle 12c Automatic Data Optimization (ADO) - ILM
Oracle 12c Automatic Data Optimization (ADO) - ILMOracle 12c Automatic Data Optimization (ADO) - ILM
Oracle 12c Automatic Data Optimization (ADO) - ILM
Monowar Mukul
 
Chef patterns
Chef patternsChef patterns
Chef patterns
Biju Nair
 
MySQL Document Store
MySQL Document StoreMySQL Document Store
MySQL Document Store
I Goo Lee
 
你所不知道的Oracle后台进程Smon功能
你所不知道的Oracle后台进程Smon功能你所不知道的Oracle后台进程Smon功能
你所不知道的Oracle后台进程Smon功能
maclean liu
 
Flashback (Practical Test)
Flashback (Practical Test)Flashback (Practical Test)
Flashback (Practical Test)Anar Godjaev
 
Fatkulin presentation
Fatkulin presentationFatkulin presentation
Fatkulin presentationEnkitec
 
Optimizer Cost Model MySQL 5.7
Optimizer Cost Model MySQL 5.7Optimizer Cost Model MySQL 5.7
Optimizer Cost Model MySQL 5.7
I Goo Lee
 
Introduction to MySQL InnoDB Cluster
Introduction to MySQL InnoDB ClusterIntroduction to MySQL InnoDB Cluster
Introduction to MySQL InnoDB Cluster
I Goo Lee
 
제 8회 엑셈 수요 세미나 자료 연구컨텐츠팀
제 8회 엑셈 수요 세미나 자료 연구컨텐츠팀제 8회 엑셈 수요 세미나 자료 연구컨텐츠팀
제 8회 엑셈 수요 세미나 자료 연구컨텐츠팀
EXEM
 
Rac 12c optimization
Rac 12c optimizationRac 12c optimization
Rac 12c optimization
Riyaj Shamsudeen
 
Parallel Query in AWS Aurora MySQL
Parallel Query in AWS Aurora MySQLParallel Query in AWS Aurora MySQL
Parallel Query in AWS Aurora MySQL
Mydbops
 
collectd & PostgreSQL
collectd & PostgreSQLcollectd & PostgreSQL
collectd & PostgreSQL
Mark Wong
 
Performance tuning a quick intoduction
Performance tuning   a quick intoductionPerformance tuning   a quick intoduction
Performance tuning a quick intoduction
Riyaj Shamsudeen
 
301 Rac
301 Rac301 Rac
Oracle 10g Performance: chapter 00 sampling
Oracle 10g Performance: chapter 00 samplingOracle 10g Performance: chapter 00 sampling
Oracle 10g Performance: chapter 00 samplingKyle Hailey
 
Amazon aurora 1
Amazon aurora 1Amazon aurora 1
Amazon aurora 1
EXEM
 
12c database migration from ASM storage to NON-ASM storage
12c database migration from ASM storage to NON-ASM storage12c database migration from ASM storage to NON-ASM storage
12c database migration from ASM storage to NON-ASM storage
Monowar Mukul
 

What's hot (20)

Automated Testing with CMake, CTest and CDash
Automated Testing with CMake, CTest and CDashAutomated Testing with CMake, CTest and CDash
Automated Testing with CMake, CTest and CDash
 
Introduction to Parallel Execution
Introduction to Parallel ExecutionIntroduction to Parallel Execution
Introduction to Parallel Execution
 
Oracle 12c Automatic Data Optimization (ADO) - ILM
Oracle 12c Automatic Data Optimization (ADO) - ILMOracle 12c Automatic Data Optimization (ADO) - ILM
Oracle 12c Automatic Data Optimization (ADO) - ILM
 
Chef patterns
Chef patternsChef patterns
Chef patterns
 
MySQL Document Store
MySQL Document StoreMySQL Document Store
MySQL Document Store
 
你所不知道的Oracle后台进程Smon功能
你所不知道的Oracle后台进程Smon功能你所不知道的Oracle后台进程Smon功能
你所不知道的Oracle后台进程Smon功能
 
Flashback (Practical Test)
Flashback (Practical Test)Flashback (Practical Test)
Flashback (Practical Test)
 
Fatkulin presentation
Fatkulin presentationFatkulin presentation
Fatkulin presentation
 
Optimizer Cost Model MySQL 5.7
Optimizer Cost Model MySQL 5.7Optimizer Cost Model MySQL 5.7
Optimizer Cost Model MySQL 5.7
 
Introduction to MySQL InnoDB Cluster
Introduction to MySQL InnoDB ClusterIntroduction to MySQL InnoDB Cluster
Introduction to MySQL InnoDB Cluster
 
제 8회 엑셈 수요 세미나 자료 연구컨텐츠팀
제 8회 엑셈 수요 세미나 자료 연구컨텐츠팀제 8회 엑셈 수요 세미나 자료 연구컨텐츠팀
제 8회 엑셈 수요 세미나 자료 연구컨텐츠팀
 
Rac 12c optimization
Rac 12c optimizationRac 12c optimization
Rac 12c optimization
 
Parallel Query in AWS Aurora MySQL
Parallel Query in AWS Aurora MySQLParallel Query in AWS Aurora MySQL
Parallel Query in AWS Aurora MySQL
 
collectd & PostgreSQL
collectd & PostgreSQLcollectd & PostgreSQL
collectd & PostgreSQL
 
Performance tuning a quick intoduction
Performance tuning   a quick intoductionPerformance tuning   a quick intoduction
Performance tuning a quick intoduction
 
301 Rac
301 Rac301 Rac
301 Rac
 
Oracle 10g Performance: chapter 00 sampling
Oracle 10g Performance: chapter 00 samplingOracle 10g Performance: chapter 00 sampling
Oracle 10g Performance: chapter 00 sampling
 
Spark_Documentation_Template1
Spark_Documentation_Template1Spark_Documentation_Template1
Spark_Documentation_Template1
 
Amazon aurora 1
Amazon aurora 1Amazon aurora 1
Amazon aurora 1
 
12c database migration from ASM storage to NON-ASM storage
12c database migration from ASM storage to NON-ASM storage12c database migration from ASM storage to NON-ASM storage
12c database migration from ASM storage to NON-ASM storage
 

Viewers also liked

chỗ nào thiết kế tvc quảng cáo tốt nhất
chỗ nào thiết kế tvc quảng cáo tốt nhấtchỗ nào thiết kế tvc quảng cáo tốt nhất
chỗ nào thiết kế tvc quảng cáo tốt nhấtimelda379
 
Wildlife specialist performance appraisal
Wildlife specialist performance appraisalWildlife specialist performance appraisal
Wildlife specialist performance appraisal
jayschwandt06
 
Illy Red Icons
Illy Red IconsIlly Red Icons
Illy Red Icons
Matteo Losi
 
Media specialist performance appraisal
Media specialist performance appraisalMedia specialist performance appraisal
Media specialist performance appraisal
jasonlugar
 
Esglesies de sant pere
Esglesies de sant pereEsglesies de sant pere
Esglesies de sant pere
Lucia Campos Cobo
 
CV Alfonso de Castro 05-2015
CV Alfonso de Castro 05-2015CV Alfonso de Castro 05-2015
CV Alfonso de Castro 05-2015Alfonso de Castro
 
Wknj2
Wknj2Wknj2
Wknj2
erika0104
 
Балапан тобында өткізген сабақтар
Балапан тобында өткізген сабақтарБалапан тобында өткізген сабақтар
Балапан тобында өткізген сабақтар
Bilim All
 
Gost r 50571.8 94 2
Gost r 50571.8 94 2Gost r 50571.8 94 2
Gost r 50571.8 94 2
Raphael254
 
Annenberg Digital Lounge, Spring 2016 Report
Annenberg Digital Lounge, Spring 2016 ReportAnnenberg Digital Lounge, Spring 2016 Report
Annenberg Digital Lounge, Spring 2016 Report
Courtney Miller
 
Dinga Fishing Tackle Store - July Sale 2015
Dinga Fishing Tackle Store - July Sale 2015Dinga Fishing Tackle Store - July Sale 2015
Dinga Fishing Tackle Store - July Sale 2015
Gordon Balcomb
 
Tips for finding your first apartment
Tips for finding your first apartmentTips for finding your first apartment
Tips for finding your first apartment
College Annex LLC
 
Bitacora de abril mayo jun y julio 2015
Bitacora de  abril mayo jun y julio 2015Bitacora de  abril mayo jun y julio 2015
Bitacora de abril mayo jun y julio 2015
Jesus Ricardo Cordova Arias
 
Aussie Real-estate buying price (no debt) to return
Aussie Real-estate buying price (no debt) to returnAussie Real-estate buying price (no debt) to return
Aussie Real-estate buying price (no debt) to returnPetros Perimenis
 
Зелені хутори таврії
Зелені хутори тавріїЗелені хутори таврії
Зелені хутори таврії
Irina Davydova
 

Viewers also liked (18)

Grammar book
Grammar bookGrammar book
Grammar book
 
chỗ nào thiết kế tvc quảng cáo tốt nhất
chỗ nào thiết kế tvc quảng cáo tốt nhấtchỗ nào thiết kế tvc quảng cáo tốt nhất
chỗ nào thiết kế tvc quảng cáo tốt nhất
 
Wildlife specialist performance appraisal
Wildlife specialist performance appraisalWildlife specialist performance appraisal
Wildlife specialist performance appraisal
 
Infa sem 2
Infa sem 2Infa sem 2
Infa sem 2
 
Illy Red Icons
Illy Red IconsIlly Red Icons
Illy Red Icons
 
Media specialist performance appraisal
Media specialist performance appraisalMedia specialist performance appraisal
Media specialist performance appraisal
 
Esglesies de sant pere
Esglesies de sant pereEsglesies de sant pere
Esglesies de sant pere
 
CV Alfonso de Castro 05-2015
CV Alfonso de Castro 05-2015CV Alfonso de Castro 05-2015
CV Alfonso de Castro 05-2015
 
Wknj2
Wknj2Wknj2
Wknj2
 
Балапан тобында өткізген сабақтар
Балапан тобында өткізген сабақтарБалапан тобында өткізген сабақтар
Балапан тобында өткізген сабақтар
 
Gost r 50571.8 94 2
Gost r 50571.8 94 2Gost r 50571.8 94 2
Gost r 50571.8 94 2
 
Annenberg Digital Lounge, Spring 2016 Report
Annenberg Digital Lounge, Spring 2016 ReportAnnenberg Digital Lounge, Spring 2016 Report
Annenberg Digital Lounge, Spring 2016 Report
 
Dinga Fishing Tackle Store - July Sale 2015
Dinga Fishing Tackle Store - July Sale 2015Dinga Fishing Tackle Store - July Sale 2015
Dinga Fishing Tackle Store - July Sale 2015
 
Tips for finding your first apartment
Tips for finding your first apartmentTips for finding your first apartment
Tips for finding your first apartment
 
Bitacora de abril mayo jun y julio 2015
Bitacora de  abril mayo jun y julio 2015Bitacora de  abril mayo jun y julio 2015
Bitacora de abril mayo jun y julio 2015
 
Aussie Real-estate buying price (no debt) to return
Aussie Real-estate buying price (no debt) to returnAussie Real-estate buying price (no debt) to return
Aussie Real-estate buying price (no debt) to return
 
Ajay_K_K FINAL
Ajay_K_K FINALAjay_K_K FINAL
Ajay_K_K FINAL
 
Зелені хутори таврії
Зелені хутори тавріїЗелені хутори таврії
Зелені хутори таврії
 

Similar to Aspects of 10 Tuning

Whose fault is it? - a review of application tuning problems
Whose fault is it? - a review of application tuning problemsWhose fault is it? - a review of application tuning problems
Whose fault is it? - a review of application tuning problems
Sage Computing Services
 
Tony Jambu (obscure) tools of the trade for tuning oracle sq ls
Tony Jambu   (obscure) tools of the trade for tuning oracle sq lsTony Jambu   (obscure) tools of the trade for tuning oracle sq ls
Tony Jambu (obscure) tools of the trade for tuning oracle sq lsInSync Conference
 
How Can I tune it When I Can't Change the Code?
How Can I tune it When I Can't Change the Code?How Can I tune it When I Can't Change the Code?
How Can I tune it When I Can't Change the Code?
Sage Computing Services
 
22-4_PerformanceTuningUsingtheAdvisorFramework.pdf
22-4_PerformanceTuningUsingtheAdvisorFramework.pdf22-4_PerformanceTuningUsingtheAdvisorFramework.pdf
22-4_PerformanceTuningUsingtheAdvisorFramework.pdf
yishengxi
 
Dimensional performance benchmarking of SQL
Dimensional performance benchmarking of SQLDimensional performance benchmarking of SQL
Dimensional performance benchmarking of SQL
Brendan Furey
 
Oracle audit and reporting in one hour or less
Oracle audit and reporting in one hour or lessOracle audit and reporting in one hour or less
Oracle audit and reporting in one hour or less
Leon Rzhemovskiy
 
Tony jambu (obscure) tools of the trade for tuning oracle sq ls
Tony jambu   (obscure) tools of the trade for tuning oracle sq lsTony jambu   (obscure) tools of the trade for tuning oracle sq ls
Tony jambu (obscure) tools of the trade for tuning oracle sq ls
InSync Conference
 
Enhancements that will make your sql database roar sp1 edition sql bits 2017
Enhancements that will make your sql database roar sp1 edition sql bits 2017Enhancements that will make your sql database roar sp1 edition sql bits 2017
Enhancements that will make your sql database roar sp1 edition sql bits 2017
Bob Ward
 
Sherlock holmes for dba’s
Sherlock holmes for dba’sSherlock holmes for dba’s
Sherlock holmes for dba’s
Kellyn Pot'Vin-Gorman
 
Advanced tips for making Oracle databases faster
Advanced tips for making Oracle databases fasterAdvanced tips for making Oracle databases faster
Advanced tips for making Oracle databases faster
SolarWinds
 
Your tuning arsenal: AWR, ADDM, ASH, Metrics and Advisors
Your tuning arsenal: AWR, ADDM, ASH, Metrics and AdvisorsYour tuning arsenal: AWR, ADDM, ASH, Metrics and Advisors
Your tuning arsenal: AWR, ADDM, ASH, Metrics and Advisors
John Kanagaraj
 
Common schema my sql uc 2012
Common schema   my sql uc 2012Common schema   my sql uc 2012
Common schema my sql uc 2012Roland Bouman
 
Common schema my sql uc 2012
Common schema   my sql uc 2012Common schema   my sql uc 2012
Common schema my sql uc 2012Roland Bouman
 
Crack the complexity of oracle applications r12 workload v2
Crack the complexity of oracle applications r12 workload v2Crack the complexity of oracle applications r12 workload v2
Crack the complexity of oracle applications r12 workload v2
Ajith Narayanan
 
Oracle - Checklist for performance issues
Oracle - Checklist for performance issuesOracle - Checklist for performance issues
Oracle - Checklist for performance issues
Markus Flechtner
 
Use Oracle 9i Summary Advisor To Better Manage Your Data Warehouse
Use Oracle 9i Summary Advisor To Better Manage Your Data WarehouseUse Oracle 9i Summary Advisor To Better Manage Your Data Warehouse
Use Oracle 9i Summary Advisor To Better Manage Your Data Warehouse
info_sunrise24
 
Sql storeprocedure
Sql storeprocedureSql storeprocedure
Sql storeprocedure
ftz 420
 
MySQL Performance Schema : fossasia
MySQL Performance Schema : fossasiaMySQL Performance Schema : fossasia
MySQL Performance Schema : fossasia
Mayank Prasad
 
Vpd
VpdVpd
Lost without a trace
Lost without a traceLost without a trace
Lost without a trace
Sage Computing Services
 

Similar to Aspects of 10 Tuning (20)

Whose fault is it? - a review of application tuning problems
Whose fault is it? - a review of application tuning problemsWhose fault is it? - a review of application tuning problems
Whose fault is it? - a review of application tuning problems
 
Tony Jambu (obscure) tools of the trade for tuning oracle sq ls
Tony Jambu   (obscure) tools of the trade for tuning oracle sq lsTony Jambu   (obscure) tools of the trade for tuning oracle sq ls
Tony Jambu (obscure) tools of the trade for tuning oracle sq ls
 
How Can I tune it When I Can't Change the Code?
How Can I tune it When I Can't Change the Code?How Can I tune it When I Can't Change the Code?
How Can I tune it When I Can't Change the Code?
 
22-4_PerformanceTuningUsingtheAdvisorFramework.pdf
22-4_PerformanceTuningUsingtheAdvisorFramework.pdf22-4_PerformanceTuningUsingtheAdvisorFramework.pdf
22-4_PerformanceTuningUsingtheAdvisorFramework.pdf
 
Dimensional performance benchmarking of SQL
Dimensional performance benchmarking of SQLDimensional performance benchmarking of SQL
Dimensional performance benchmarking of SQL
 
Oracle audit and reporting in one hour or less
Oracle audit and reporting in one hour or lessOracle audit and reporting in one hour or less
Oracle audit and reporting in one hour or less
 
Tony jambu (obscure) tools of the trade for tuning oracle sq ls
Tony jambu   (obscure) tools of the trade for tuning oracle sq lsTony jambu   (obscure) tools of the trade for tuning oracle sq ls
Tony jambu (obscure) tools of the trade for tuning oracle sq ls
 
Enhancements that will make your sql database roar sp1 edition sql bits 2017
Enhancements that will make your sql database roar sp1 edition sql bits 2017Enhancements that will make your sql database roar sp1 edition sql bits 2017
Enhancements that will make your sql database roar sp1 edition sql bits 2017
 
Sherlock holmes for dba’s
Sherlock holmes for dba’sSherlock holmes for dba’s
Sherlock holmes for dba’s
 
Advanced tips for making Oracle databases faster
Advanced tips for making Oracle databases fasterAdvanced tips for making Oracle databases faster
Advanced tips for making Oracle databases faster
 
Your tuning arsenal: AWR, ADDM, ASH, Metrics and Advisors
Your tuning arsenal: AWR, ADDM, ASH, Metrics and AdvisorsYour tuning arsenal: AWR, ADDM, ASH, Metrics and Advisors
Your tuning arsenal: AWR, ADDM, ASH, Metrics and Advisors
 
Common schema my sql uc 2012
Common schema   my sql uc 2012Common schema   my sql uc 2012
Common schema my sql uc 2012
 
Common schema my sql uc 2012
Common schema   my sql uc 2012Common schema   my sql uc 2012
Common schema my sql uc 2012
 
Crack the complexity of oracle applications r12 workload v2
Crack the complexity of oracle applications r12 workload v2Crack the complexity of oracle applications r12 workload v2
Crack the complexity of oracle applications r12 workload v2
 
Oracle - Checklist for performance issues
Oracle - Checklist for performance issuesOracle - Checklist for performance issues
Oracle - Checklist for performance issues
 
Use Oracle 9i Summary Advisor To Better Manage Your Data Warehouse
Use Oracle 9i Summary Advisor To Better Manage Your Data WarehouseUse Oracle 9i Summary Advisor To Better Manage Your Data Warehouse
Use Oracle 9i Summary Advisor To Better Manage Your Data Warehouse
 
Sql storeprocedure
Sql storeprocedureSql storeprocedure
Sql storeprocedure
 
MySQL Performance Schema : fossasia
MySQL Performance Schema : fossasiaMySQL Performance Schema : fossasia
MySQL Performance Schema : fossasia
 
Vpd
VpdVpd
Vpd
 
Lost without a trace
Lost without a traceLost without a trace
Lost without a trace
 

More from Sage Computing Services

Oracle XML DB - What's in it for me?
Oracle XML DB - What's in it for me?Oracle XML DB - What's in it for me?
Oracle XML DB - What's in it for me?
Sage Computing Services
 
Bind Peeking - The Endless Tuning Nightmare
Bind Peeking - The Endless Tuning NightmareBind Peeking - The Endless Tuning Nightmare
Bind Peeking - The Endless Tuning Nightmare
Sage Computing Services
 
Back to basics: Simple database web services without the need for SOA
Back to basics: Simple database web services without the need for SOABack to basics: Simple database web services without the need for SOA
Back to basics: Simple database web services without the need for SOA
Sage Computing Services
 
Results cache
Results cacheResults cache
Meet the CBO in Version 11g
Meet the CBO in Version 11gMeet the CBO in Version 11g
Meet the CBO in Version 11g
Sage Computing Services
 
Take a load off! Load testing your Oracle APEX or JDeveloper web applications
Take a load off! Load testing your Oracle APEX or JDeveloper web applicationsTake a load off! Load testing your Oracle APEX or JDeveloper web applications
Take a load off! Load testing your Oracle APEX or JDeveloper web applications
Sage Computing Services
 
The Cost Based Optimiser in 11gR2
The Cost Based Optimiser in 11gR2The Cost Based Optimiser in 11gR2
The Cost Based Optimiser in 11gR2
Sage Computing Services
 
Transformations - how Oracle rewrites your statements
Transformations - how Oracle rewrites your statementsTransformations - how Oracle rewrites your statements
Transformations - how Oracle rewrites your statements
Sage Computing Services
 
Application Express - A web development environment for the masses - and for ...
Application Express - A web development environment for the masses - and for ...Application Express - A web development environment for the masses - and for ...
Application Express - A web development environment for the masses - and for ...
Sage Computing Services
 
OHarmony - How the Optimiser works
OHarmony - How the Optimiser worksOHarmony - How the Optimiser works
OHarmony - How the Optimiser works
Sage Computing Services
 
Common Coding and Design mistakes (that really mess up performance)
Common Coding and Design mistakes (that really mess up performance)Common Coding and Design mistakes (that really mess up performance)
Common Coding and Design mistakes (that really mess up performance)
Sage Computing Services
 
Oracle Discoverer is dead - Where to next for BI?
Oracle Discoverer is dead - Where to next for BI?Oracle Discoverer is dead - Where to next for BI?
Oracle Discoverer is dead - Where to next for BI?
Sage Computing Services
 

More from Sage Computing Services (12)

Oracle XML DB - What's in it for me?
Oracle XML DB - What's in it for me?Oracle XML DB - What's in it for me?
Oracle XML DB - What's in it for me?
 
Bind Peeking - The Endless Tuning Nightmare
Bind Peeking - The Endless Tuning NightmareBind Peeking - The Endless Tuning Nightmare
Bind Peeking - The Endless Tuning Nightmare
 
Back to basics: Simple database web services without the need for SOA
Back to basics: Simple database web services without the need for SOABack to basics: Simple database web services without the need for SOA
Back to basics: Simple database web services without the need for SOA
 
Results cache
Results cacheResults cache
Results cache
 
Meet the CBO in Version 11g
Meet the CBO in Version 11gMeet the CBO in Version 11g
Meet the CBO in Version 11g
 
Take a load off! Load testing your Oracle APEX or JDeveloper web applications
Take a load off! Load testing your Oracle APEX or JDeveloper web applicationsTake a load off! Load testing your Oracle APEX or JDeveloper web applications
Take a load off! Load testing your Oracle APEX or JDeveloper web applications
 
The Cost Based Optimiser in 11gR2
The Cost Based Optimiser in 11gR2The Cost Based Optimiser in 11gR2
The Cost Based Optimiser in 11gR2
 
Transformations - how Oracle rewrites your statements
Transformations - how Oracle rewrites your statementsTransformations - how Oracle rewrites your statements
Transformations - how Oracle rewrites your statements
 
Application Express - A web development environment for the masses - and for ...
Application Express - A web development environment for the masses - and for ...Application Express - A web development environment for the masses - and for ...
Application Express - A web development environment for the masses - and for ...
 
OHarmony - How the Optimiser works
OHarmony - How the Optimiser worksOHarmony - How the Optimiser works
OHarmony - How the Optimiser works
 
Common Coding and Design mistakes (that really mess up performance)
Common Coding and Design mistakes (that really mess up performance)Common Coding and Design mistakes (that really mess up performance)
Common Coding and Design mistakes (that really mess up performance)
 
Oracle Discoverer is dead - Where to next for BI?
Oracle Discoverer is dead - Where to next for BI?Oracle Discoverer is dead - Where to next for BI?
Oracle Discoverer is dead - Where to next for BI?
 

Recently uploaded

Corporate Management | Session 3 of 3 | Tendenci AMS
Corporate Management | Session 3 of 3 | Tendenci AMSCorporate Management | Session 3 of 3 | Tendenci AMS
Corporate Management | Session 3 of 3 | Tendenci AMS
Tendenci - The Open Source AMS (Association Management Software)
 
May Marketo Masterclass, London MUG May 22 2024.pdf
May Marketo Masterclass, London MUG May 22 2024.pdfMay Marketo Masterclass, London MUG May 22 2024.pdf
May Marketo Masterclass, London MUG May 22 2024.pdf
Adele Miller
 
Enterprise Resource Planning System in Telangana
Enterprise Resource Planning System in TelanganaEnterprise Resource Planning System in Telangana
Enterprise Resource Planning System in Telangana
NYGGS Automation Suite
 
Cyaniclab : Software Development Agency Portfolio.pdf
Cyaniclab : Software Development Agency Portfolio.pdfCyaniclab : Software Development Agency Portfolio.pdf
Cyaniclab : Software Development Agency Portfolio.pdf
Cyanic lab
 
Top Features to Include in Your Winzo Clone App for Business Growth (4).pptx
Top Features to Include in Your Winzo Clone App for Business Growth (4).pptxTop Features to Include in Your Winzo Clone App for Business Growth (4).pptx
Top Features to Include in Your Winzo Clone App for Business Growth (4).pptx
rickgrimesss22
 
SOCRadar Research Team: Latest Activities of IntelBroker
SOCRadar Research Team: Latest Activities of IntelBrokerSOCRadar Research Team: Latest Activities of IntelBroker
SOCRadar Research Team: Latest Activities of IntelBroker
SOCRadar
 
Quarkus Hidden and Forbidden Extensions
Quarkus Hidden and Forbidden ExtensionsQuarkus Hidden and Forbidden Extensions
Quarkus Hidden and Forbidden Extensions
Max Andersen
 
Custom Healthcare Software for Managing Chronic Conditions and Remote Patient...
Custom Healthcare Software for Managing Chronic Conditions and Remote Patient...Custom Healthcare Software for Managing Chronic Conditions and Remote Patient...
Custom Healthcare Software for Managing Chronic Conditions and Remote Patient...
Mind IT Systems
 
Accelerate Enterprise Software Engineering with Platformless
Accelerate Enterprise Software Engineering with PlatformlessAccelerate Enterprise Software Engineering with Platformless
Accelerate Enterprise Software Engineering with Platformless
WSO2
 
Globus Connect Server Deep Dive - GlobusWorld 2024
Globus Connect Server Deep Dive - GlobusWorld 2024Globus Connect Server Deep Dive - GlobusWorld 2024
Globus Connect Server Deep Dive - GlobusWorld 2024
Globus
 
How Recreation Management Software Can Streamline Your Operations.pptx
How Recreation Management Software Can Streamline Your Operations.pptxHow Recreation Management Software Can Streamline Your Operations.pptx
How Recreation Management Software Can Streamline Your Operations.pptx
wottaspaceseo
 
OpenFOAM solver for Helmholtz equation, helmholtzFoam / helmholtzBubbleFoam
OpenFOAM solver for Helmholtz equation, helmholtzFoam / helmholtzBubbleFoamOpenFOAM solver for Helmholtz equation, helmholtzFoam / helmholtzBubbleFoam
OpenFOAM solver for Helmholtz equation, helmholtzFoam / helmholtzBubbleFoam
takuyayamamoto1800
 
A Comprehensive Look at Generative AI in Retail App Testing.pdf
A Comprehensive Look at Generative AI in Retail App Testing.pdfA Comprehensive Look at Generative AI in Retail App Testing.pdf
A Comprehensive Look at Generative AI in Retail App Testing.pdf
kalichargn70th171
 
Gamify Your Mind; The Secret Sauce to Delivering Success, Continuously Improv...
Gamify Your Mind; The Secret Sauce to Delivering Success, Continuously Improv...Gamify Your Mind; The Secret Sauce to Delivering Success, Continuously Improv...
Gamify Your Mind; The Secret Sauce to Delivering Success, Continuously Improv...
Shahin Sheidaei
 
2024 RoOUG Security model for the cloud.pptx
2024 RoOUG Security model for the cloud.pptx2024 RoOUG Security model for the cloud.pptx
2024 RoOUG Security model for the cloud.pptx
Georgi Kodinov
 
Innovating Inference - Remote Triggering of Large Language Models on HPC Clus...
Innovating Inference - Remote Triggering of Large Language Models on HPC Clus...Innovating Inference - Remote Triggering of Large Language Models on HPC Clus...
Innovating Inference - Remote Triggering of Large Language Models on HPC Clus...
Globus
 
GlobusWorld 2024 Opening Keynote session
GlobusWorld 2024 Opening Keynote sessionGlobusWorld 2024 Opening Keynote session
GlobusWorld 2024 Opening Keynote session
Globus
 
Vitthal Shirke Microservices Resume Montevideo
Vitthal Shirke Microservices Resume MontevideoVitthal Shirke Microservices Resume Montevideo
Vitthal Shirke Microservices Resume Montevideo
Vitthal Shirke
 
Enhancing Project Management Efficiency_ Leveraging AI Tools like ChatGPT.pdf
Enhancing Project Management Efficiency_ Leveraging AI Tools like ChatGPT.pdfEnhancing Project Management Efficiency_ Leveraging AI Tools like ChatGPT.pdf
Enhancing Project Management Efficiency_ Leveraging AI Tools like ChatGPT.pdf
Jay Das
 
First Steps with Globus Compute Multi-User Endpoints
First Steps with Globus Compute Multi-User EndpointsFirst Steps with Globus Compute Multi-User Endpoints
First Steps with Globus Compute Multi-User Endpoints
Globus
 

Recently uploaded (20)

Corporate Management | Session 3 of 3 | Tendenci AMS
Corporate Management | Session 3 of 3 | Tendenci AMSCorporate Management | Session 3 of 3 | Tendenci AMS
Corporate Management | Session 3 of 3 | Tendenci AMS
 
May Marketo Masterclass, London MUG May 22 2024.pdf
May Marketo Masterclass, London MUG May 22 2024.pdfMay Marketo Masterclass, London MUG May 22 2024.pdf
May Marketo Masterclass, London MUG May 22 2024.pdf
 
Enterprise Resource Planning System in Telangana
Enterprise Resource Planning System in TelanganaEnterprise Resource Planning System in Telangana
Enterprise Resource Planning System in Telangana
 
Cyaniclab : Software Development Agency Portfolio.pdf
Cyaniclab : Software Development Agency Portfolio.pdfCyaniclab : Software Development Agency Portfolio.pdf
Cyaniclab : Software Development Agency Portfolio.pdf
 
Top Features to Include in Your Winzo Clone App for Business Growth (4).pptx
Top Features to Include in Your Winzo Clone App for Business Growth (4).pptxTop Features to Include in Your Winzo Clone App for Business Growth (4).pptx
Top Features to Include in Your Winzo Clone App for Business Growth (4).pptx
 
SOCRadar Research Team: Latest Activities of IntelBroker
SOCRadar Research Team: Latest Activities of IntelBrokerSOCRadar Research Team: Latest Activities of IntelBroker
SOCRadar Research Team: Latest Activities of IntelBroker
 
Quarkus Hidden and Forbidden Extensions
Quarkus Hidden and Forbidden ExtensionsQuarkus Hidden and Forbidden Extensions
Quarkus Hidden and Forbidden Extensions
 
Custom Healthcare Software for Managing Chronic Conditions and Remote Patient...
Custom Healthcare Software for Managing Chronic Conditions and Remote Patient...Custom Healthcare Software for Managing Chronic Conditions and Remote Patient...
Custom Healthcare Software for Managing Chronic Conditions and Remote Patient...
 
Accelerate Enterprise Software Engineering with Platformless
Accelerate Enterprise Software Engineering with PlatformlessAccelerate Enterprise Software Engineering with Platformless
Accelerate Enterprise Software Engineering with Platformless
 
Globus Connect Server Deep Dive - GlobusWorld 2024
Globus Connect Server Deep Dive - GlobusWorld 2024Globus Connect Server Deep Dive - GlobusWorld 2024
Globus Connect Server Deep Dive - GlobusWorld 2024
 
How Recreation Management Software Can Streamline Your Operations.pptx
How Recreation Management Software Can Streamline Your Operations.pptxHow Recreation Management Software Can Streamline Your Operations.pptx
How Recreation Management Software Can Streamline Your Operations.pptx
 
OpenFOAM solver for Helmholtz equation, helmholtzFoam / helmholtzBubbleFoam
OpenFOAM solver for Helmholtz equation, helmholtzFoam / helmholtzBubbleFoamOpenFOAM solver for Helmholtz equation, helmholtzFoam / helmholtzBubbleFoam
OpenFOAM solver for Helmholtz equation, helmholtzFoam / helmholtzBubbleFoam
 
A Comprehensive Look at Generative AI in Retail App Testing.pdf
A Comprehensive Look at Generative AI in Retail App Testing.pdfA Comprehensive Look at Generative AI in Retail App Testing.pdf
A Comprehensive Look at Generative AI in Retail App Testing.pdf
 
Gamify Your Mind; The Secret Sauce to Delivering Success, Continuously Improv...
Gamify Your Mind; The Secret Sauce to Delivering Success, Continuously Improv...Gamify Your Mind; The Secret Sauce to Delivering Success, Continuously Improv...
Gamify Your Mind; The Secret Sauce to Delivering Success, Continuously Improv...
 
2024 RoOUG Security model for the cloud.pptx
2024 RoOUG Security model for the cloud.pptx2024 RoOUG Security model for the cloud.pptx
2024 RoOUG Security model for the cloud.pptx
 
Innovating Inference - Remote Triggering of Large Language Models on HPC Clus...
Innovating Inference - Remote Triggering of Large Language Models on HPC Clus...Innovating Inference - Remote Triggering of Large Language Models on HPC Clus...
Innovating Inference - Remote Triggering of Large Language Models on HPC Clus...
 
GlobusWorld 2024 Opening Keynote session
GlobusWorld 2024 Opening Keynote sessionGlobusWorld 2024 Opening Keynote session
GlobusWorld 2024 Opening Keynote session
 
Vitthal Shirke Microservices Resume Montevideo
Vitthal Shirke Microservices Resume MontevideoVitthal Shirke Microservices Resume Montevideo
Vitthal Shirke Microservices Resume Montevideo
 
Enhancing Project Management Efficiency_ Leveraging AI Tools like ChatGPT.pdf
Enhancing Project Management Efficiency_ Leveraging AI Tools like ChatGPT.pdfEnhancing Project Management Efficiency_ Leveraging AI Tools like ChatGPT.pdf
Enhancing Project Management Efficiency_ Leveraging AI Tools like ChatGPT.pdf
 
First Steps with Globus Compute Multi-User Endpoints
First Steps with Globus Compute Multi-User EndpointsFirst Steps with Globus Compute Multi-User Endpoints
First Steps with Globus Compute Multi-User Endpoints
 

Aspects of 10 Tuning

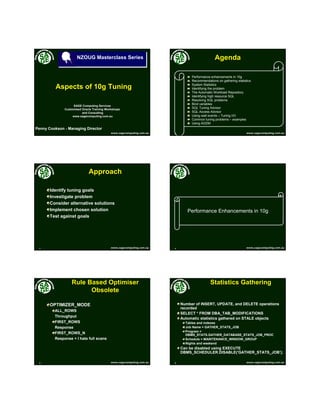
  • 1. www.sagecomputing.com.auwww.sagecomputing.com.au Aspects of 10g TuningAspects of 10g Tuning Penny Cookson - Managing Director SAGE Computing ServicesSAGE Computing Services Customised Oracle Training WorkshopsCustomised Oracle Training Workshops and Consultingand Consulting www.sagecomputing.com.auwww.sagecomputing.com.au NZOUG Masterclass Series www.sagecomputing.com.auwww.sagecomputing.com.au2 AgendaAgenda Performance enhancements in 10g Recommendations on gathering statistics System Statistics Identifying the problem The Automatic Workload Repository Identifying high resource SQL Resolving SQL problems Bind variables SQL Tuning Advisor SQL Access Advisor Using wait events – Tuning I/O Common tuning problems – examples Using ADDM www.sagecomputing.com.auwww.sagecomputing.com.au3 ApproachApproach Identify tuning goals Investigate problem Consider alternative solutions Implement chosen solution Test against goals www.sagecomputing.com.auwww.sagecomputing.com.au4 Performance Enhancements in 10g www.sagecomputing.com.auwww.sagecomputing.com.au5 Rule BasedRule Based OptimiserOptimiser ObsoleteObsolete OPTIMIZER_MODE ALL_ROWS Throughput FIRST_ROWS Response FIRST_ROWS_N Response + I hate full scans www.sagecomputing.com.auwww.sagecomputing.com.au6 Statistics GatheringStatistics Gathering Number of INSERT, UPDATE, and DELETE operations recorded SELECT * FROM DBA_TAB_MODIFICATIONS Automatic statistics gathered on STALE objects Tables and indexes Job Name = GATHER_STATS_JOB Program = DBMS_STATS.GATHER_DATABASE_STATS_JOB_PROC Schedule = MAINTENANCE_WINDOW_GROUP Nights and weekend Can be disabled using EXECUTE DBMS_SCHEDULER.DISABLE('GATHER_STATS_JOB');
  • 2. www.sagecomputing.com.auwww.sagecomputing.com.au7 Statistics ManagementStatistics Management Statistics history Stored by default for a period of 31 days If statistics_level is TYPICAL or ALL they are purged automatically DBA_OPTSTAT_OPERATIONS USER_TAB_STATS_HISTORY DBMS_STATS.ALTER_STATS_HISTORY_RETENTION DBMS_STATS.PURGE_STATS DBMS_STATS.RESTORE DBMS_STATS.GET_STATS_HISTORY_AVAILABILTY www.sagecomputing.com.auwww.sagecomputing.com.au8 Statistics ManagementStatistics Management Ability to lock statistics DBMS_STATS.LOCK_SCHEMA_STATS DBMS_STATS.LOCK_TABLE_STATS Statistics can be unlocked DBMS_STATS.UNLOCK_SCHEMA_STATS DBMS_STATS.UNLOCK_TABLE_STATS Dynamic sampling For very dynamic data or missing statstics OPTIMIZER_DYNAMIC_SAMPLING --+ DYNAMIC_SAMPLING(tablealias level) Levels 0 to 10 www.sagecomputing.com.auwww.sagecomputing.com.au9 Gathering StatisticsGathering Statistics Check that statistics are up to date on all objects Create histograms on skewed columns NO_INVALIDATE GATHER_FIXED_OBJECTS_STATS Keep multiple sets of statistics METHOD_OPT parameter FOR COLUMNS col1,col2 SIZE n FOR ALL COLUMNS SIZE n FOR ALL INDEXED COLUMNS SIZE n integer Number of histogram buckets REPEAT already have histograms AUTO data distribution and workloa SKEWONLY data distribution www.sagecomputing.com.auwww.sagecomputing.com.au10 Manually Setting StatsManually Setting Stats DBMS_STATS.SET_TABLE_STATS Set table, column or index stats manually Regathering will overwrite Freezing fixes stats – won’t respond to changes Use only for jobs where data is very volatile and a fixed result gives good results ** But if its all working fine – why change the statistics ** www.sagecomputing.com.auwww.sagecomputing.com.au11 TrcessTrcess End to end tracing trcsess used to consolidate a number of trace files trcsess output=output_file session=session_id e.g. 152.3 This is the SID and SERIAL# from v$session clientid=client_id service=service_name action=action_name module=module_name trace_files the * wildcard can be used DBMS_MONITOR package can be used to gather statistics for a specific Client ID, Service or service, module and action DBMS_APPLICATION_INFO package can be used to set the module and action from within an application www.sagecomputing.com.auwww.sagecomputing.com.au12 New HintsNew Hints Specify index with name or column --+ INDEX(org (org_id name)) Use nested loop with a specific index --+ USE_NL_WITH_INDEX (alias (indexname)) Name a query block --+ QB_NAME (q1). Do not perform query transformation --+ NO_QUERY_TRANSFORMATION Perform index skip scan --+ INDEX_SS
  • 3. www.sagecomputing.com.auwww.sagecomputing.com.au13 OtherOther Global temporary table SYS.PLAN_TABLE$ Private outlines Fast DUAL access New tuning tools New costing model CPU + IO Uses MBRC system parameter for full scans Statistics with or without workload www.sagecomputing.com.auwww.sagecomputing.com.au14 Cost ModelCost Model Prior to Oracle 9i Number of I/Os Estimates of index blocks in memory OPTIMIZER_INDEX_CACHING Estimates of cost of index scan OPTIMZER_INDEX_COST_ADJ Oracle 9i I/O plus CPU costing if system statistics gathered Oracle 10g CPU and I/O System statistics or defaults www.sagecomputing.com.auwww.sagecomputing.com.au15 Gathering System StatisticsGathering System Statistics Workload statistics CPUSPEEDNW, IOSEEKTIME, IOTFRSPEED Noworkload statistics SREADTIME, MREADTIME, CPUSPEED, MBRC, SLAVETHR Optimiser uses workload statistics if available SYS.AUX_STATS$ Gather at times of representative workload Daytime OLTP set Nightime batch / reporting set Import as required www.sagecomputing.com.auwww.sagecomputing.com.au16 Gathering System StatisticsGathering System Statistics DBMS_STATS.CREATE_STAT_TABLE ('SYS','OLTP_SYSSTAT','STAT_TS'); DBMS_STATS.GATHER_SYSTEM_STATS ( gathering_mode => 'INTERVAL', interval => 2, stattab => 'OLTP_SYSSTAT', statid => 'OLTP'); DBMS_STATS. DELETE_SYSTEM_STATS; DBMS_STATS.IMPORT_SYSTEM_STATS ( stattab => 'OLTP_SYSSTAT', statid => 'OLTP', statown => 'SYS'); www.sagecomputing.com.auwww.sagecomputing.com.au17 Identifying the problem www.sagecomputing.com.auwww.sagecomputing.com.au18 Identifying the ProblemIdentifying the Problem Something is wrong with the HR application User information
  • 4. www.sagecomputing.com.auwww.sagecomputing.com.au19 Identifying the ProblemIdentifying the Problem Something is wrong with the payroll run, its taking much longer than normal Advanced user information www.sagecomputing.com.auwww.sagecomputing.com.au20 Identifying the ProblemIdentifying the Problem Possible problems Application issues - Contention High resource SQL – This is always the most likely Database configuration OS configuration Tools Wait events the V$ tables Tracing Dictionary tables Enterprise Manager www.sagecomputing.com.auwww.sagecomputing.com.au21 Identifying the ProblemIdentifying the Problem When does it happen Current session At specific times All the time What is the scope of the problem Single user Particular time/job Overall performance Has anything changed www.sagecomputing.com.auwww.sagecomputing.com.au22 Trace 10046Trace 10046 Turn tracing on for the system (performance overhead) or session Identify location of user_dump_dest Check max_dump_file_size BEGIN dbms_monitor.session_trace_enable(session_id=>130, serial_num=>708, waits=>TRUE, binds=>TRUE); END; ALTER system set events ’10046 trace name context forever, level 12’ trcsess output=all_traces.trc service=ora10g *.trc tkprof all_traces.trc all_traces.prf sort=execpu, prscpu, fchcpu www.sagecomputing.com.auwww.sagecomputing.com.au23 Format the trace file www.sagecomputing.com.auwww.sagecomputing.com.au24 High Resource SQLHigh Resource SQL V$SQL has buffer gets and physical reads for statements in the SGA V$SQL_PLAN has plans for statements in the SGA Use V$SQLSTATS (10g Rel 2) Row for unique combinations of SQL statement and optimizer plan (SQL_ID and PLAN_HASH_VALUE) Retained longer than V$SQL Does not include SQL PROFILE or OUTLINE dba_hist_sqlstat and dba_hist_sqltext have buffer gets and physical reads for past statement dba_hist_sql_plan has plans for past statement dba_hist_optimizer_env
  • 5. www.sagecomputing.com.auwww.sagecomputing.com.au25 AWR Data for HighAWR Data for High Resource SQLResource SQL Look for high buffer gets SELECT s.snap_id, s.sql_id, s.buffer_gets_total, s.executions_total, s.buffer_gets_total/NULLIF(executions_total,0) reads, t.sql_text FROM dba_hist_sqlstat s, dba_hist_sqltext t WHERE t.sql_id = s.sql_id AND buffer_gets_total/NULLIF(executions_total,0) > 1000000 SNAP_ID SQL_ID BUFFER_GETS_TOTAL EXECUTIONS_TOTAL READS ---------- ------------- ----------------- ---------------- ---------- SQL_TEXT --------------------------------------------------------------------------- 824 3s0z04m9qdusq 4979957 1 4979957 insert into bookings_large select booking_seq.nextval, mod(event2_seq.nextval,100000)+201, resource_code, chargeable, made_by, quantity, cost, status, comments from bookings_large www.sagecomputing.com.auwww.sagecomputing.com.au26 AWR Data for HighAWR Data for High Resource SQLResource SQL Find execution path SELECT lpad(to_char(id),level) ID, parent_id PT, decode(id,0,'Cost: '||cost,object_name) OB, operation OP, rpad(options,30)|| rpad(access_predicates,30)|| rpad(filter_predicates,30) OT, to_number(decode(id,0,null,position)) PS, cardinality CD FROM dba_hist_sql_plan CONNECT BY prior id = parent_id AND sql_id = '&&sql_id' START WITH parent_id is null AND sql_id = '&&sql_id'; Id Par Object Operation Options Pos Rows ------ --- -------------- -------------------- ------------------------------ ---- ---------- 0 Cost: 1322 INSERT STATEMENT 1 0 SEQUENCE 1 2 1 BOOKINGS_LARGE TABLE ACCESS FULL 1 810770 www.sagecomputing.com.auwww.sagecomputing.com.au27 Problems with a CurrentProblems with a Current SessionSession Find waiting sessions SELECT sid, serial# , username, event, blocking_session, seconds_in_wait, sql_id FROM v$session WHERE state = 'WAITING' AND wait_class != 'Idle' SID SERIAL# USERNAME EVENT BLOCKING_SESSION SECONDS_IN_WAIT SQL_ID ---- ------- ------- ----------------------------- ---------------- --------------- ------------- 161 573 TRAIN enq: TX - row lock contention 130 1207 g3xry817zpwk3 www.sagecomputing.com.auwww.sagecomputing.com.au28 Problems with a CurrentProblems with a Current SessionSession Find the SQL the session is running SELECT sql_text FROM v$sql WHERE sql_id = 'g3xry817zpwk3' SQL_TEXT ------------------------------------------------------------------- UPDATE events set start_date = start_date+1 WHERE event_no = :b1 We can find the SQL the blocker is running but it may not be the blocking statement www.sagecomputing.com.auwww.sagecomputing.com.au29 Find Bind VariablesFind Bind Variables SELECT value_string FROM v$sql_bind_capture WHERE sql_id='g3xry817zpwk3' VALUE_STRING ---------------------------- 100 Bind capture is disabled when STATISTICS_LEVEL =BASIC www.sagecomputing.com.auwww.sagecomputing.com.au30 Session ProblemsSession Problems Currently waiting V$SESSION_WAIT V$SESSION V$SESSION_WAIT_CLASS Recent sessions V$SESSION_WAIT_HISTORY V$ACTIVE_SESSION_HISTORY Current sessions DBA_HIST_ACTIVE_SESSION_HISTORY Past sessions V$SESS_TIME_MODEL
  • 6. www.sagecomputing.com.auwww.sagecomputing.com.au31 Current Session ProblemsCurrent Session Problems If there is no current wait check the session’s wait classes SELECT wait_class_id, wait_class#, wait_class, total_waits, time_waited FROM v$session_wait_class WHERE sid=161 WAIT_CLASS_ID WAIT_CLASS# WAIT_CLASS TOTAL_WAITS TIME_WAITED ------------- ----------- -------------------- ----------- ----------- 4217450380 1 Application 210 62654 3386400367 5 Commit 3 0 2723168908 6 Idle 25 545088 2000153315 7 Network 31 0 1740759767 8 User I/O 11 10 Locking problem www.sagecomputing.com.auwww.sagecomputing.com.au32 Problems with a CurrentProblems with a Current SessionSession –– Example 2Example 2 Find waiting sessions SELECT sid, serial# , username, event, blocking_session, seconds_in_wait, sql_id FROM v$session WHERE state = 'WAITING' AND wait_class != 'Idle' SID SERIAL# USERNAME EVENT BLOCKING_SESSION SECONDS_IN_WAIT SQL_ID --- ------- ---------- ------------------------ ---------------- --------------- ------------ 130 708 TRAIN2 db file scattered read 0 3s0z04m9qdusq www.sagecomputing.com.auwww.sagecomputing.com.au33 Current Session ProblemsCurrent Session Problems Is this a one off event or a pattern SELECT wait_class_id, wait_class#, wait_class, total_waits, time_waited FROM v$session_wait_class WHERE sid=130 WAIT_CLASS# WAIT_CLASS TOTAL_WAITS TIME_WAITED ----------- -------------------- ----------- ----------- 0 Other 309 670 1 Application 318 74379 2 Configuration 1233 9735 4 Concurrency 31 0 5 Commit 495 325 6 Idle 605 771174 7 Network 694 4 8 User I/O 21278 15526 9 System I/O 3099 4013 www.sagecomputing.com.auwww.sagecomputing.com.au34 Current Session ProblemsCurrent Session Problems Last 10 waits SELECT event#, event, wait_time, wait_count FROM v$session_wait_history WHERE sid = 130 EVENT# EVENT WAIT_TIME WAIT_COUNT ---------- ---------------------------------------- ---------- ---------- 294 db file sequential read 1 1 586 SQL*Net message to client 0 1 590 SQL*Net message from client 6 1 586 SQL*Net message to client 0 1 590 SQL*Net message from client 2 1 586 SQL*Net message to client 0 1 590 SQL*Net message from client 0 1 586 SQL*Net message to client 0 1 294 db file sequential read 0 1 294 db file sequential read 0 1 www.sagecomputing.com.auwww.sagecomputing.com.au35 Recent Session ProblemsRecent Session Problems Active session history SELECT sample_time, event, wait_time, time_waited FROM v$active_session_history WHERE session_id = 130 AND session_serial# = 708 ORDER BY sample_time SAMPLE_TIME EVENT WAIT_TIME TIME_WAITED ------------------------------ ------------------------------ ---------- ----------- 21-MAY-05 08.35.46.570 AM control file sequential read 0 24076 21-MAY-05 08.35.47.601 AM db file scattered read 117906 0 21-MAY-05 08.35.48.632 AM db file scattered read 117734 0 21-MAY-05 08.35.49.663 AM log file switch completion 0 278636 21-MAY-05 08.35.50.694 AM db file sequential read 169 0 21-MAY-05 08.35.51.725 AM db file scattered read 0 21938 21-MAY-05 08.35.52.757 AM db file scattered read 0 71240 21-MAY-05 08.35.53.788 AM db file sequential read 0 14740 21-MAY-05 08.35.54.819 AM db file sequential read 186 0 21-MAY-05 08.35.55.850 AM db file sequential read 0 140 21-MAY-05 08.36.26.785 AM db file scattered read 0 8894 21-MAY-05 08.36.27.816 AM db file scattered read 0 5867 21-MAY-05 08.36.28.848 AM db file scattered read 0 45020 www.sagecomputing.com.auwww.sagecomputing.com.au36 Current Session ProblemsCurrent Session Problems Find where the session has spent its time SELECT stat_name, value FROM v$sess_time_model WHERE sid=130 STAT_NAME VALUE -------------------------------------------------- ---------- DB time 1258404159 DB CPU 167882212 background elapsed time 0 background cpu time 0 sequence load elapsed time 80535063 parse time elapsed 15047886 hard parse elapsed time 8505043 sql execute elapsed time 1228185696 connection management call elapsed time 2375 failed parse elapsed time 174792 failed parse (out of shared memory) elapsed time 0 hard parse (sharing criteria) elapsed time 27209 hard parse (bind mismatch) elapsed time 411 PL/SQL execution elapsed time 996461 inbound PL/SQL rpc elapsed time 0 PL/SQL compilation elapsed time 359583 Java execution elapsed time 0
  • 7. www.sagecomputing.com.auwww.sagecomputing.com.au37 www.sagecomputing.com.auwww.sagecomputing.com.au38 www.sagecomputing.com.auwww.sagecomputing.com.au39 www.sagecomputing.com.auwww.sagecomputing.com.au40 www.sagecomputing.com.auwww.sagecomputing.com.au41 www.sagecomputing.com.auwww.sagecomputing.com.au42 Fix the ProblemFix the Problem Kill one of the sessions Fix the application problem Identify and fix the high resource SQL
  • 8. www.sagecomputing.com.auwww.sagecomputing.com.au43 Overall PerformanceOverall Performance ProblemsProblems -- SourcesSources Alert log Wait events Oracle 10g gathers comprehensive statistics Active session history Time model Metrics OS statistics www.sagecomputing.com.auwww.sagecomputing.com.au44 Wait EventsWait Events Look for system wait classes SELECT wait_class_id, wait_class#, wait_class, total_waits, time_waited FROM v$system_wait_class WAIT_CLASS_ID WAIT_CLASS# WAIT_CLASS TOTAL_WAITS TIME_WAITED ------------- ----------- -------------------- ----------- ----------- 1893977003 0 Other 6238 444427 4217450380 1 Application 26661 826816 3290255840 2 Configuration 2096 12605 3875070507 4 Concurrency 136 186 3386400367 5 Commit 8151 1930 2723168908 6 Idle 683331 197711587 2000153315 7 Network 205150 70 1740759767 8 User I/O 69290 57267 4108307767 9 System I/O 134573 57583 www.sagecomputing.com.auwww.sagecomputing.com.au45 Wait EventsWait Events Look for system wait events - Application SELECT e.event, e.total_waits, e.total_timeouts, e.time_waited, average_wait FROM v$system_event e, v$event_name n WHERE n.event_id = e.event_id AND n.wait_class# = 1 -- Application EVENT TOTAL_WAITS TOTAL_TIMEOUTS TIME_WAITED AVERAGE_WAIT ------------------------------ ----------- -------------- ----------- ------------ enq: RO - fast object reuse 33 0 11 0 enq: TX - row lock contention 2690 2686 826242 307 SQL*Net break/reset to client 24110 0 566 0 www.sagecomputing.com.auwww.sagecomputing.com.au46 Wait EventsWait Events Look for system wait events – User I/O SELECT e.event, e.total_waits, e.total_timeouts, e.time_waited, average_wait FROM v$system_event e, v$event_name n WHERE n.event_id = e.event_id AND n.wait_class# = 8 -- User I/O EVENT TOTAL_WAITS TOTAL_TIMEOUTS TIME_WAITED AVERAGE_WAIT ------------------------------ ----------- -------------- ----------- ------------ local write wait 7 0 0 0 read by other session 1 0 1 1 db file sequential read 58691 0 47970 1 db file scattered read 7424 0 8271 1 db file single write 151 0 14 0 db file parallel read 1 0 3 3 direct path read 1474 0 925 1 direct path read temp 102 0 25 0 direct path write 1473 0 160 0 direct path write temp 168 0 2 0 www.sagecomputing.com.auwww.sagecomputing.com.au47 Wait EventsWait Events Look for system wait events – System I/O SELECT e.event, e.total_waits, e.total_timeouts, e.time_waited, average_wait FROM v$system_event e, v$event_name n WHERE n.event_id = e.event_id AND n.wait_class# = 9 -- System I/O EVENT TOTAL_WAITS TOTAL_TIMEOUTS TIME_WAITED AVERAGE_WAIT ------------------------------ ----------- -------------- ----------- ------------ ksfd: async disk IO 288 0 15 0 control file sequential read 13938 0 21111 2 control file single write 714 0 128 0 control file parallel write 26960 0 10292 0 recovery read 6 0 0 0 log file sequential read 378 0 350 1 log file single write 375 0 40 0 log file parallel write 51020 0 17352 0 db file parallel write 42478 0 8626 0 www.sagecomputing.com.auwww.sagecomputing.com.au48 Wait EventsWait Events Look for distribution of wait times One event with a long wait time could skew the results SELECT wait_time_milli, wait_count FROM v$event_histogram WHERE event = ‘enq: TX - row lock contention’ WAIT_TIME_MILLI WAIT_COUNT --------------- ---------- 1 0 2 0 4 0 8 0 16 0 32 0 64 0 128 2 256 2 512 0 1024 0 2048 1 4096 2685
  • 9. www.sagecomputing.com.auwww.sagecomputing.com.au49 Wait EventsWait Events Look for distribution of wait times SELECT wait_time_milli, wait_count FROM v$event_histogram WHERE event = ‘db file sequential read’ WAIT_TIME_MILLI WAIT_COUNT --------------- ---------- 1 28683 2 1120 4 3017 8 6987 16 10667 32 5671 64 1933 128 391 256 197 512 28 1024 1 www.sagecomputing.com.auwww.sagecomputing.com.au50 Time ModelTime Model Records where the database is spending time DB Time is overall database activity time ADDM’s goal is to minimise this Look for high parse time as proportion of SQL execution time www.sagecomputing.com.auwww.sagecomputing.com.au51 Time ModelTime Model Find where the system has spent its time SELECT stat_name, value FROM v$sys_time_model STAT_NAME VALUE ------------------------------------------------- ---------- DB time 1.0306E+10 DB CPU 526468001 background elapsed time 5488738125 background cpu time 496628001 sequence load elapsed time 80675372 parse time elapsed 71915940 hard parse elapsed time 60198409 sql execute elapsed time 1.0231E+10 connection management call elapsed time 1390986 failed parse elapsed time 302227 failed parse (out of shared memory) elapsed time 0 hard parse (sharing criteria) elapsed time 591387 hard parse (bind mismatch) elapsed time 294519 PL/SQL execution elapsed time 1031366155 inbound PL/SQL rpc elapsed time 0 PL/SQL compilation elapsed time 8411615 Java execution elapsed time 1037473 www.sagecomputing.com.auwww.sagecomputing.com.au52 MetricsMetrics Calculated at intervals V$SYSMETRIC V$EVENTMETRIC V$WAITCLASSMETRIC V$FILEMETRIC V$METRICNAME www.sagecomputing.com.auwww.sagecomputing.com.au53 MetricsMetrics Shows traditional hit ratios SELECT metric_name, AVG(value), metric_unit FROM v$sysmetric WHERE metric_unit LIKE '%%' ESCAPE '' GROUP BY metric_name, metric_unit METRIC_NAME AVG(VALUE) METRIC_UNIT ----------------------------------- ---------- -------------------------------- User Limit % 0 % Sessions/License_Limit PGA Cache Hit % 99 % Bytes/TotalBytes Process Limit % 22 % Processes/Limit Session Limit % 21 % Sessions/Limit Soft Parse Ratio 75 % SoftParses/TotalParses User Calls Ratio 25 % UserCalls/AllCalls Memory Sorts Ratio 100 % MemSort/(MemSort + DiskSort) Shared Pool Free % 12 % Free/Total Row Cache Hit Ratio 100 % Hits/Gets Row Cache Miss Ratio 0 % Misses/Gets Buffer Cache Hit Ratio 100 % (LogRead - PhyRead)/LogRead Cursor Cache Hit Ratio 0 % CursorCacheHit/SoftParse Database CPU Time Ratio 84.5 % Cpu/DB_Time Library Cache Hit Ratio 99 % Hits/Pins User Commits Percentage 100 % (UserCommit/TotalUserTxn) Database Wait Time Ratio 31 % Wait/DB_Time Host CPU Utilization (%) 1 % Busy/(Idle+Busy) Library Cache Miss Ratio 0 % Misses/Gets Redo Allocation Hit Ratio 100 % (#Redo - RedoSpaceReq)/#Redo User Rollbacks Percentage 0 % (UserRollback/TotalUserTxn) Execute Without Parse Ratio 90 % (ExecWOParse/TotalExec) www.sagecomputing.com.auwww.sagecomputing.com.au54 Click here to analyse the problem
  • 10. www.sagecomputing.com.auwww.sagecomputing.com.au55 www.sagecomputing.com.auwww.sagecomputing.com.au56 www.sagecomputing.com.auwww.sagecomputing.com.au57 The Automatic Workload Repository (AWR) www.sagecomputing.com.auwww.sagecomputing.com.au58 AWRAWR Persistent storage of system statistics Active session history V$tables Plans Automatic Database Diagnostic Monitor results Gathered in memory and flushed to disk by MMON Purged every 7 days Snapshots can be preserved Check that AWR collection is not causing library cache waits www.sagecomputing.com.auwww.sagecomputing.com.au59 DBMS_WORKLOAD_REPOSITORYDBMS_WORKLOAD_REPOSITORY Create an AWR snapshot dbms_workload_repository.create_snapshot Produce a report using two snapshots dbms_workload_repository.awr_report_html dbms_workload_repository.awr_report_text $ORACLE_HOME/rdbms/admin/awrrpt.sql Create a baseline dbms_workload_repository.create_baseline www.sagecomputing.com.auwww.sagecomputing.com.au60 DBA_HIST…….DBA_HIST……. DBA_HIST_DATABASE_INSTANCE DBA_HIST_SNAPSHOT DBA_HIST_SNAP_ERROR DBA_HIST_BASELINE DBA_HIST_WR_CONTROL DBA_HIST_DATAFILE DBA_HIST_FILESTATXS DBA_HIST_TEMPFILE DBA_HIST_TEMPSTATXS DBA_HIST_SQLSTAT DBA_HIST_SQLTEXT DBA_HIST_SQL_SUMMARY DBA_HIST_SQL_PLAN DBA_HIST_SQLBIND DBA_HIST_OPTIMIZER_ENV DBA_HIST_EVENT_NAME DBA_HIST_SYSTEM_EVENT DBA_HIST_BG_EVENT_SUMMARY DBA_HIST_WAITSTAT DBA_HIST_ENQUEUE_STAT DBA_HIST_LATCH_NAME DBA_HIST_LATCH DBA_HIST_LATCH_CHILDREN DBA_HIST_LATCH_PARENT DBA_HIST_LATCH_MISSES_SUMMARY DBA_HIST_LIBRARYCACHE DBA_HIST_DB_CACHE_ADVICE DBA_HIST_BUFFER_POOL_STAT DBA_HIST_ROWCACHE_SUMMARY DBA_HIST_SGA DBA_HIST_SGASTAT DBA_HIST_PGASTAT DBA_HIST_RESOURCE_LIMIT DBA_HIST_SHARED_POOL_ADVICE DBA_HIST_SQL_WORKAREA_HSTGRM DBA_HIST_PGA_TARGET_ADVICE DBA_HIST_INSTANCE_RECOVERY DBA_HIST_JAVA_POOL_ADVICE DBA_HIST_THREAD DBA_HIST_STAT_NAME DBA_HIST_SYSSTAT DBA_HIST_SYS_TIME_MODEL DBA_HIST_OSSTAT_NAME DBA_HIST_OSSTAT DBA_HIST_PARAMETER_NAME DBA_HIST_PARAMETER DBA_HIST_UNDOSTAT DBA_HIST_SEG_STAT DBA_HIST_SEG_STAT_OBJ DBA_HIST_METRIC_NAME DBA_HIST_SYSMETRIC_HISTORY DBA_HIST_SYSMETRIC_SUMMARY DBA_HIST_SESSMETRIC_HISTORY DBA_HIST_FILEMETRIC_HISTORY
  • 11. www.sagecomputing.com.auwww.sagecomputing.com.au61 AWR TablesAWR Tables WRH$.... Tables History of statistics e.g. WRH$_SQLSTAT_BL WRI$...... Tables Advice/recommendation tables e.g WRI$_ADV_RECOMMENDATIONS WRM$...... Tables Snapshot / baseline tables e.g WRM$_SNAPSHOT www.sagecomputing.com.auwww.sagecomputing.com.au62 www.sagecomputing.com.auwww.sagecomputing.com.au63 www.sagecomputing.com.auwww.sagecomputing.com.au64 www.sagecomputing.com.auwww.sagecomputing.com.au65 www.sagecomputing.com.auwww.sagecomputing.com.au66
  • 12. www.sagecomputing.com.auwww.sagecomputing.com.au67 AWRAWR Save snapshots for standard work profiles Use as a source for ADDM Use as a baseline Compare timelines Create a SQL Tuning set from a range of snapshots www.sagecomputing.com.auwww.sagecomputing.com.au68 Resolving SQL Problems www.sagecomputing.com.auwww.sagecomputing.com.au69 Tune the SQLTune the SQL –– First stepsFirst steps Are statistics up to date? Are histograms gathered on skewed data? Are system statistics collected? Are the initialisation parameters appropriate Use trace 10053 www.sagecomputing.com.auwww.sagecomputing.com.au70 Tune the SQLTune the SQL –– Second stepsSecond steps Use SQL Tuning Advisor Use SQL Access Advisor Consider rewriting the statement Consider hints Consider new indexes Run the statement overnight Consider materialised views Consider partitioning www.sagecomputing.com.auwww.sagecomputing.com.au71 Automatic SQL TuningAutomatic SQL Tuning SQL Tuning Advisor Optimiser runs in tuning mode Takes more time to decide Uses dynamic sampling Uses partial execution Uses past execution Source can be: Top SQL Statement SQL Tuning Set Snapshot Preserved snapshot set www.sagecomputing.com.auwww.sagecomputing.com.au72 Automatic TuningAutomatic Tuning OptimiserOptimiser Statistics Recommendations to gather Implement these and rerun Create auxiliary statistics SQL Profiles Store auxiliary statistics Verify and correct estimates Complex predicates Skewed join data Sparse join data Custom optimiser mode Not run in limited mode Rerun when significant data changes
  • 13. www.sagecomputing.com.auwww.sagecomputing.com.au73 Automatic TuningAutomatic Tuning OptimiserOptimiser Access path Indexes Only for this statement SQL Structure Changes to code Datatype mismatches UNION/UNION ALL Modified columns www.sagecomputing.com.auwww.sagecomputing.com.au74 Outlines v SQL ProfileOutlines v SQL Profile From Oracle 10g Stored as supplementary optimiser information Plan may change Applies to different literals if force_match=>TRUE From Oracle 8i Stored as a set of hints Plan will be static Will not apply to different literals unless CURSOR_SHARING= SIMILAR or FORCE on creation and use Outline SQL Profile www.sagecomputing.com.auwww.sagecomputing.com.au75 Outlines v SQL ProfileOutlines v SQL Profile Outline SQL Profile This is the way you must do it If I provide you with this information I’m sure you’ll make the right decision www.sagecomputing.com.auwww.sagecomputing.com.au76 SQL ProfilesSQL Profiles Automatic Tuning Optimiser Uses execution history Uses partial execution Store auxiliary statistics Store optimizer settings Verify and correct estimates Complex predicates Skewed join data Sparse join data Rerun when significant data changes Use SQLTUNE_CATEGORY to test www.sagecomputing.com.auwww.sagecomputing.com.au77 www.sagecomputing.com.auwww.sagecomputing.com.au78
  • 14. www.sagecomputing.com.auwww.sagecomputing.com.au79 www.sagecomputing.com.auwww.sagecomputing.com.au80 www.sagecomputing.com.auwww.sagecomputing.com.au81 www.sagecomputing.com.auwww.sagecomputing.com.au82 What Does the SQL Profile DoWhat Does the SQL Profile Do SELECT rec_id, type FROM dba_advisor_recommendations WHERE task_name = 'STATEMENT1'; www.sagecomputing.com.auwww.sagecomputing.com.au83 What Does the SQL Profile DoWhat Does the SQL Profile Do SELECT rec_id, message, attr1 FROM dba_advisor_rationale WHERE task_name = 'STATEMENT1'; www.sagecomputing.com.auwww.sagecomputing.com.au84
  • 15. www.sagecomputing.com.auwww.sagecomputing.com.au85 Identify the SQL ProfileIdentify the SQL Profile SELECT name, signature, sql_text, status, force_matching FROM dba_sql_profiles www.sagecomputing.com.auwww.sagecomputing.com.au86 Check the Profile is UsedCheck the Profile is Used SELECT sql_profile, sql_text FROM v$sql WHERE sql_profile is not null www.sagecomputing.com.auwww.sagecomputing.com.au87 How a SQL Profile WorksHow a SQL Profile Works Calculates Signature for statement Strips spaces Converts to upper case SELECT * FROM sql$ www.sagecomputing.com.auwww.sagecomputing.com.au88 How a SQL Profile WorksHow a SQL Profile Works Profile attributes contain optimiser information SELECT * FROM sqlprof$ www.sagecomputing.com.auwww.sagecomputing.com.au89 How a SQL Profile WorksHow a SQL Profile Works Profile attributes contain optimiser information SELECT * FROM sqlprof$attr www.sagecomputing.com.auwww.sagecomputing.com.au90 Formatted Trace FileFormatted Trace File
  • 16. www.sagecomputing.com.auwww.sagecomputing.com.au91 SQL ProfileSQL Profile -- ExampleExample SELECT sql_text, sql_id, sql_profile, exact_matching_signature, force_matching_signature FROM v$sql WHERE upper(sql_text) like '%BOOKINGS%' Both of these statements use the same profile www.sagecomputing.com.auwww.sagecomputing.com.au92 BEGIN dbms_sqltune.accept_sql_profile(task_name=>'STATEMENT1', force_match=>TRUE); END; Use force_match to make literals behave like bind variables Handling LiteralsHandling Literals www.sagecomputing.com.auwww.sagecomputing.com.au93 SELECT sql_text, sql_id, sql_profile, exact_matching_signature, force_matching_signature FROM v$sql WHERE upper(sql_text) like '%BOOKINGS%' Both of these statements use the same profile Handling LiteralsHandling Literals www.sagecomputing.com.auwww.sagecomputing.com.au94 SQL ProfilesSQL Profiles -- CategoriesCategories Accept profile in a category to test DBMS_SQLTUNE.ACCEPT_SQL_PROFILE ( task_name => ‘Task_Name’, category => ‘TEST_CATEGORY’) Set the category for your session ALTER SESSION SET SQLTUNE_CATEGORY=‘TEST_CATEGORY’ Test the code Reset the category DBMS_SQLTUNE.ALTER_SQL_PROFILE ( name => ‘SQL_Profile_Name’, attribute_name => ‘category’, value => ‘DEFAULT’); www.sagecomputing.com.auwww.sagecomputing.com.au95 SQL ProfilesSQL Profiles –– Export/Export/ImprtImprt Use staging table dbms_sqltune.create_stgtab_sqlprof( table_name=>'PROFILE_TEMP'); Add profile to staging table dbms_sqltune.pack_stgtab_sqlprof ( profile_name => 'PROFILE1', staging_table_name => 'PROFILE_TEMP'); Data pump dbms_sqltune.unpack_stgtab_sqlprof( staging_table_name => 'PROFILE_TEMP' ,REPLACE=>TRUE); www.sagecomputing.com.auwww.sagecomputing.com.au96 SQL Access AdvisorSQL Access Advisor Source can be: Top SQL SQL Tuning Set Defined SQL Schemas and/or tables Filter by Users Tables Top resource users Module IDs Actions
  • 17. www.sagecomputing.com.auwww.sagecomputing.com.au97 SQL Access AdvisorSQL Access Advisor Options Define workload type Include dropping indexes Indexes Materialised views Both Limited Comprehensive www.sagecomputing.com.auwww.sagecomputing.com.au98 www.sagecomputing.com.auwww.sagecomputing.com.au99 www.sagecomputing.com.auwww.sagecomputing.com.au100 www.sagecomputing.com.auwww.sagecomputing.com.au101 www.sagecomputing.com.auwww.sagecomputing.com.au102
  • 18. www.sagecomputing.com.auwww.sagecomputing.com.au103 www.sagecomputing.com.auwww.sagecomputing.com.au104 www.sagecomputing.com.auwww.sagecomputing.com.au105 Wait Events www.sagecomputing.com.auwww.sagecomputing.com.au106 Wait Event ClassesWait Event Classes SELECT distinct wait_class#, wait_class FROM v$event_name ORDER BY wait_class# WAIT_CLASS# WAIT_CLASS ----------- ---------------------------------- 0 Other 1 Application 2 Configuration 3 Administrative 4 Concurrency 5 Commit 6 Idle 7 Network 8 User I/O 9 System I/O 10 Scheduler 11 Cluster www.sagecomputing.com.auwww.sagecomputing.com.au107 Wait Event ClassesWait Event Classes Application Includes locking problems Configuration Database configuration problems Administrative Caused by database administration Concurrency Contention for buffers and latches Commit log file synchronisation Idle Waiting for something to do Network Network delays User I/O Disk read / write waits by users, SMON and MMON System I/O Disk read/ write waits by background process except SMON and MMON Scheduler Resource manager waits Cluster RAC waits Other Other insignificant waits www.sagecomputing.com.auwww.sagecomputing.com.au108 What Class is CausingWhat Class is Causing WaitsWaits SELECT wait_class_id, wait_class#, wait_class, total_waits, time_waited FROM v$system_wait_class WAIT_CLASS_ID WAIT_CLASS# WAIT_CLASS TOTAL_WAITS TIME_WAITED ------------- ----------- ------------------------------ ----------- ----------- 1893977003 0 Other 2000 52528 4217450380 1 Application 320 10 3290255840 2 Configuration 111 523 3875070507 4 Concurrency 765 3655 3386400367 5 Commit 527 385 2723168908 6 Idle 555098 11965178 2000153315 7 Network 526262 89 1740759767 8 User I/O 97884 120198 4108307767 9 System I/O 8699 6811
  • 19. www.sagecomputing.com.auwww.sagecomputing.com.au109 User I/O EventsUser I/O Events SELECT name FROM v$event_name WHERE wait_class# = 8 NAME --------------------------- local write wait buffer read retry read by other session db file sequential read db file scattered read db file single write db file parallel read direct path read direct path read temp direct path write direct path write temp BFILE read www.sagecomputing.com.auwww.sagecomputing.com.au110 What Events are CausingWhat Events are Causing User I/O WaitsUser I/O Waits System wait events – User I/O SELECT e.event, e.total_waits, e.total_timeouts, e.time_waited, average_wait FROM v$system_event e, v$event_name n WHERE n.event_id = e.event_id AND n.wait_class# = 8 – User I/O EVENT TOTAL_WAITS TOTAL_TIMEOUTS TIME_WAITED AVERAGE_WAIT ------------------------- ----------- -------------- ----------- ------------ read by other session 45432 0 40824 1 db file sequential read 49525 0 74044 1 db file scattered read 3311 0 5610 2 db file single write 8 0 3 0 db file parallel read 1 0 1 1 direct path read 92 0 34 0 direct path read temp 6 0 0 0 direct path write 108 0 4 0 direct path write temp 35 0 0 0 www.sagecomputing.com.auwww.sagecomputing.com.au111 User I/O ClassUser I/O Class db file sequential read Single block IO May be index access db file scattered read Multi block IO Table full scan or index fast full scan Sort operation db file single write Writing file headers BFILE read Waiting for read of external bfile Direct path read and direct path read temp Sort operations written to disk Parrallel slaves www.sagecomputing.com.auwww.sagecomputing.com.au112 What Objects are CausingWhat Objects are Causing Sequential readsSequential reads SELECT object_name, current_obj#, current_file#, current_block#, wait_time, time_waited FROM v$active_session_history h, dba_objects o WHERE session_id = 141 AND session_serial# = 2 AND o.object_id = h.current_obj# AND event = 'db file sequential read' OBJECT_NAME CURRENT_OBJ# CURRENT_FILE# CURRENT_BLOCK# WAIT_TIME TIME_WAITED --------------- ------------ ------------- -------------- ---------- ----------- BK_LG_EVTNO 54674 8 16442 0 2440 BK_LG_EVTNO 54674 8 16374 0 180 BOOKINGS_LARGE 54577 8 9645 0 20874 BOOKINGS_LARGE 54577 8 8904 0 63567 BOOKINGS_LARGE 54577 8 12850 0 6029 BOOKINGS_LARGE 54577 8 4011 0 13001 BK_LG_EVTNO 54674 8 16265 0 14899 BK_LG_EVTNO 54674 8 16229 0 173 BK_LG_EVTNO 54674 8 16216 0 14479 www.sagecomputing.com.auwww.sagecomputing.com.au113 ExampleExample –– Sequential ReadsSequential Reads www.sagecomputing.com.auwww.sagecomputing.com.au114
  • 21. www.sagecomputing.com.auwww.sagecomputing.com.au121 www.sagecomputing.com.auwww.sagecomputing.com.au122 TuningTuning –– Sequential ReadsSequential Reads Abnormally high wait level may be an index that should not be used For table access For nested loop join Check Statistics on the index are current Optimiser mode is not FIRST_ROWS Column has a histogram if data is skewed There is not an old SQL*Profile Bind peeking If all this is OK – tune the SQL www.sagecomputing.com.auwww.sagecomputing.com.au123 ExampleExample –– Scattered ReadsScattered Reads DECLARE v_1 VARCHAR2(4) := 'VCR1'; v_2 NUMBER; BEGIN SELECT count(b.comments) INTO v_2 FROM bookings_large b WHERE b.resource_code = v_1; v_1 := 'PC1'; FOR counter IN 1..20 LOOP SELECT count(b.comments) INTO v_2 FROM bookings_large b WHERE b.resource_code = v_1; END LOOP; END; www.sagecomputing.com.auwww.sagecomputing.com.au124 Skewed data + HistogramSkewed data + Histogram SELECT resource_code, COUNT(*) FROM bookings_large GROUP BY resource_code RESO COUNT(*) ---- ---------- BRLG 297763 BRSM 148879 CONF 99255 FLPC 99252 LNCH 148881 PC1 9629 TAP1 49626 VCR1 489252 VCR2 99255 SELECT endpoint_number, endpoint_value FROM user_histograms WHERE table_name = 'BOOKINGS_LARGE' AND column_name = 'RESOURCE_CODE' ENDPOINT_NUMBER ENDPOINT_VALUE -------------- -------------- 1198 3.4436E+35 1760 3.4436E+35 2124 3.4949E+35 2456 3.6501E+35 3040 3.9620E+35 3079 4.1675E+35 3279 4.3748E+35 5173 4.4790E+35 5554 4.4790E+35 www.sagecomputing.com.auwww.sagecomputing.com.au125 www.sagecomputing.com.auwww.sagecomputing.com.au126
  • 22. www.sagecomputing.com.auwww.sagecomputing.com.au127 www.sagecomputing.com.auwww.sagecomputing.com.au128 www.sagecomputing.com.auwww.sagecomputing.com.au129 TuningTuning –– Scattered ReadsScattered Reads Abnormally high levels may be a full scan of large table Check Statistics on the table and indexes are current System statistics are gathered Column has a histogram if data is skewed There is not an old SQL*Profile Bind peeking If all this is OK – tune the SQL www.sagecomputing.com.auwww.sagecomputing.com.au130 Bind PeekingBind Peeking Values of bind variable inspected on hard parse Subsequent executions use the same plan If selective value first, subsequent executions may use innapropriate index If non selective value first, subsequent executions may full scan Set _optim_peek_user_binds to FALSE www.sagecomputing.com.auwww.sagecomputing.com.au131 TuningTuning –– I/OI/O Minimise I/O Distribute I/O Tune sorts Tune buffer cache Use KEEP buffer pool for small scans on commonly used tables tables with sequential reads and commonly used data Use RECYCLE buffer pool for random access to large tables www.sagecomputing.com.auwww.sagecomputing.com.au132 Common Tuning Problems - examples
  • 23. www.sagecomputing.com.auwww.sagecomputing.com.au133 www.sagecomputing.com.auwww.sagecomputing.com.au134 www.sagecomputing.com.auwww.sagecomputing.com.au135 www.sagecomputing.com.auwww.sagecomputing.com.au136 www.sagecomputing.com.auwww.sagecomputing.com.au137 Wait EventWait Event –– direct path read tempdirect path read temp Blocks read directly to the user Occurs when sorting performed on disk Sort area determined: By PGA_AGGREGATE target By SORT_AREA_SIZE if manual Default = 20% of SGA Increase for DSS databases www.sagecomputing.com.auwww.sagecomputing.com.au138
  • 24. www.sagecomputing.com.auwww.sagecomputing.com.au139 Wait EventWait Event –– buffer busy waitsbuffer busy waits Wait for a specific buffer that someone else is using Another session may be reading the buffer in Another session may have the block pinned in the buffer Index hot spots Table insert hot spots www.sagecomputing.com.auwww.sagecomputing.com.au140 www.sagecomputing.com.auwww.sagecomputing.com.au141 www.sagecomputing.com.auwww.sagecomputing.com.au142 www.sagecomputing.com.auwww.sagecomputing.com.au143 Find the ObjectFind the Object SELECT object_name, current_obj#, current_file#, current_block#, wait_time, time_waited FROM v$active_session_history h, dba_objects o WHERE o.object_id = h.current_obj# AND event = 'buffer busy waits' OBJECT_NAME CURRENT_OBJ# CURRENT_FILE# CURRENT_BLOCK# WAIT_TIME TIME_WAITED --------------- ------------ ------------- -------------- ---------- ----------- BK_LG_EVTNO 54674 8 14477 0 391 BK_LG_EVTNO 54674 8 15194 17 0 BK_LG_EVTNO 54674 8 15294 1 0 BK_LG_EVTNO 54674 8 22947 0 281891 BK_LG_EVTNO 54674 8 16774 30 0 BK_RES2 54692 8 20465 0 1022386 BK_RES2 54692 8 21655 0 961881 BK_RES2 54692 8 21655 0 961218 BK_RES2 54692 8 21741 0 475933 BK_RES2 54692 8 21741 0 475356 BOOKINGS_LARGE 54577 8 20636 3 0 BOOKINGS_LARGE 54577 8 20746 0 1027986 BOOKINGS_LARGE 54577 8 20844 44 0 BOOKLG_PK 54578 8 19995 0 269731 BOOKLG_PK 54578 8 19995 0 269694 www.sagecomputing.com.auwww.sagecomputing.com.au144 Wait EventWait Event –– buffer busy waitsbuffer busy waits Automatic segment storage management Freelists if not ASSM Reverse key indexes Hash Partitioning Use automatic undo management
  • 25. www.sagecomputing.com.auwww.sagecomputing.com.au145 Wait EventWait Event –– log bufferlog buffer spacespace Wait to write to the log buffer I/O to the log file is not keeping up with write requests to the buffer Move log files to faster drives Increase log buffer www.sagecomputing.com.auwww.sagecomputing.com.au146 www.sagecomputing.com.auwww.sagecomputing.com.au147 www.sagecomputing.com.auwww.sagecomputing.com.au148 Wait EventWait Event –– log file synclog file sync Wait class = Commit Write redo information from log buffer to redo log files On user commit Reduce commit frequency Move redo log files to faster disk www.sagecomputing.com.auwww.sagecomputing.com.au149 Wait EventWait Event –– log file parallellog file parallel writewrite Wait class = System I/O LGWR waiting to write to redo log files May occur in conjunction with log file synclog file sync Move redo log files to faster disk Don’t overdo number of redo group members Reduce amount of redo No logging Global temporary tables www.sagecomputing.com.auwww.sagecomputing.com.au150 Wait EventWait Event –– log file switchlog file switch (archiving needed) Required redo not finished being archived Check alert log Increase archiver processes (checkpoint incomplete) Required log needed to complete checkpoint Check sufficient redo log files (clearing log file) Required logfile waiting to be cleared (completion) Normal log file switch not complete
  • 26. www.sagecomputing.com.auwww.sagecomputing.com.au151 www.sagecomputing.com.auwww.sagecomputing.com.au152 Wait EventWait Event –– library cache latch waitslibrary cache latch waits Library cache latch taken to add new statement Reduce hard parsing Use bind variables Use cursor_sharing = SIMILAR Consider increasing the SGA www.sagecomputing.com.auwww.sagecomputing.com.au153 Wait EventWait Event –– free buffer waitfree buffer wait DBWR not keeping up Look at wait events for DBWR Optimise I/O Buffer cache too big Buffer cache too small www.sagecomputing.com.auwww.sagecomputing.com.au154 Background ProcessesBackground Processes SELECT program, serial#, sid FROM v$session WHERE program like 'ORACLE.EXE%' PROGRAM SERIAL# SID ------------------------------ ---------- ---------- ORACLE.EXE (q002) 2208 128 ORACLE.EXE (MMNL) 1 156 ORACLE.EXE (MMON) 1 158 ORACLE.EXE (QMNC) 3 160 ORACLE.EXE (CJQ0) 1 163 ORACLE.EXE (RECO) 1 164 ORACLE.EXE (SMON) 1 165 ORACLE.EXE (CKPT) 1 166 ORACLE.EXE (LGWR) 1 167 ORACLE.EXE (DBW0) 1 168 ORACLE.EXE (MMAN) 1 169 ORACLE.EXE (PMON) 1 170 www.sagecomputing.com.auwww.sagecomputing.com.au155 Background ProcessBackground Process –– WaitWait EventsEvents SELECT event, wait_time, time_waited FROM v$active_session_history WHERE session_id = 168 AND session_serial# = 1 EVENT WAIT_TIME TIME_WAITED ------------------------------ ---------- ----------- rdbms ipc message 3078109 0 db file parallel write 0 1074 rdbms ipc message 3077900 0 rdbms ipc message 3077814 0 db file parallel write 0 68898 db file parallel write 0 2664 db file parallel write 0 62162 rdbms ipc message 3077741 0 rdbms ipc message 3077854 0 db file parallel write 0 5607 db file parallel write 0 166 db file parallel write 1596 0 db file parallel write 0 161 control file sequential read 222 0 control file sequential read 0 20607 control file sequential read 0 46275 control file sequential read 0 20838 www.sagecomputing.com.auwww.sagecomputing.com.au156 Using ADDM
  • 27. www.sagecomputing.com.auwww.sagecomputing.com.au157 ADDMADDM Automatic Database Diagnostic Monitor Performs self diagnosis Run for each AWR snapshot (hourly) Aim is to reduce DB time Identify bottlenecks Make recommendations Impact Benefit Action and rationale STATISTICS_LEVEL TYPICAL or ALL www.sagecomputing.com.auwww.sagecomputing.com.au158 ADDMADDM Hot objects High resource SQL / PL/SQL / Java Memory structures I/O Performance Log files / archiving / checkpoints Contention RAC issues Documents wait classes not causing problems www.sagecomputing.com.auwww.sagecomputing.com.au159 ADDM RecommendationsADDM Recommendations Tune the SQL Application changes Use of bind variables Sequence caching Schema changes Partitioning Configuration Changes to init parameters Changes to file sizes Hardware changes www.sagecomputing.com.auwww.sagecomputing.com.au160 Accessed through EnterpriseAccessed through Enterprise ManagerManager View ADDM output for up to 7 days www.sagecomputing.com.auwww.sagecomputing.com.au161 Accessed through EnterpriseAccessed through Enterprise ManagerManager View ADDM output for a snapshot www.sagecomputing.com.auwww.sagecomputing.com.au162 ADDM AnalysisADDM Analysis Perform analysis between two snapshots No shutdown between snapshots Run from Enterprise Manager Run using @$ORACLE_HOME/rdbms/admin/addmrpt.sql Run using DBMS_ADVISOR Produces report Text HTML Results in the following views DBA_ADVISOR_TASKS DBA_ADVISOR_LOG DBA_ADVISOR_RECOMMENDATIONS DBA_ADVISOR_FINDINGS
  • 28. www.sagecomputing.com.auwww.sagecomputing.com.au163 DBA_ADVISOR_FINDINGSDBA_ADVISOR_FINDINGS Top 10 findings SELECT type, message FROM (SELECT type, message, count(*) num FROM dba_advisor_findings GROUP BY type, message ORDER BY num desc) WHERE rownum < 10 TYPE MESSAGE ------------ --------------------------------------------------------------------------------------- SYMPTOM Wait class "User I/O" was consuming significant database time. INFORMATION There was no significant database activity to run the ADDM. PROBLEM SQL statements consuming significant database time were found. PROBLEM Wait event "class slave wait" in wait class "Other" was consuming significant database SYMPTOM Wait class "Other" was consuming significant database time. PROBLEM PL/SQL execution consumed significant database time. SYMPTOM The throughput of the I/O subsystem was significantly lower than expected. PROBLEM Individual database segments responsible for significant user I/O wait were found. PROBLEM Time spent on the CPU by the instance was responsible for a substantial part of databas www.sagecomputing.com.auwww.sagecomputing.com.au164 www.sagecomputing.com.auwww.sagecomputing.com.au165 Thank You For Your Attention Enquiries@sagecomputing.com.au Any Questions? SAGE Computing ServicesSAGE Computing Services Customised Oracle Training WorkshopsCustomised Oracle Training Workshops and Consultingand Consulting www.sagecomputing.com.auwww.sagecomputing.com.au