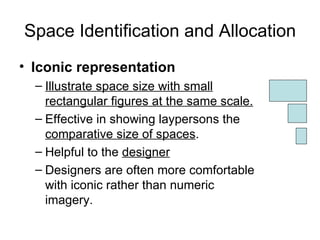
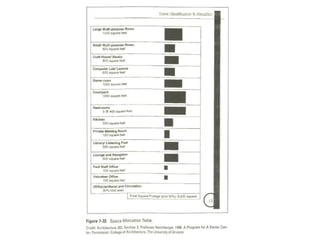
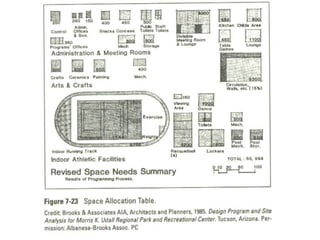
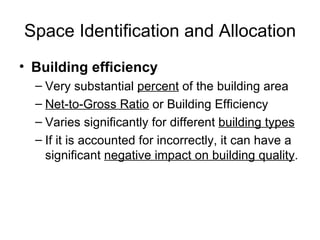
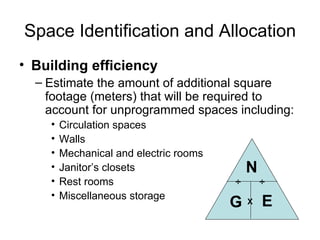
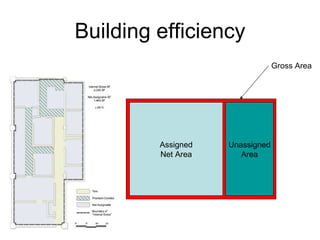
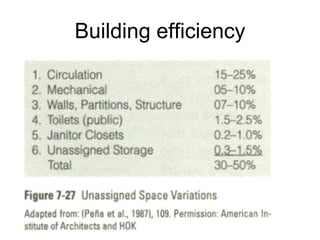
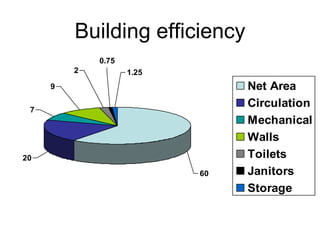
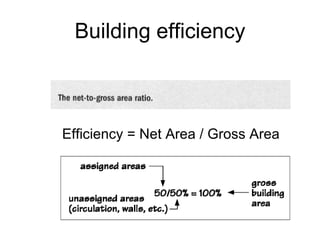
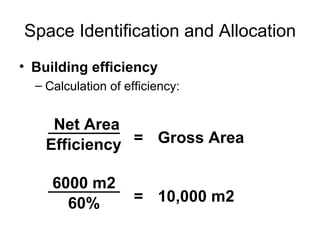
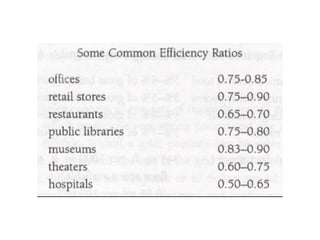
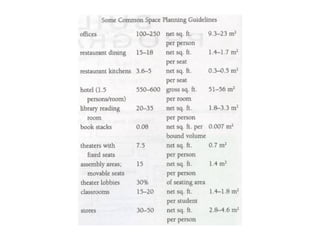
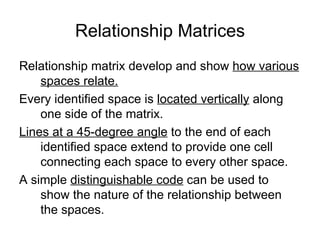
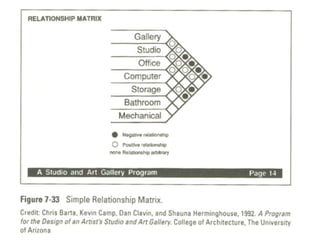
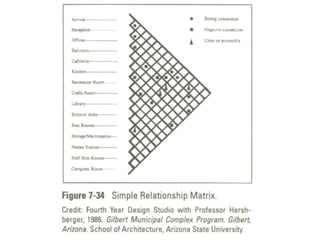
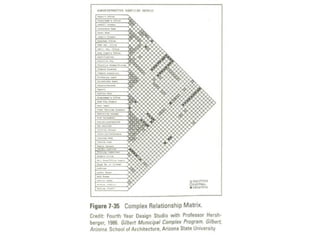
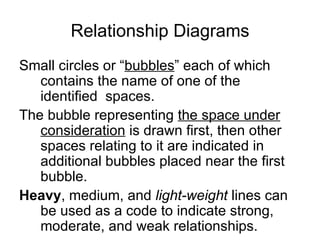
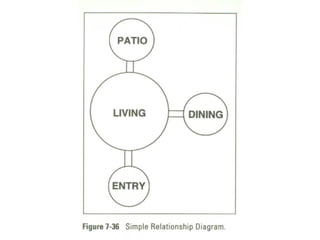
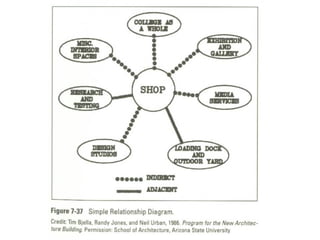
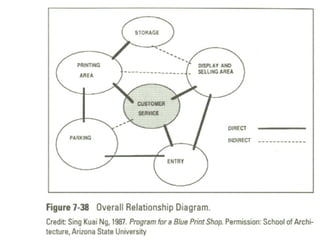
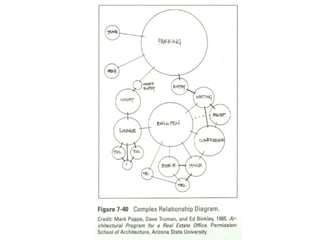
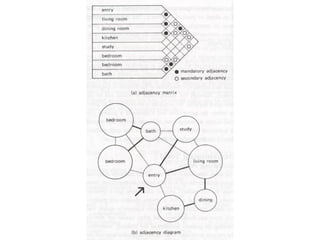
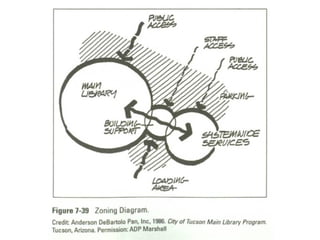
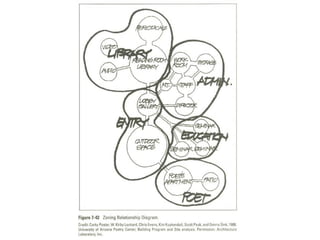
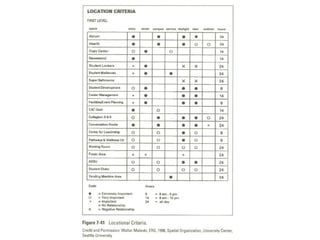
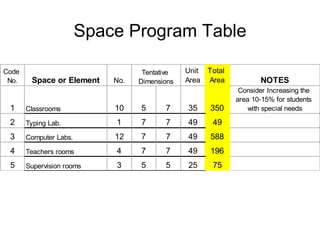
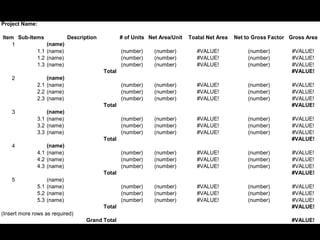
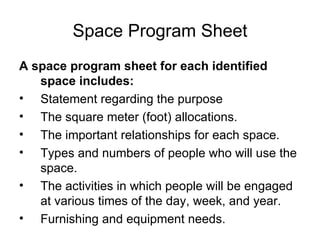
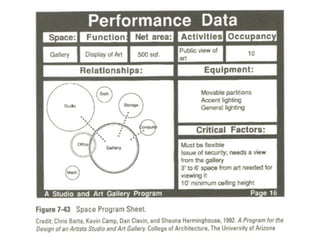
Architectural Design Lectures Lecture 4   Programming Lectures to Architectural Design 1 October 2009 By: Dr. Yasser Mahgoub
Programming – An Overview
Space Identification and Allocation Tabular presentation Iconic representation Building efficiency
Space Identification and Allocation Tabular presentation Brown sheets or Grid sheets Appropriate size for each space
 
Space Identification and Allocation Iconic representation Illustrate space size with small rectangular figures at the same scale. Effective in showing laypersons the  comparative size of spaces . Helpful to the  designer Designers are often more comfortable with iconic rather than numeric imagery.
 
 
Space Identification and Allocation Building efficiency Very substantial  percent  of the building area Net-to-Gross Ratio  or Building Efficiency Varies significantly for different  building types If it is accounted for incorrectly, it can have a significant  negative impact on building quality .
Space Identification and Allocation Building efficiency Estimate the amount of additional square footage (meters) that will be required to account for unprogrammed spaces including: Circulation spaces Walls Mechanical and electric rooms Janitor’s closets Rest rooms Miscellaneous storage N G E X ÷ ÷
Building efficiency Assigned Net Area Unassigned Area Gross Area
Building efficiency
Building efficiency
Efficiency = Net Area / Gross Area Building efficiency
Space Identification and Allocation Building efficiency Calculation of efficiency: Net Area Efficiency = Gross Area 6000 m2 60% = 10,000 m2
 
 
Relationship Matrices Relationship matrix develop and show  how various spaces relate. Every identified space is  located vertically  along one side of the matrix. Lines at a 45-degree angle  to the end of each identified space extend to provide one cell connecting each space to every other space. A simple  distinguishable code  can be used to show the nature of the relationship between the spaces.


Relationship Diagrams Small circles or “ bubbles ” each of which contains the name of one of the identified  spaces. The bubble representing  the space under consideration  is drawn first, then other spaces relating to it are indicated in additional bubbles placed near the first bubble. Heavy , medium, and  light-weight  lines can be used as a code to indicate strong, moderate, and weak relationships.
 
 
Relationship Diagrams For simple buildings , it may be possible to prepare a diagram which, like the relationship matrix, shows the interrelationships of  all  interior and exterior spaces.
Relationship Diagrams As the building becomes  more complex , it is difficult to prepare such a diagram without implying some relationships that may not exist. It may be necessary to  relate only the established major zones of the building.


Space Program Table
 
Space Program Sheet A space program sheet for each identified space includes: Statement regarding the purpose The square meter (foot) allocations. The important relationships for each space. Types and numbers of people who will use the space. The activities in which people will be engaged at various times of the day, week, and year. Furnishing and equipment needs.
Space Program Sheet A space program sheet provides a complete miniature program for the space covered. They are circulated throughout the client’s organization for review, comment, and correction. The following are samples of program sheets.
 
Thank you Dr. Yasser Mahgoub http://ymahgou.fortunecity.com/

Architectural Design 1 Lectures by Dr. Yasser Mahgoub - Lecture 4 - Program

  • 1.
    Architectural Design LecturesLecture 4 Programming Lectures to Architectural Design 1 October 2009 By: Dr. Yasser Mahgoub
  • 2.
  • 3.
    Space Identification andAllocation Tabular presentation Iconic representation Building efficiency
  • 4.
    Space Identification andAllocation Tabular presentation Brown sheets or Grid sheets Appropriate size for each space
  • 5.
  • 6.
    Space Identification andAllocation Iconic representation Illustrate space size with small rectangular figures at the same scale. Effective in showing laypersons the comparative size of spaces . Helpful to the designer Designers are often more comfortable with iconic rather than numeric imagery.
  • 7.
  • 8.
  • 9.
    Space Identification andAllocation Building efficiency Very substantial percent of the building area Net-to-Gross Ratio or Building Efficiency Varies significantly for different building types If it is accounted for incorrectly, it can have a significant negative impact on building quality .
  • 10.
    Space Identification andAllocation Building efficiency Estimate the amount of additional square footage (meters) that will be required to account for unprogrammed spaces including: Circulation spaces Walls Mechanical and electric rooms Janitor’s closets Rest rooms Miscellaneous storage N G E X ÷ ÷
  • 11.
    Building efficiency AssignedNet Area Unassigned Area Gross Area
  • 12.
  • 13.
  • 14.
    Efficiency = NetArea / Gross Area Building efficiency
  • 15.
    Space Identification andAllocation Building efficiency Calculation of efficiency: Net Area Efficiency = Gross Area 6000 m2 60% = 10,000 m2
  • 16.
  • 17.
  • 18.
    Relationship Matrices Relationshipmatrix develop and show how various spaces relate. Every identified space is located vertically along one side of the matrix. Lines at a 45-degree angle to the end of each identified space extend to provide one cell connecting each space to every other space. A simple distinguishable code can be used to show the nature of the relationship between the spaces.
  • 19.
  • 20.
  • 21.
  • 22.
    Relationship Diagrams Smallcircles or “ bubbles ” each of which contains the name of one of the identified spaces. The bubble representing the space under consideration is drawn first, then other spaces relating to it are indicated in additional bubbles placed near the first bubble. Heavy , medium, and light-weight lines can be used as a code to indicate strong, moderate, and weak relationships.
  • 23.
  • 24.
  • 25.
    Relationship Diagrams Forsimple buildings , it may be possible to prepare a diagram which, like the relationship matrix, shows the interrelationships of all interior and exterior spaces.
  • 26.
    Relationship Diagrams Asthe building becomes more complex , it is difficult to prepare such a diagram without implying some relationships that may not exist. It may be necessary to relate only the established major zones of the building.
  • 27.
  • 28.
  • 29.
  • 30.
  • 31.
  • 32.
  • 33.
  • 34.
  • 35.
    Space Program SheetA space program sheet for each identified space includes: Statement regarding the purpose The square meter (foot) allocations. The important relationships for each space. Types and numbers of people who will use the space. The activities in which people will be engaged at various times of the day, week, and year. Furnishing and equipment needs.
  • 36.
    Space Program SheetA space program sheet provides a complete miniature program for the space covered. They are circulated throughout the client’s organization for review, comment, and correction. The following are samples of program sheets.
  • 37.
  • 38.
    Thank you Dr.Yasser Mahgoub http://ymahgou.fortunecity.com/