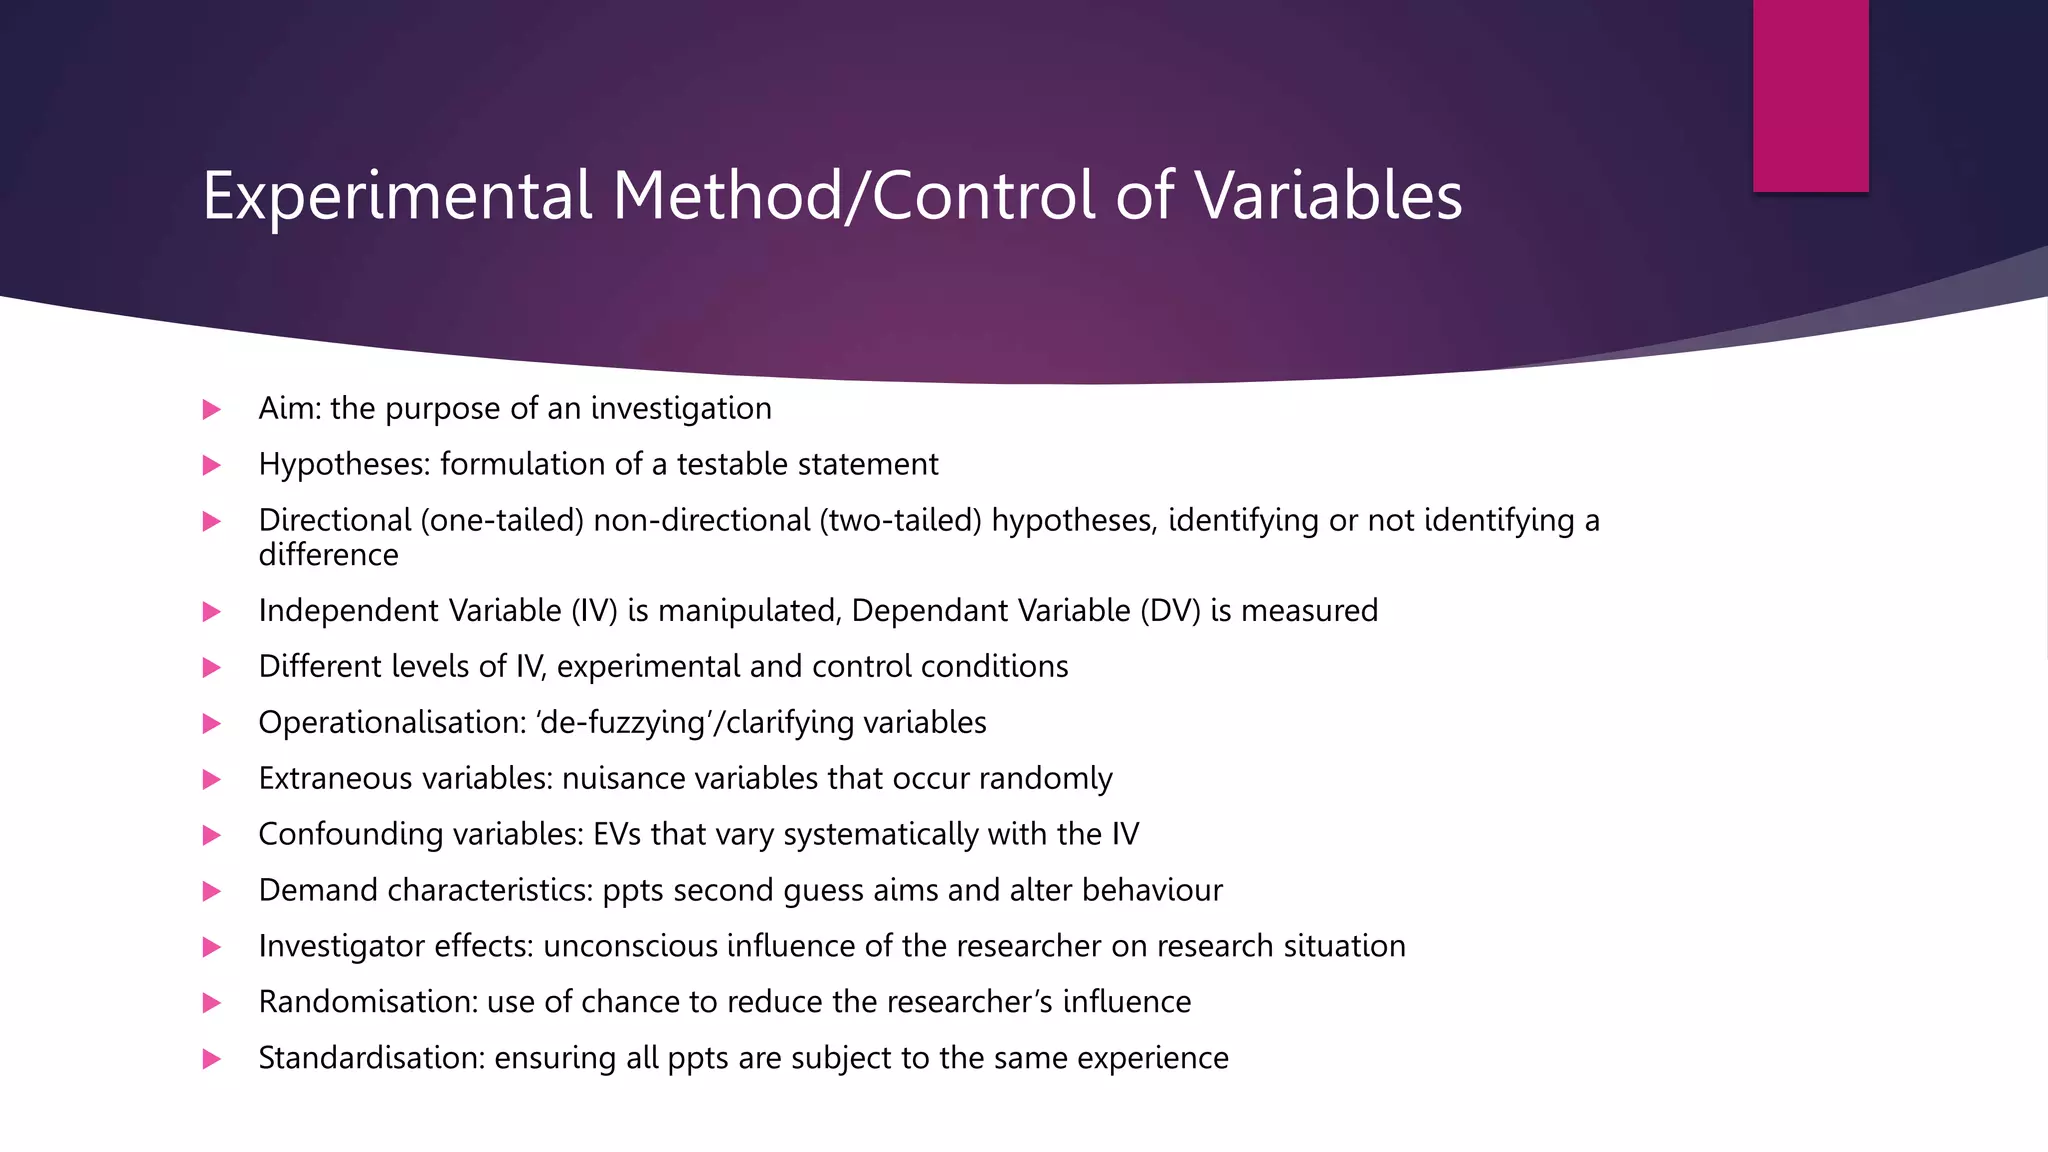
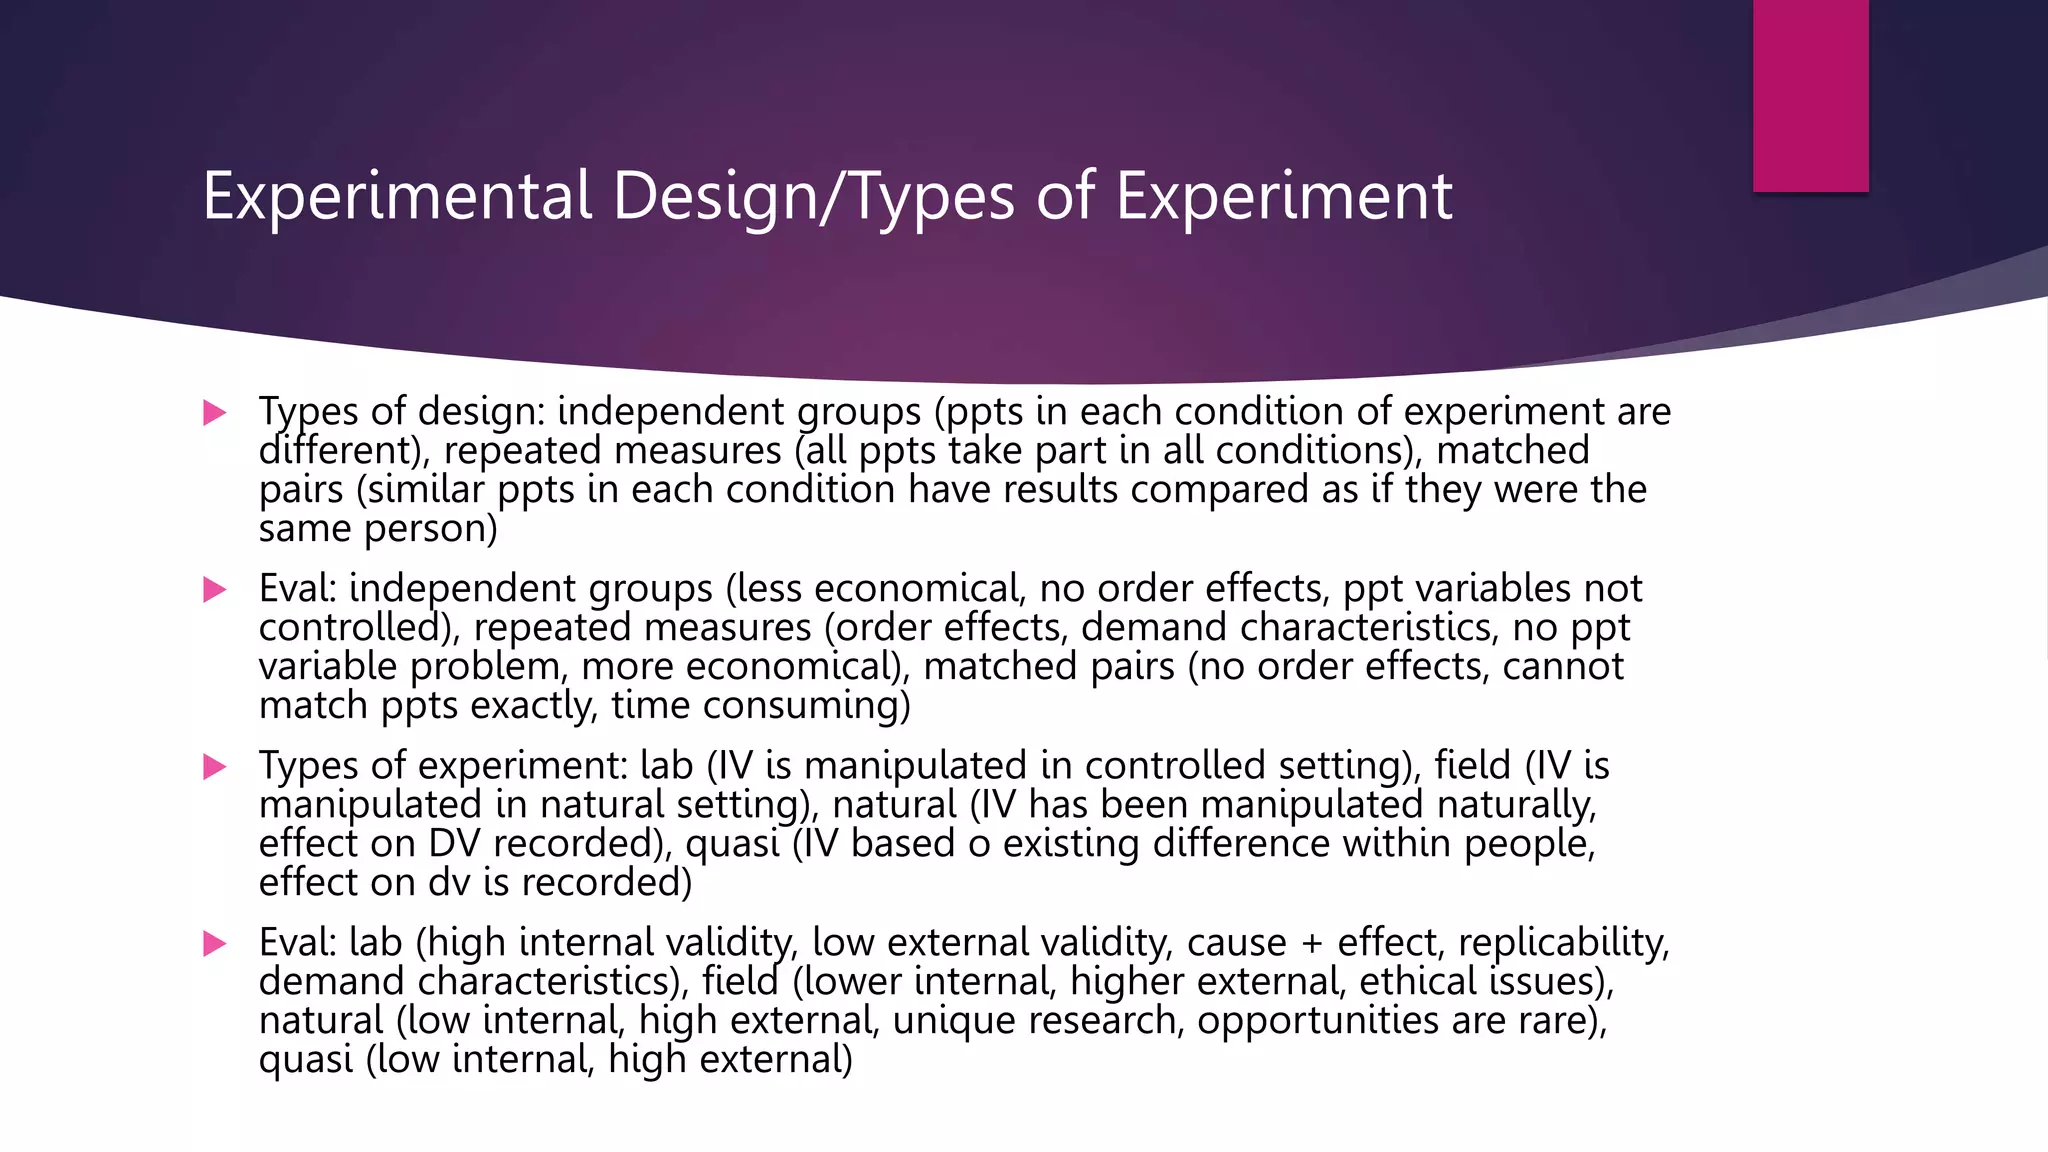
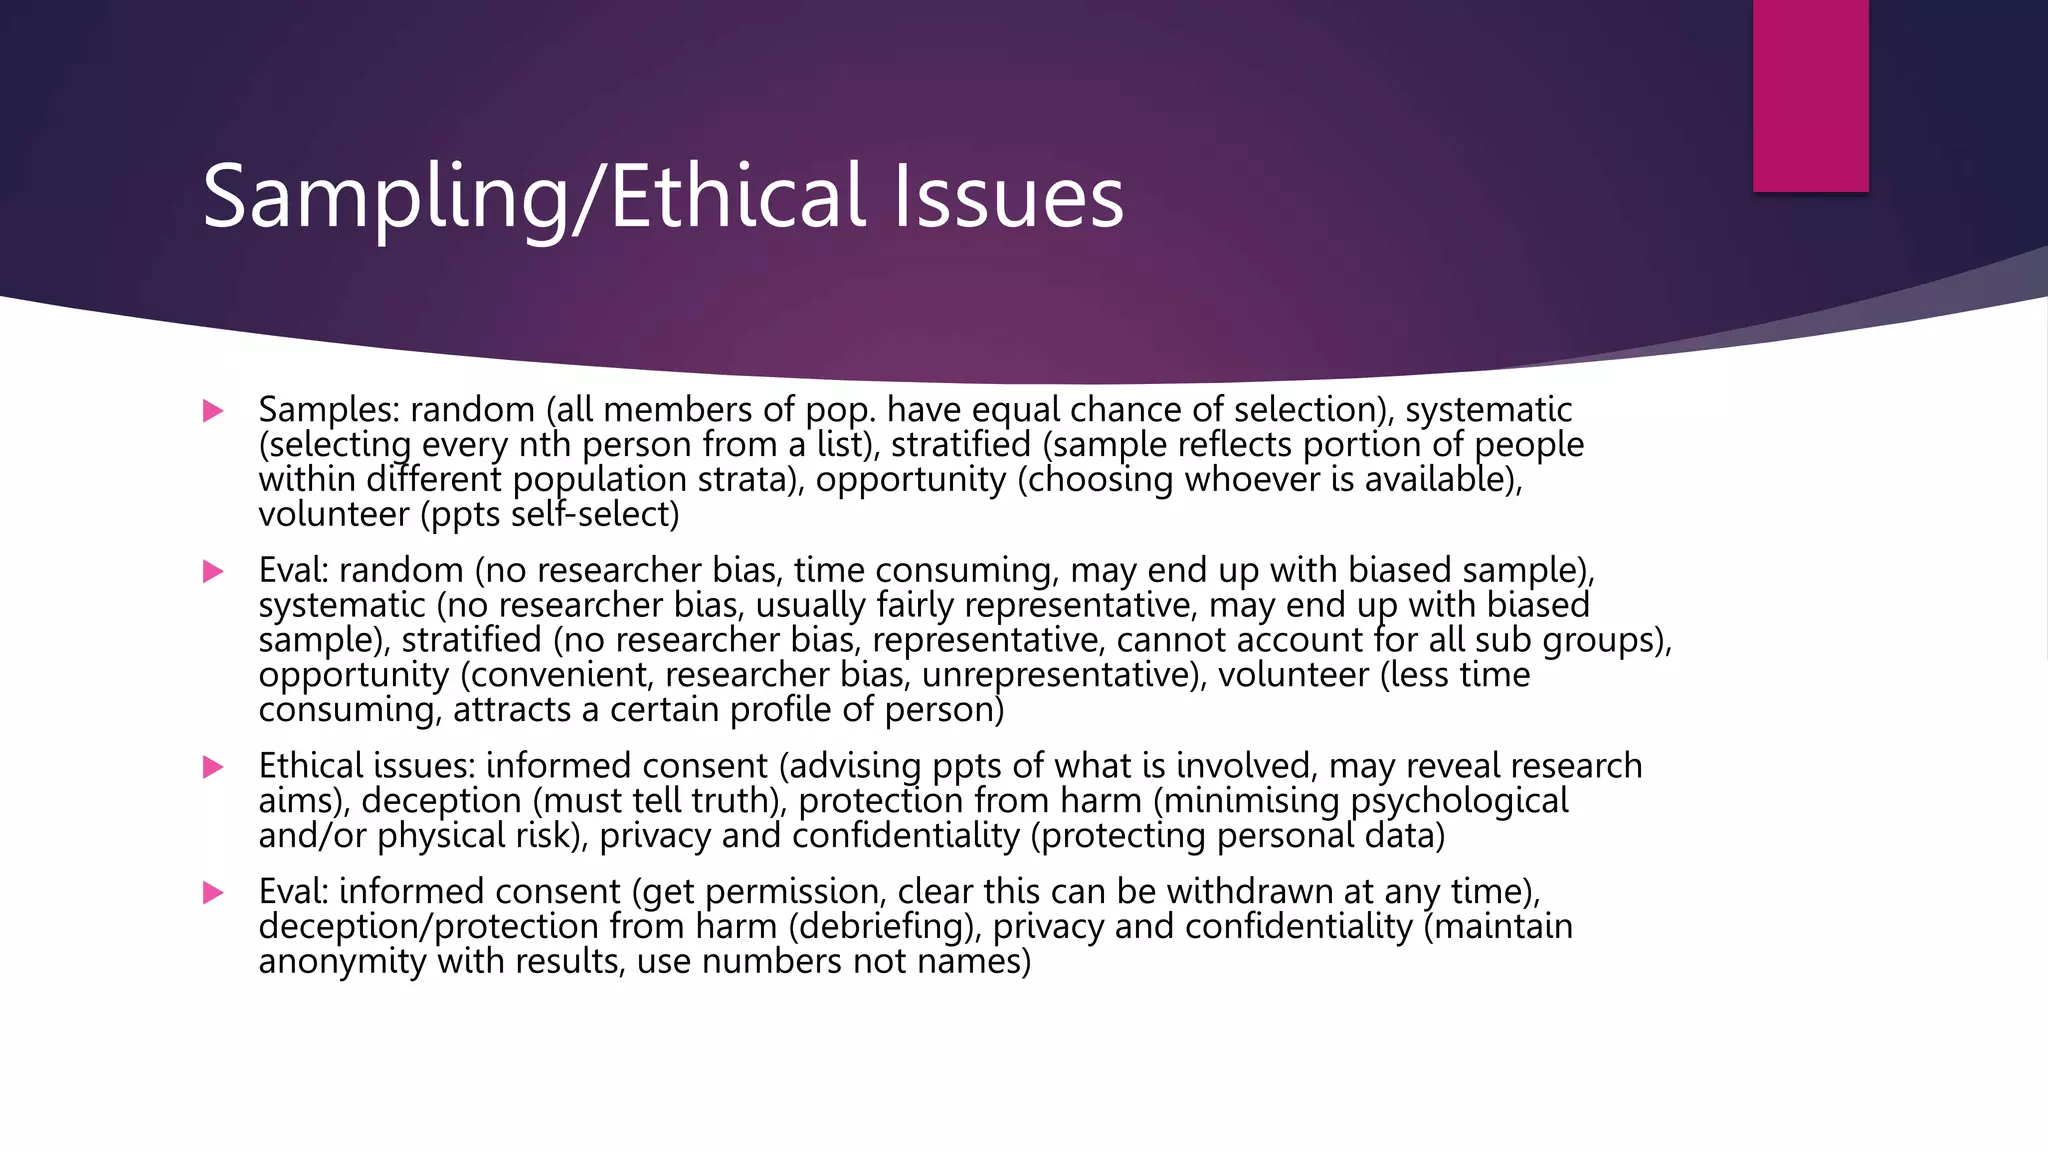
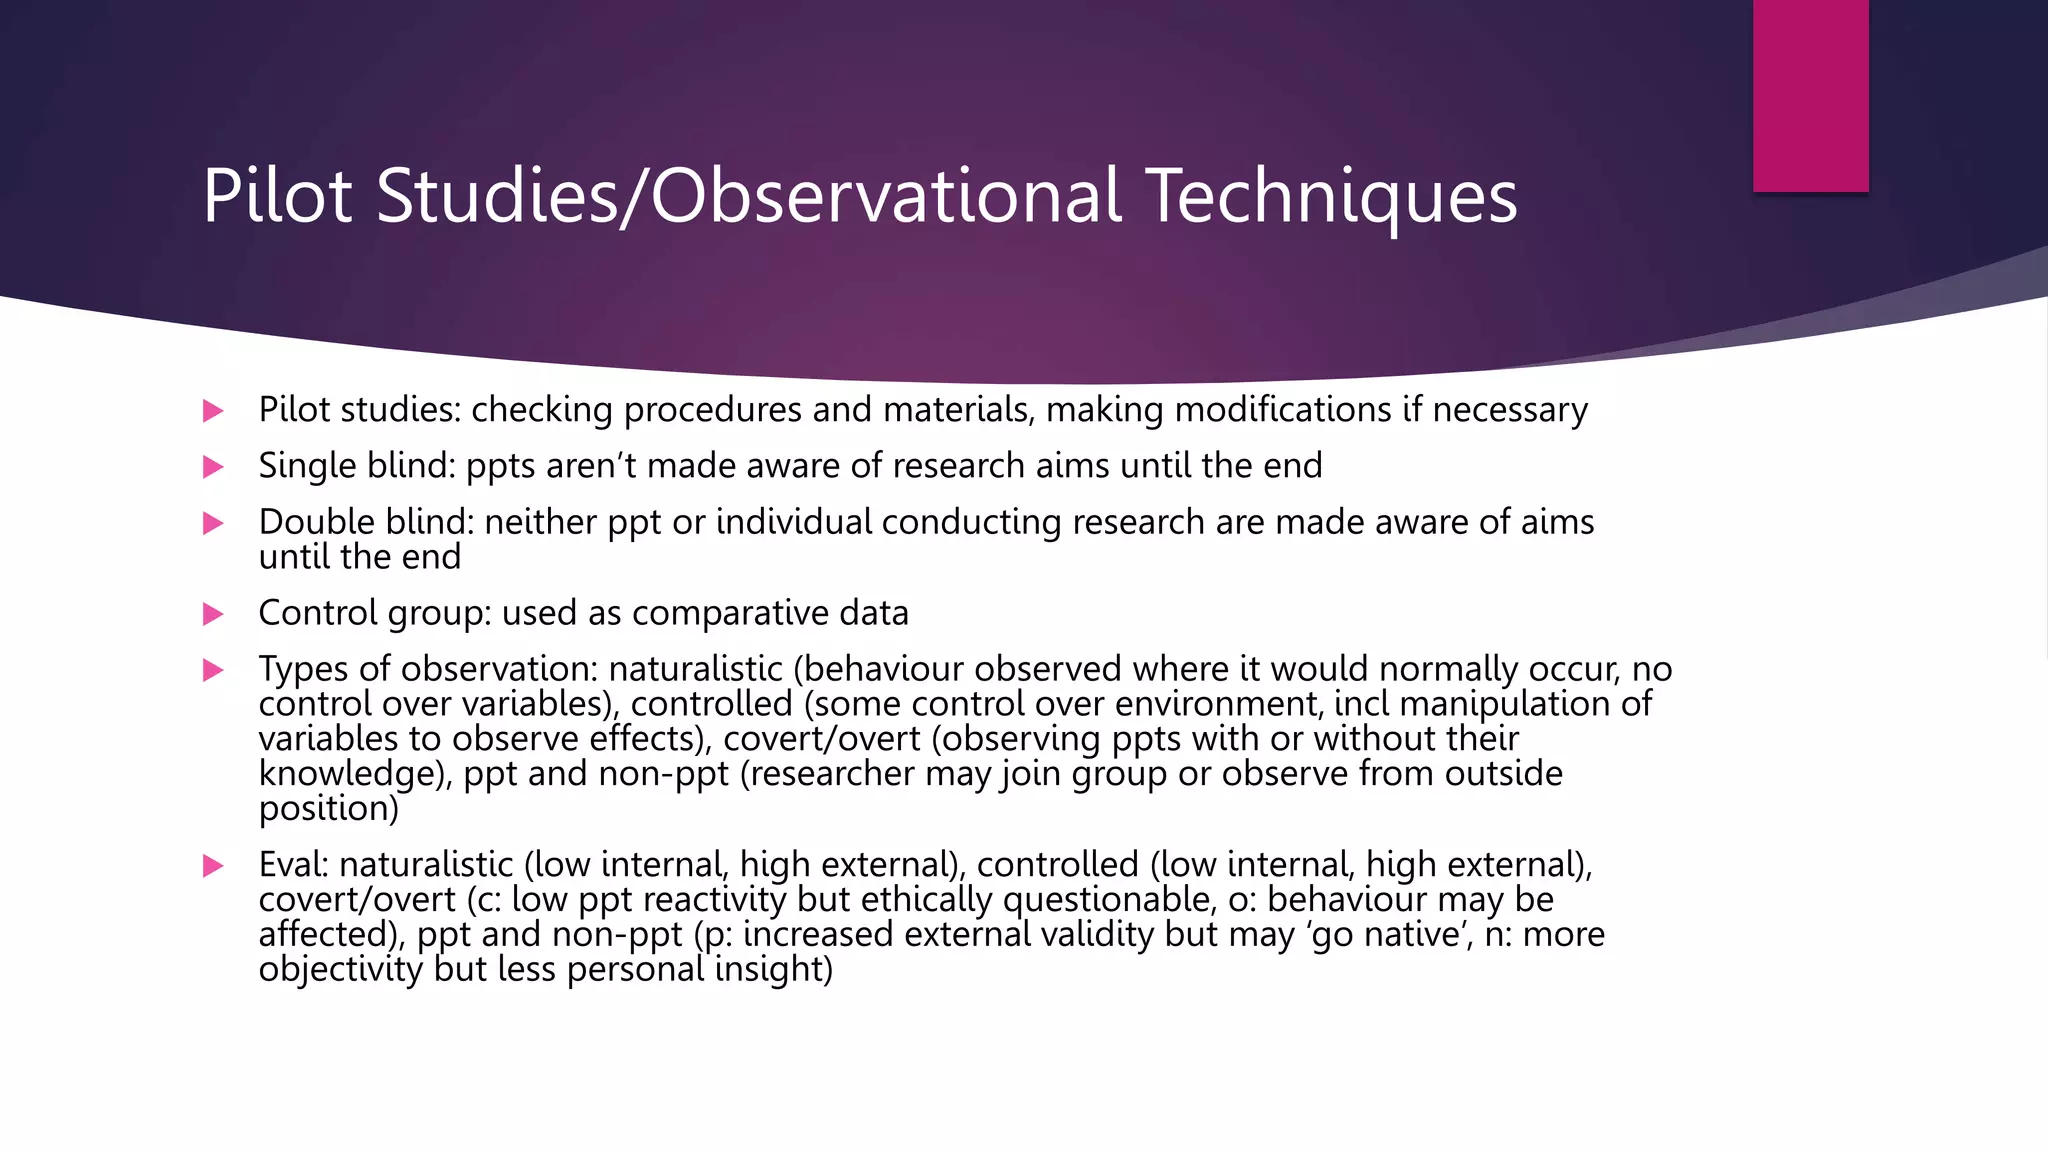
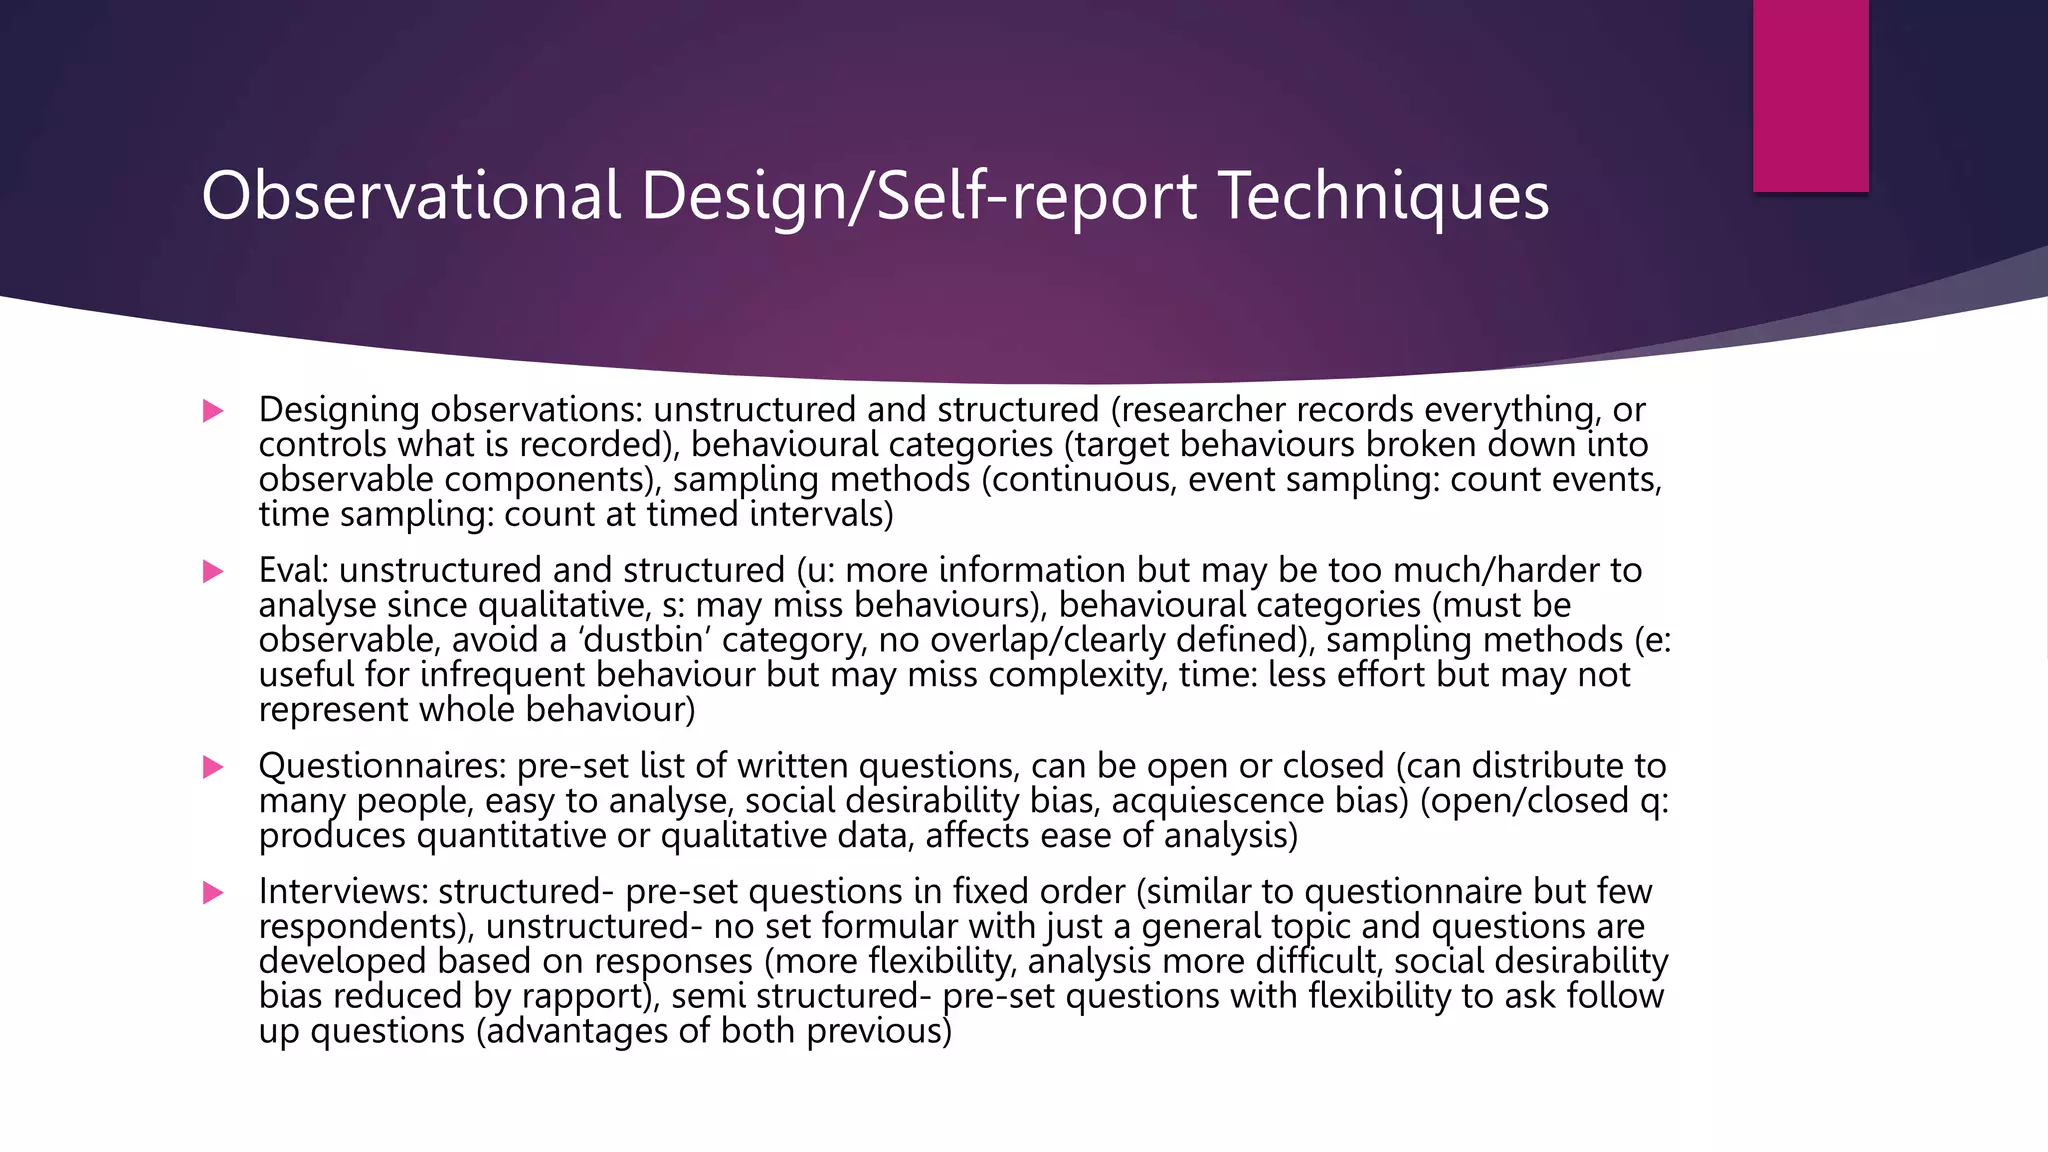
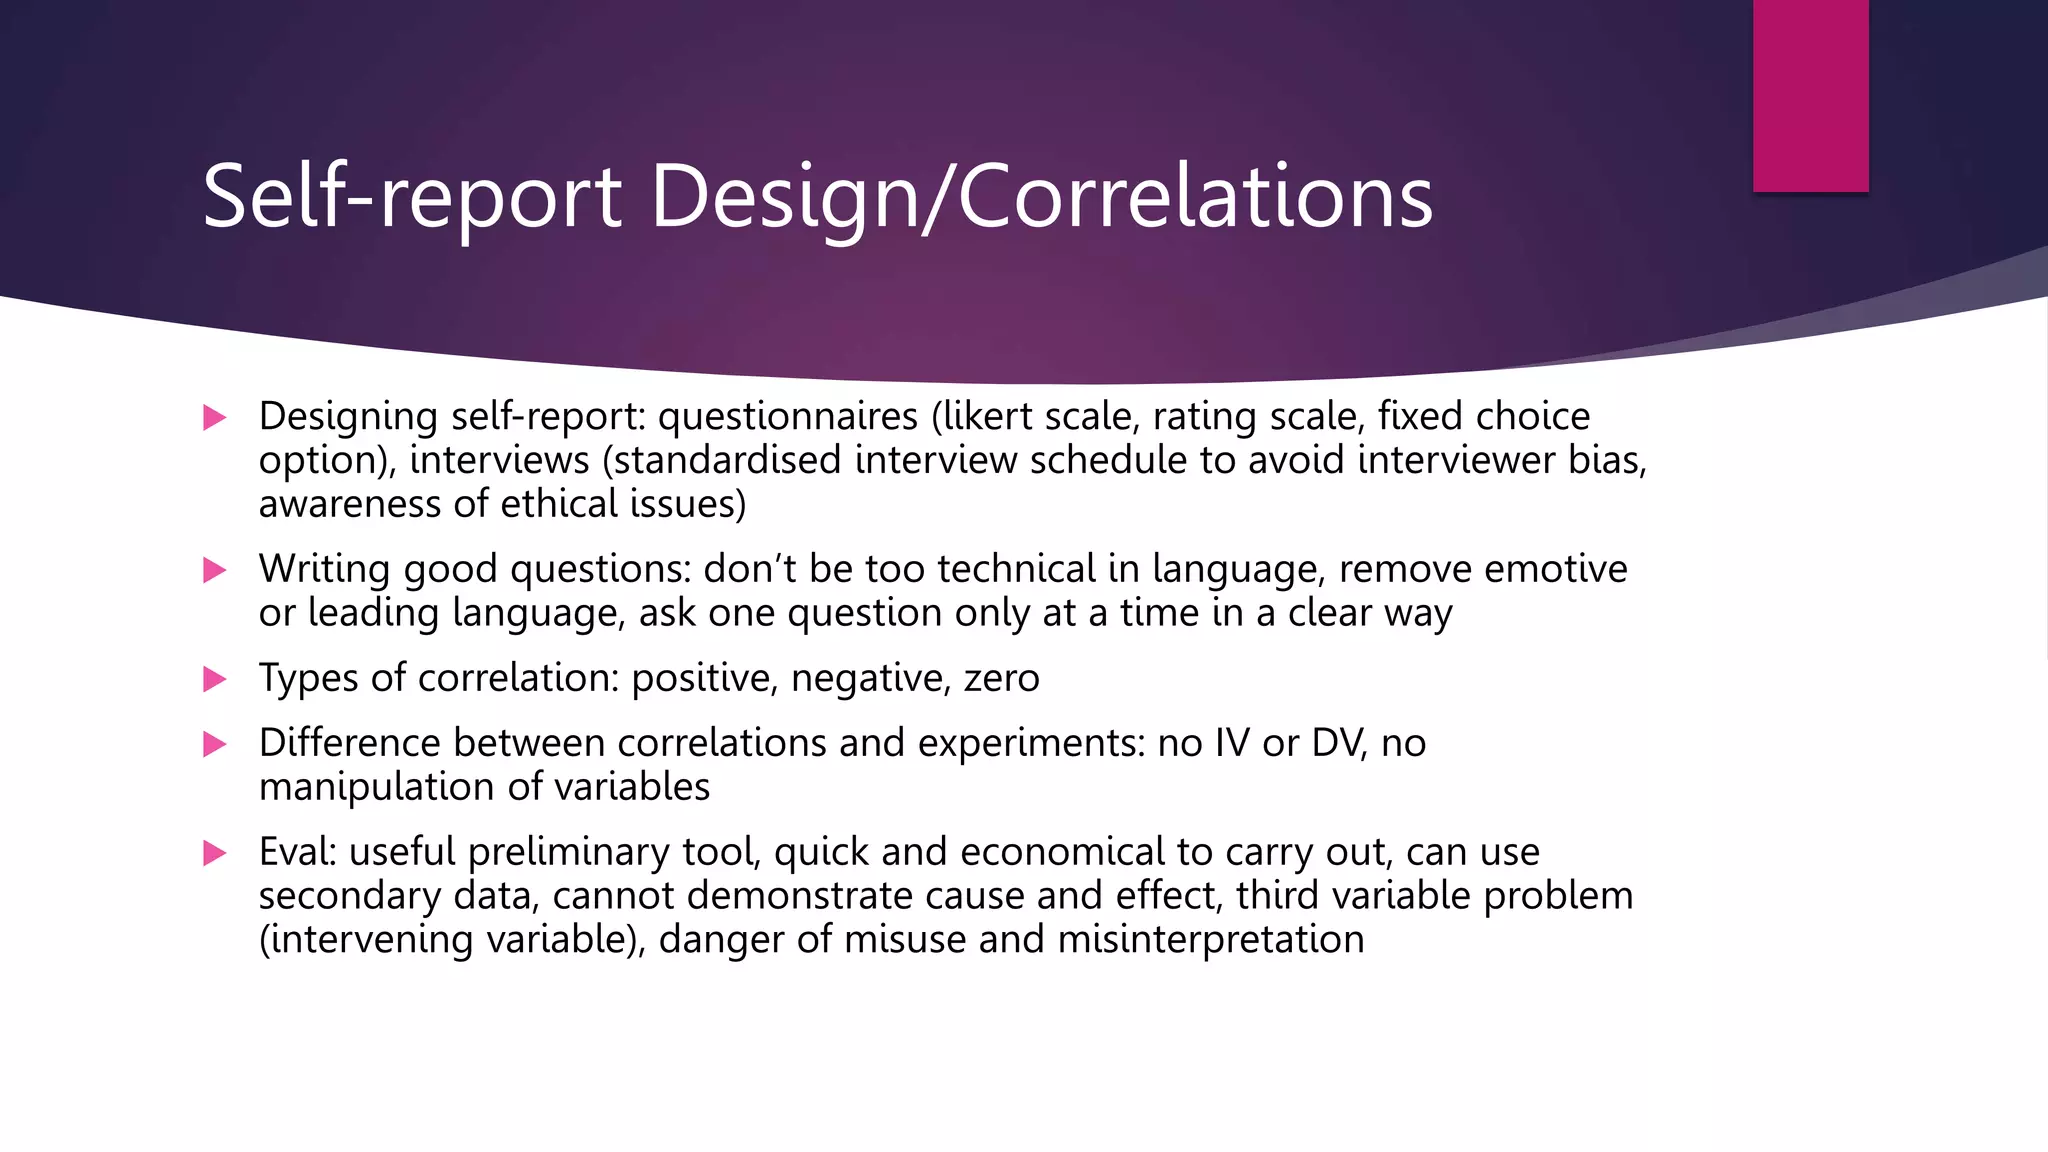
Experimental Method/Control of Variables
 Aim: the purpose of an investigation
 Hypotheses: formulation of a testable statement
 Directional (one-tailed) non-directional (two-tailed) hypotheses, identifying or not identifying a
difference
 Independent Variable (IV) is manipulated, Dependant Variable (DV) is measured
 Different levels of IV, experimental and control conditions
 Operationalisation: ‘de-fuzzying’/clarifying variables
 Extraneous variables: nuisance variables that occur randomly
 Confounding variables: EVs that vary systematically with the IV
 Demand characteristics: ppts second guess aims and alter behaviour
 Investigator effects: unconscious influence of the researcher on research situation
 Randomisation: use of chance to reduce the researcher’s influence
 Standardisation: ensuring all ppts are subject to the same experience
Experimental Design/Types of Experiment
 Types of design: independent groups (ppts in each condition of experiment are
different), repeated measures (all ppts take part in all conditions), matched
pairs (similar ppts in each condition have results compared as if they were the
same person)
 Eval: independent groups (less economical, no order effects, ppt variables not
controlled), repeated measures (order effects, demand characteristics, no ppt
variable problem, more economical), matched pairs (no order effects, cannot
match ppts exactly, time consuming)
 Types of experiment: lab (IV is manipulated in controlled setting), field (IV is
manipulated in natural setting), natural (IV has been manipulated naturally,
effect on DV recorded), quasi (IV based o existing difference within people,
effect on dv is recorded)
 Eval: lab (high internal validity, low external validity, cause + effect, replicability,
demand characteristics), field (lower internal, higher external, ethical issues),
natural (low internal, high external, unique research, opportunities are rare),
quasi (low internal, high external)
Sampling/Ethical Issues
 Samples: random (all members of pop. have equal chance of selection), systematic
(selecting every nth person from a list), stratified (sample reflects portion of people
within different population strata), opportunity (choosing whoever is available),
volunteer (ppts self-select)
 Eval: random (no researcher bias, time consuming, may end up with biased sample),
systematic (no researcher bias, usually fairly representative, may end up with biased
sample), stratified (no researcher bias, representative, cannot account for all sub groups),
opportunity (convenient, researcher bias, unrepresentative), volunteer (less time
consuming, attracts a certain profile of person)
 Ethical issues: informed consent (advising ppts of what is involved, may reveal research
aims), deception (must tell truth), protection from harm (minimising psychological
and/or physical risk), privacy and confidentiality (protecting personal data)
 Eval: informed consent (get permission, clear this can be withdrawn at any time),
deception/protection from harm (debriefing), privacy and confidentiality (maintain
anonymity with results, use numbers not names)
Pilot Studies/Observational Techniques
 Pilot studies: checking procedures and materials, making modifications if necessary
 Single blind: ppts aren’t made aware of research aims until the end
 Double blind: neither ppt or individual conducting research are made aware of aims
until the end
 Control group: used as comparative data
 Types of observation: naturalistic (behaviour observed where it would normally occur, no
control over variables), controlled (some control over environment, incl manipulation of
variables to observe effects), covert/overt (observing ppts with or without their
knowledge), ppt and non-ppt (researcher may join group or observe from outside
position)
 Eval: naturalistic (low internal, high external), controlled (low internal, high external),
covert/overt (c: low ppt reactivity but ethically questionable, o: behaviour may be
affected), ppt and non-ppt (p: increased external validity but may ‘go native’, n: more
objectivity but less personal insight)
Observational Design/Self-report Techniques
 Designing observations: unstructured and structured (researcher records everything, or
controls what is recorded), behavioural categories (target behaviours broken down into
observable components), sampling methods (continuous, event sampling: count events,
time sampling: count at timed intervals)
 Eval: unstructured and structured (u: more information but may be too much/harder to
analyse since qualitative, s: may miss behaviours), behavioural categories (must be
observable, avoid a ‘dustbin’ category, no overlap/clearly defined), sampling methods (e:
useful for infrequent behaviour but may miss complexity, time: less effort but may not
represent whole behaviour)
 Questionnaires: pre-set list of written questions, can be open or closed (can distribute to
many people, easy to analyse, social desirability bias, acquiescence bias) (open/closed q:
produces quantitative or qualitative data, affects ease of analysis)
 Interviews: structured- pre-set questions in fixed order (similar to questionnaire but few
respondents), unstructured- no set formular with just a general topic and questions are
developed based on responses (more flexibility, analysis more difficult, social desirability
bias reduced by rapport), semi structured- pre-set questions with flexibility to ask follow
up questions (advantages of both previous)
Self-report Design/Correlations
 Designing self-report: questionnaires (likert scale, rating scale, fixed choice
option), interviews (standardised interview schedule to avoid interviewer bias,
awareness of ethical issues)
 Writing good questions: don’t be too technical in language, remove emotive
or leading language, ask one question only at a time in a clear way
 Types of correlation: positive, negative, zero
 Difference between correlations and experiments: no IV or DV, no
manipulation of variables
 Eval: useful preliminary tool, quick and economical to carry out, can use
secondary data, cannot demonstrate cause and effect, third variable problem
(intervening variable), danger of misuse and misinterpretation
Kinds of Data/Descriptive Statistics
 Qualitative: written, non-numerical description of ppt’s thought, feelings or opinions (rich in detail,
greater external validity, difficult to analyse, conclusions may be subjective)
 Quantitative: expressed numerically rather than in words (easy to analyse, less biased, narrow in
scope)
 Primary data: collected first hand from ppts for purpose of the investigation (high validity, targets
relevant info, time consuming)
 Secondary data: collected and analysed already, just being repurposed (inexpensive and easy to
access, variation in quality, outdated and potentially incomplete)
 Measures of central tendency: mean (add all up and divide by amount of data points), median
(middle value), mode (most frequently occurring)
 Eval: mean (most sensitive and representative, easily distorted by anomalies), median (not affected
by anomalies, less sensitive), mode (easy to calculate, crude, unrepresentative)
 Measures of dispersion: range (subtract the lowest from the highest, add 1), standard deviation
(measures how much the scores deviate from the mean)
 Eval: range (easy to calculate, may be unrepresentative of the data set), standard deviation (much
more precise than range, can be distorted by extreme values)
Graphs Analysis/Mathematical Content
 Display of data: tables (raw scores are converted to descriptive statistics and
summarised in a table), bar charts (discrete categorical data represented for
clear comparison, the frequency of each category is the height of the bar),
scattergrams (shows the strength and direction of relationship between co-
variables)
 Distributions: normal (bell curve, mean/median/mode at same point, tails
never touch zero), skewed (negative skew leans right, positive skew leans left)
 Percentages and fractions: convert one to other and to decimals
 Decimals: appropriate no of significant figures sometimes asked for
 Ratios: part to whole + part to part
 Symbols: = (equal to), > (less than), < (greater than), >> (much less than), <<
(much greater than), ≈ (approximation), ∝ (proportional to)
Stat testing/Peer Review
 Statistical testing: significance (results have not occurred by chance),
probability (the 5% significance level, 1% if needed immediately or
inaccuracy has danger to life), critical value (comparison with calculated
value to determine significance)
 Sign test: criteria (testing for difference, nominal data, repeated measures),
steps (convert to nominal data, add up pluses and minuses, S = less
frequent sign, compare calculated value of S with critical value)
 Peer review: finding (approval of project proposals), validation (quality
check), improvements (minor revisions or rejection of report)
 Eval: anonymity may permit unjustified criticisms by rivals, publication bias,
false impression of current knowledge, chance of burying ground-breaking
research to maintain status quo
Psychology and the Economy
 Examples of how psychological research can have
economic/social effects
 Attachment research: equal care from mother and father,
means both can work without detriment, more effective
contribution to the economy
 Mental health research: absenteeism due to mental health
issues costs the economy, more effective treatment can get
people back to work
Reliability and Validity
 Reliability: how consistent a measuring device is
 Test-retest: way of testing reliability by assessing the same individual on two adequately-
spaced occasions
 Inter-observer: way of testing reliability by having two or more observers use the same
method for an observation and calculating to what extent they agree on conclusions.
General high reliability for this is +.80
 Validity: the extent to which an observed effect is genuine, if it is measuring what it is
intended to etc.
 Face validity: measure is scrutinised to determine whether it appears to measure what it
is supposed to
 Concurrent validity: the extent to which a psychological measure relates to an
existing similar measure
 Ecological validity: the extent to which findings from a study can be generalised to other
similar settings and/or scenarios
 Temporal validity: the extent to which findings from a study can be generalised to other
historical times and eras
Features of science
 Objectivity: all sources of personal bias are minimised so as not to distort or influence
the research process
 Empirical method: scientific approaches that are based on the gathering of evidence
through direct observation and experience
 Replicability: the extent to which scientific procedures and findings can be repeated by
other researchers
 Falsifiability: the principle that a theory cannot be considered scientific unless it accepts
the possibility of being proven untrue
 Theory construction: the process of developing an explanation for the causes of
behaviour by systematically gathering evidence and then organising this into a coherent
account
 Hypothesis testing: a key feature of a theory is that it should produce statements which
can then be tested. Only in this way can a theory be falsified
 Paradigm: a set of shared assumptions and agreed method within a scientific discipline
 Paradigm shift: the result of a scientific revolution when there is a significant change in
the dominant unifying theory within a scientific discipline

AQA Psychology A Level Revision Cards - Research Methods Topic

  • 1.
    Experimental Method/Control ofVariables  Aim: the purpose of an investigation  Hypotheses: formulation of a testable statement  Directional (one-tailed) non-directional (two-tailed) hypotheses, identifying or not identifying a difference  Independent Variable (IV) is manipulated, Dependant Variable (DV) is measured  Different levels of IV, experimental and control conditions  Operationalisation: ‘de-fuzzying’/clarifying variables  Extraneous variables: nuisance variables that occur randomly  Confounding variables: EVs that vary systematically with the IV  Demand characteristics: ppts second guess aims and alter behaviour  Investigator effects: unconscious influence of the researcher on research situation  Randomisation: use of chance to reduce the researcher’s influence  Standardisation: ensuring all ppts are subject to the same experience
  • 2.
    Experimental Design/Types ofExperiment  Types of design: independent groups (ppts in each condition of experiment are different), repeated measures (all ppts take part in all conditions), matched pairs (similar ppts in each condition have results compared as if they were the same person)  Eval: independent groups (less economical, no order effects, ppt variables not controlled), repeated measures (order effects, demand characteristics, no ppt variable problem, more economical), matched pairs (no order effects, cannot match ppts exactly, time consuming)  Types of experiment: lab (IV is manipulated in controlled setting), field (IV is manipulated in natural setting), natural (IV has been manipulated naturally, effect on DV recorded), quasi (IV based o existing difference within people, effect on dv is recorded)  Eval: lab (high internal validity, low external validity, cause + effect, replicability, demand characteristics), field (lower internal, higher external, ethical issues), natural (low internal, high external, unique research, opportunities are rare), quasi (low internal, high external)
  • 3.
    Sampling/Ethical Issues  Samples:random (all members of pop. have equal chance of selection), systematic (selecting every nth person from a list), stratified (sample reflects portion of people within different population strata), opportunity (choosing whoever is available), volunteer (ppts self-select)  Eval: random (no researcher bias, time consuming, may end up with biased sample), systematic (no researcher bias, usually fairly representative, may end up with biased sample), stratified (no researcher bias, representative, cannot account for all sub groups), opportunity (convenient, researcher bias, unrepresentative), volunteer (less time consuming, attracts a certain profile of person)  Ethical issues: informed consent (advising ppts of what is involved, may reveal research aims), deception (must tell truth), protection from harm (minimising psychological and/or physical risk), privacy and confidentiality (protecting personal data)  Eval: informed consent (get permission, clear this can be withdrawn at any time), deception/protection from harm (debriefing), privacy and confidentiality (maintain anonymity with results, use numbers not names)
  • 4.
    Pilot Studies/Observational Techniques Pilot studies: checking procedures and materials, making modifications if necessary  Single blind: ppts aren’t made aware of research aims until the end  Double blind: neither ppt or individual conducting research are made aware of aims until the end  Control group: used as comparative data  Types of observation: naturalistic (behaviour observed where it would normally occur, no control over variables), controlled (some control over environment, incl manipulation of variables to observe effects), covert/overt (observing ppts with or without their knowledge), ppt and non-ppt (researcher may join group or observe from outside position)  Eval: naturalistic (low internal, high external), controlled (low internal, high external), covert/overt (c: low ppt reactivity but ethically questionable, o: behaviour may be affected), ppt and non-ppt (p: increased external validity but may ‘go native’, n: more objectivity but less personal insight)
  • 5.
    Observational Design/Self-report Techniques Designing observations: unstructured and structured (researcher records everything, or controls what is recorded), behavioural categories (target behaviours broken down into observable components), sampling methods (continuous, event sampling: count events, time sampling: count at timed intervals)  Eval: unstructured and structured (u: more information but may be too much/harder to analyse since qualitative, s: may miss behaviours), behavioural categories (must be observable, avoid a ‘dustbin’ category, no overlap/clearly defined), sampling methods (e: useful for infrequent behaviour but may miss complexity, time: less effort but may not represent whole behaviour)  Questionnaires: pre-set list of written questions, can be open or closed (can distribute to many people, easy to analyse, social desirability bias, acquiescence bias) (open/closed q: produces quantitative or qualitative data, affects ease of analysis)  Interviews: structured- pre-set questions in fixed order (similar to questionnaire but few respondents), unstructured- no set formular with just a general topic and questions are developed based on responses (more flexibility, analysis more difficult, social desirability bias reduced by rapport), semi structured- pre-set questions with flexibility to ask follow up questions (advantages of both previous)
  • 6.
    Self-report Design/Correlations  Designingself-report: questionnaires (likert scale, rating scale, fixed choice option), interviews (standardised interview schedule to avoid interviewer bias, awareness of ethical issues)  Writing good questions: don’t be too technical in language, remove emotive or leading language, ask one question only at a time in a clear way  Types of correlation: positive, negative, zero  Difference between correlations and experiments: no IV or DV, no manipulation of variables  Eval: useful preliminary tool, quick and economical to carry out, can use secondary data, cannot demonstrate cause and effect, third variable problem (intervening variable), danger of misuse and misinterpretation
  • 7.
    Kinds of Data/DescriptiveStatistics  Qualitative: written, non-numerical description of ppt’s thought, feelings or opinions (rich in detail, greater external validity, difficult to analyse, conclusions may be subjective)  Quantitative: expressed numerically rather than in words (easy to analyse, less biased, narrow in scope)  Primary data: collected first hand from ppts for purpose of the investigation (high validity, targets relevant info, time consuming)  Secondary data: collected and analysed already, just being repurposed (inexpensive and easy to access, variation in quality, outdated and potentially incomplete)  Measures of central tendency: mean (add all up and divide by amount of data points), median (middle value), mode (most frequently occurring)  Eval: mean (most sensitive and representative, easily distorted by anomalies), median (not affected by anomalies, less sensitive), mode (easy to calculate, crude, unrepresentative)  Measures of dispersion: range (subtract the lowest from the highest, add 1), standard deviation (measures how much the scores deviate from the mean)  Eval: range (easy to calculate, may be unrepresentative of the data set), standard deviation (much more precise than range, can be distorted by extreme values)
  • 8.
    Graphs Analysis/Mathematical Content Display of data: tables (raw scores are converted to descriptive statistics and summarised in a table), bar charts (discrete categorical data represented for clear comparison, the frequency of each category is the height of the bar), scattergrams (shows the strength and direction of relationship between co- variables)  Distributions: normal (bell curve, mean/median/mode at same point, tails never touch zero), skewed (negative skew leans right, positive skew leans left)  Percentages and fractions: convert one to other and to decimals  Decimals: appropriate no of significant figures sometimes asked for  Ratios: part to whole + part to part  Symbols: = (equal to), > (less than), < (greater than), >> (much less than), << (much greater than), ≈ (approximation), ∝ (proportional to)
  • 9.
    Stat testing/Peer Review Statistical testing: significance (results have not occurred by chance), probability (the 5% significance level, 1% if needed immediately or inaccuracy has danger to life), critical value (comparison with calculated value to determine significance)  Sign test: criteria (testing for difference, nominal data, repeated measures), steps (convert to nominal data, add up pluses and minuses, S = less frequent sign, compare calculated value of S with critical value)  Peer review: finding (approval of project proposals), validation (quality check), improvements (minor revisions or rejection of report)  Eval: anonymity may permit unjustified criticisms by rivals, publication bias, false impression of current knowledge, chance of burying ground-breaking research to maintain status quo
  • 10.
    Psychology and theEconomy  Examples of how psychological research can have economic/social effects  Attachment research: equal care from mother and father, means both can work without detriment, more effective contribution to the economy  Mental health research: absenteeism due to mental health issues costs the economy, more effective treatment can get people back to work
  • 11.
    Reliability and Validity Reliability: how consistent a measuring device is  Test-retest: way of testing reliability by assessing the same individual on two adequately- spaced occasions  Inter-observer: way of testing reliability by having two or more observers use the same method for an observation and calculating to what extent they agree on conclusions. General high reliability for this is +.80  Validity: the extent to which an observed effect is genuine, if it is measuring what it is intended to etc.  Face validity: measure is scrutinised to determine whether it appears to measure what it is supposed to  Concurrent validity: the extent to which a psychological measure relates to an existing similar measure  Ecological validity: the extent to which findings from a study can be generalised to other similar settings and/or scenarios  Temporal validity: the extent to which findings from a study can be generalised to other historical times and eras
  • 12.
    Features of science Objectivity: all sources of personal bias are minimised so as not to distort or influence the research process  Empirical method: scientific approaches that are based on the gathering of evidence through direct observation and experience  Replicability: the extent to which scientific procedures and findings can be repeated by other researchers  Falsifiability: the principle that a theory cannot be considered scientific unless it accepts the possibility of being proven untrue  Theory construction: the process of developing an explanation for the causes of behaviour by systematically gathering evidence and then organising this into a coherent account  Hypothesis testing: a key feature of a theory is that it should produce statements which can then be tested. Only in this way can a theory be falsified  Paradigm: a set of shared assumptions and agreed method within a scientific discipline  Paradigm shift: the result of a scientific revolution when there is a significant change in the dominant unifying theory within a scientific discipline