Downloaded 689 times


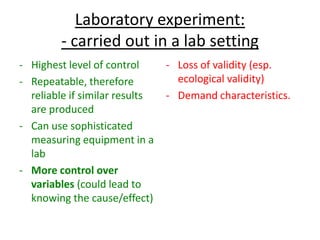
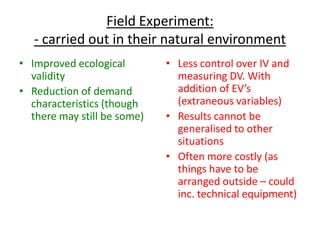
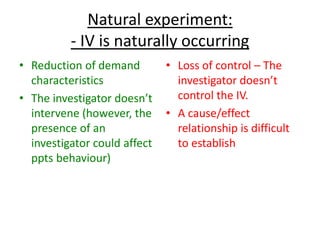
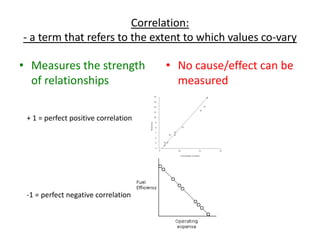
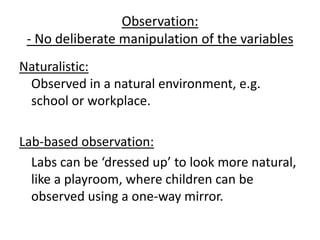
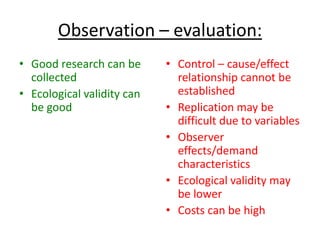
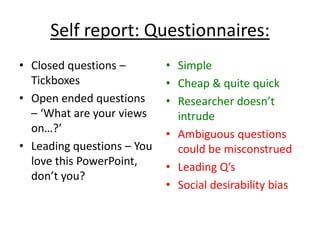
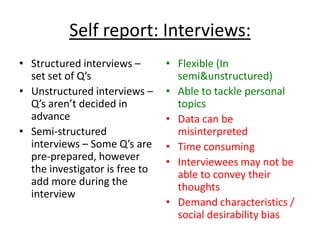
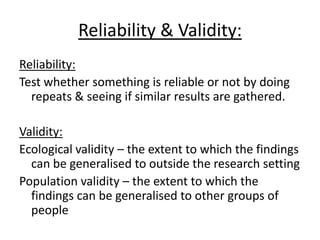
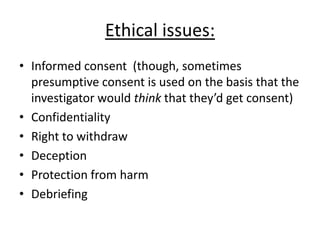
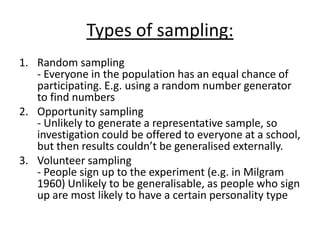
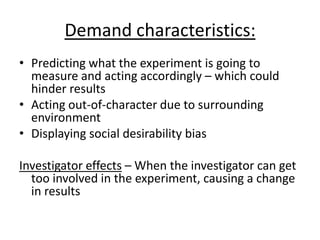
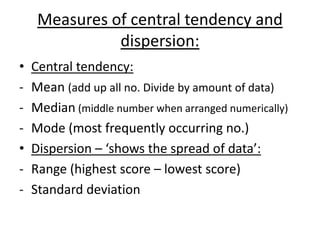
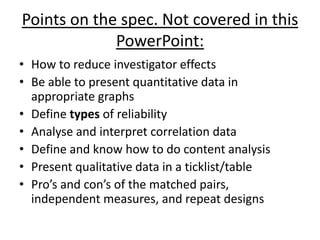

The document outlines various research methods including laboratory, field, and natural experiments, detailing their advantages and disadvantages. It also discusses self-report techniques like questionnaires and interviews, the importance of hypothesis formulation, experimental design types, and ethical considerations in research. Additionally, the document covers reliability and validity, sampling methods, and data analysis techniques, including measures of central tendency and dispersion.


![PSYA3 Cognitive [in progress]](https://cdn.slidesharecdn.com/ss_thumbnails/psya3cognitiveupdated2-130528174445-phpapp01-thumbnail.jpg?width=640&height=640&fit=bounds)


