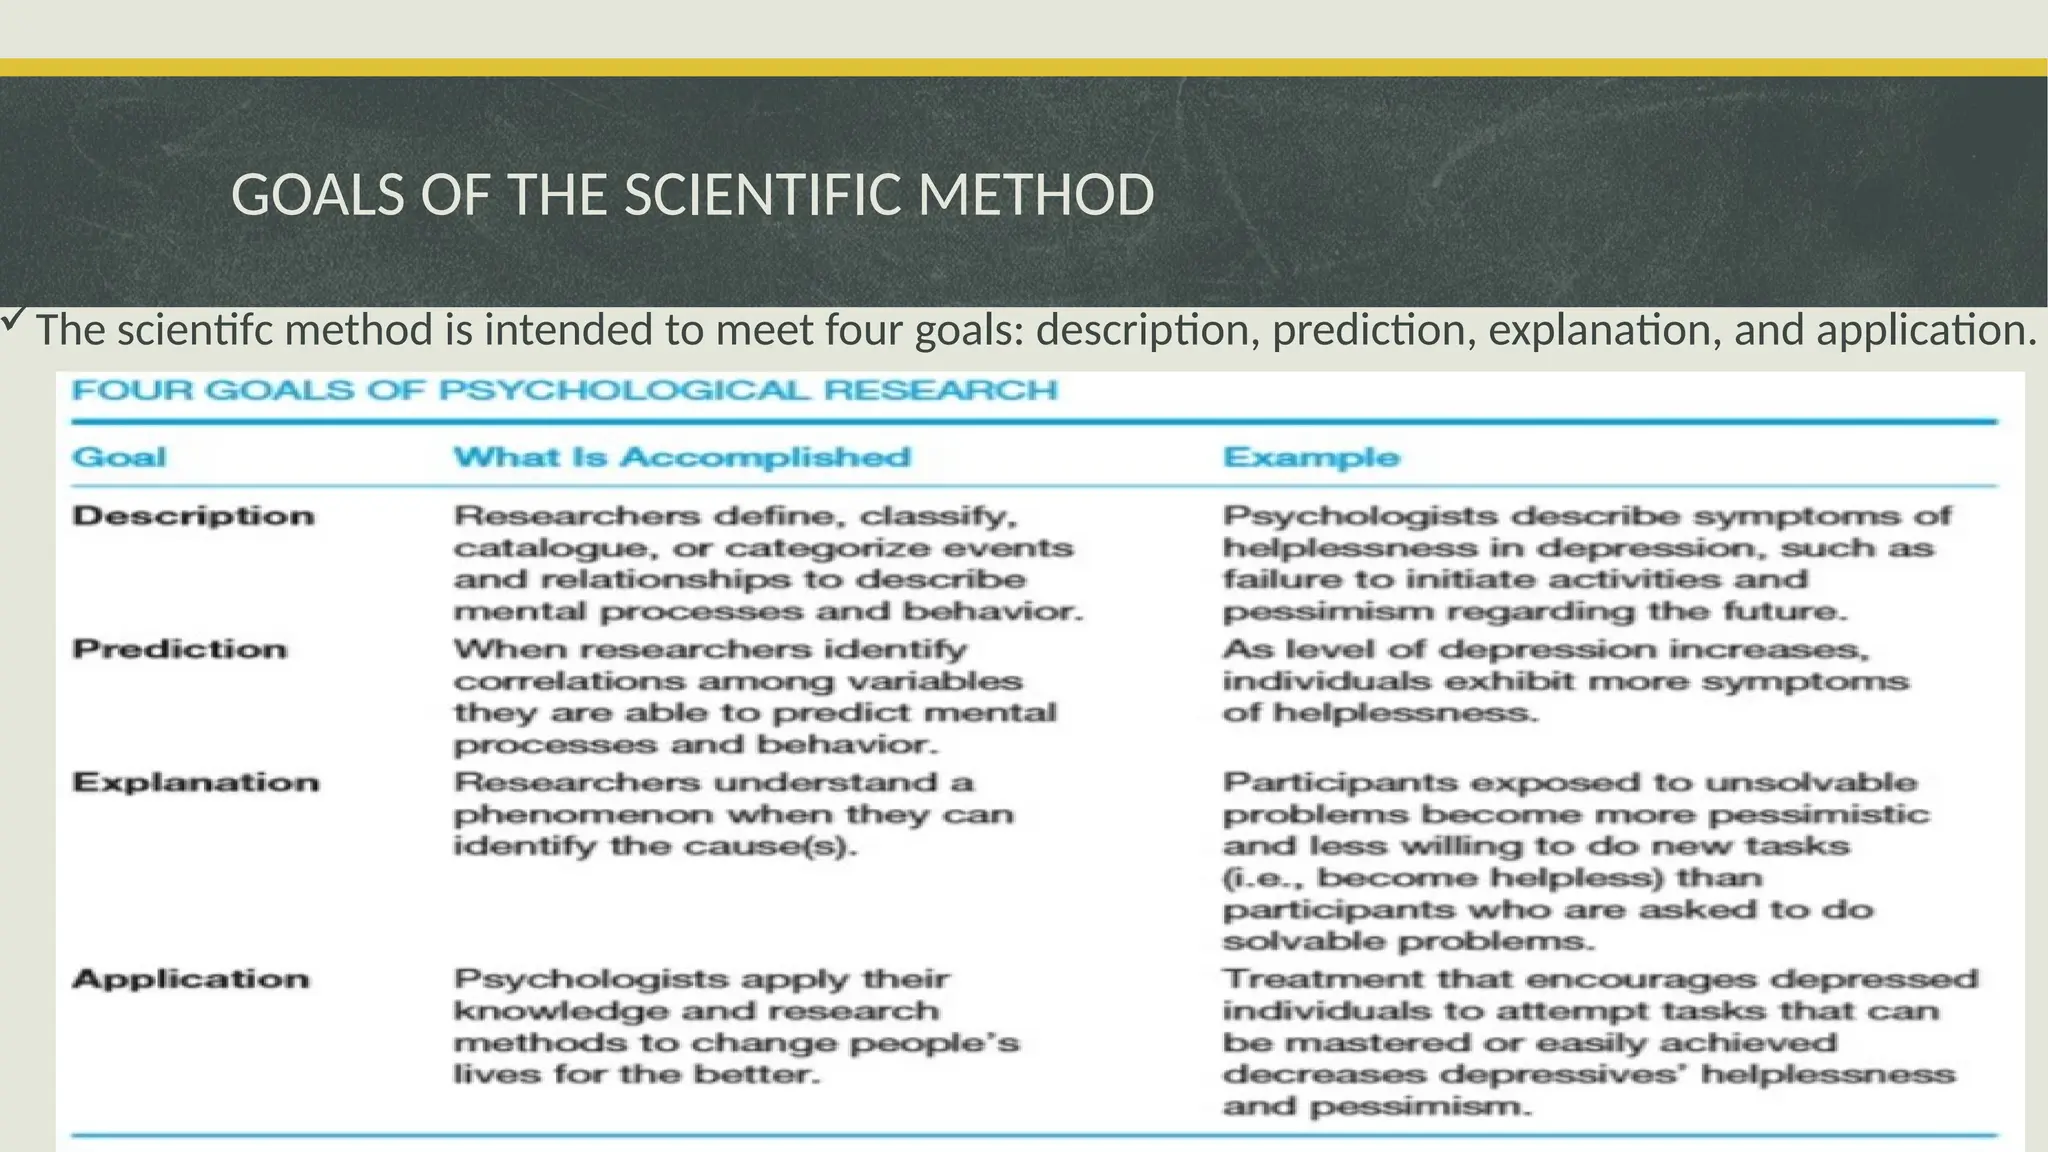
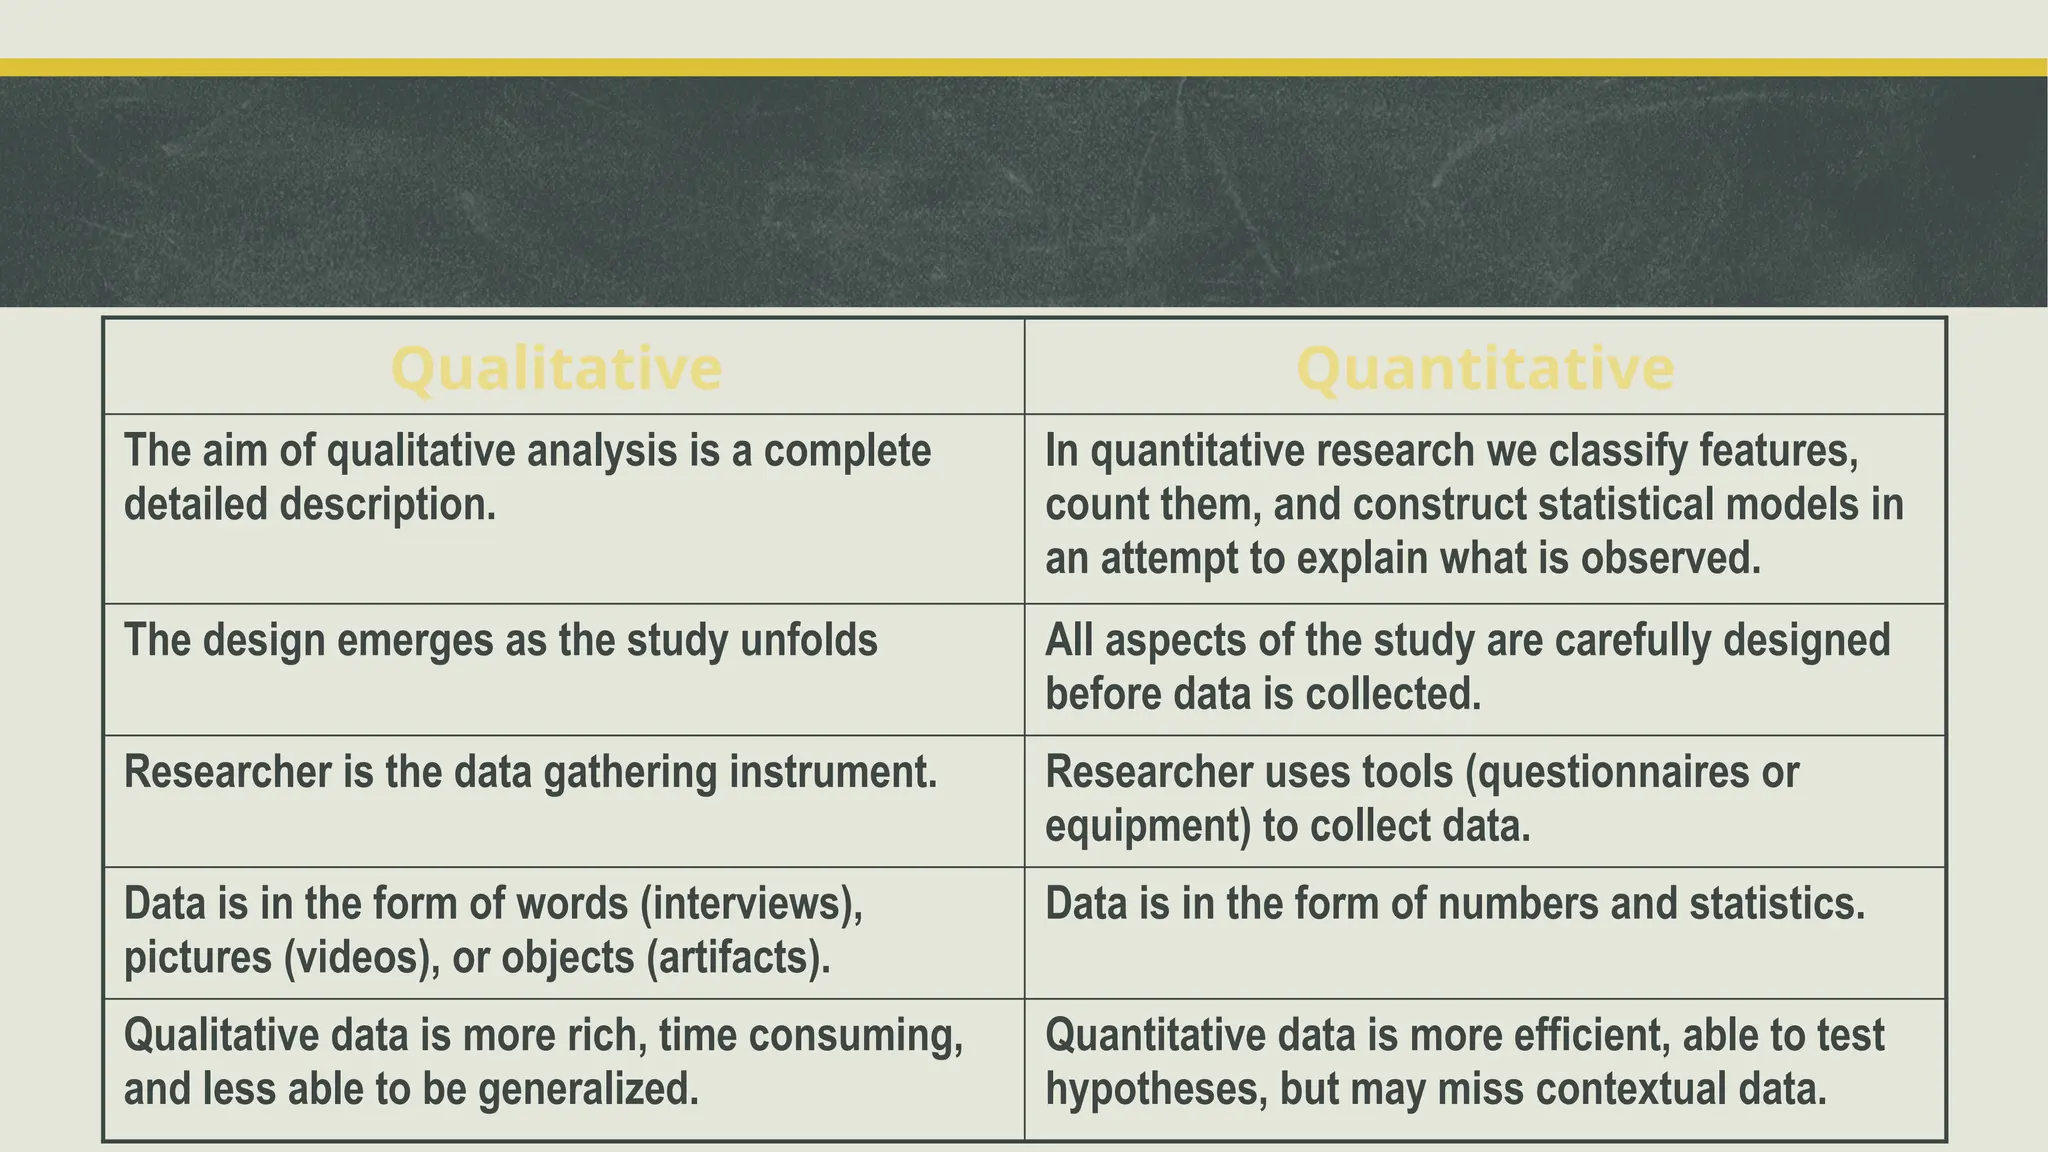
Variables
 Research is all about variables! What is a variable?
 A variable is a quantity or quality that can be different at different times or
indifferent places.
 In psychology we are mainly interested in properties that vary from person to
person or within the same person at different times. These could include: age;
race; gender; number of hours slept each night; size of cerebral hemispheres;
level of awareness; type of brain damage; capacity of short-term memory;
learning ability; type of psychological illness – the list is really endless.
 Every experiment has at least one independent and one dependent variable.
 An independent variable (IV) is deliberately manipulated or varied in some way
by the experimenter. This is planned before the experiment begins. Simple
experiments use one independent variable with two values (male/female;
yes/no) – in the research by Kearins it was Aboriginal Australians/non-Aboriginal
Australians. In a more complex experiment the IV could be continuous – that is, it
could have a range of values on a scale; for example, age, body mass, IQ, blood
alcohol content (BAC), optimism.
 The dependent variable (DV) is the property that is measured in the research. Its
value depends on the IV and that is why it is called ‘dependent’. The DV is
therefore the property that the researcher believes will change as a result of
changes in the value of the IV. The DV is usually continuous (that is, has any value
within a certain range) and should be stated as an operational definition.
Examples of independent and dependent variables
Research Question Independent variable(s) Dependent variable(s)
Do tomatoes grow fastest under
fluorescent, incandescent, or
natural light?
The type of light the tomato plant is
grown under
The rate of growth of the tomato plant
What is the effect of diet and
regular soda on blood sugar
levels?
The type of soda you drink (diet or
regular)
Your blood sugar levels
How does phone use before
bedtime affect sleep?
The amount of phone use before bed Number of hours of sleep
Quality of sleep
How well do different plant
species tolerate salt water?
The amount of salt added to the
plants’ water
Plant growth
Plant wilting
Plant survival rate
 The independent variable is the variable the experimenter manipulates or
changes, and is assumed to have a direct effect on the dependent variable. For
example, allocating participants to either drug or placebo conditions
(independent variable) in order to measure any changes in the intensity of their
anxiety (dependent variable).
 In an experiment, the researcher is looking for the possible effect on the
dependent variable that might be caused by changing the independent variable.
OPERATIONAL DEFINITIONS
 Operationalisation of a variable means that it is stated in terms that show how it
is measured.
For example:
- age: operationalised as age in total months
- IQ: operationalised as the score on a 40- item multiple choice test
- agression operationalised as the number of agressive responses in an observed
30- minute period.
Measurement
 Scientists use two type of measurements to record the careful and controlled
observations that characterize the scientific method:
Physical measurement – involves dimensions for which there is an agreed-upon
standard and an instrument for doing the measuring. E.g. length.
Psychological measurement – for measuring constructs that can’t be measured
physically,
e.g. aggression, intelligence. In a sense, the human observer is the instrument for
psychological measurement. E.g. if several independent observers agree that a
certain action warrants a rating of 3 on a 7-point rating scale, that is a psychological
measurement of the action
 Measurements must be valid and reliable:
Validity = refers to the “truthfulness of a measure. Does the measure of a
construct measure what it claims to measure?
Reliability = the consistency of the measurement.
- Instrument reliability = whether an instrument works consistency.
Hypotheses
 A hypothesis is a tentative explanation for a phenomenon. They frequently try to answer the
questions “How?” and “Why?” At one level, a hypothesis may simply suggest how particular
variables are related. At a theoretical level, a hypothesis may offer a reason (why) for the way
particular variables are related.
 One characteristic that distinguishes casual, everyday hypotheses from scientific hypotheses
is testability. If a hypothesis cannot be tested it is not useful to science. Three types of
hypotheses fail to pass the “testability test”. A hypothesis is not testable when:
Its constructs are not adequately defined or measured.
The hypothesis is circular – when an event itself is used as an explanation of the event.
The hypothesis appeals to ideas not recognized by science – science deals with the
observable, the demonstrable, the empirical.
GOALS OF THE SCIENTIFIC METHOD
The scientifc method is intended to meet four goals: description, prediction, explanation, and application.
Description
Psychologists seek to describe events and relationships between variables.
 Researchers can use nomothetic or ideographic approaches. Nomothetic is most
common.
-The nomothetic approach = psychologists try to establish broad generalizations
and general laws that apply to a diverse population. Researchers seek to describe
the “average,” or typical, performance of a group.
- Ideographic approach = researchers study the individual rather than groups.
 Researchers can use quantitative or qualitative analysis. Quantitative is most common.
- Quantitative research = refers to studies in which the findings are mainly the product of
statistical summary and analysis.
- Qualitative research = produces verbal summaries of research findings with few
statistical summaries or analysis.
 The data of qualitative research are most commonly obtained from interviews and
observations and can be used to describe individuals, groups, and social movements.
 Central to qualitative research is that investigators ask participants to describe their
experiences in ways that are meaningful to them, rather than to use categories
established by theorists and previous research.
Quantitative approaches
 Attempts to explain phenomena by collecting and analysing numerical data
 Tells you if there is a “difference” but not necessarily why
 Data collected are always numerical and analysed using statistical methods
 Variables are controlled as much as possible (RCD as the gold standard) so we can
eliminate interference and measure the effect of any change
 Randomisation to reduce subjective bias
 If there are no numbers involved, its not quantitative
 Some types of research lend themselves better to quant approaches than others
Quantitative data
 Data sources include
 Surveys where there are a large number of respondents (esp where you have used a
Likert scale)
 Observations (counts of numbers and/or coding data into numbers)
 Secondary data (government data; SATs scores etc)
 Analysis techniques include hypothesis testing, correlations and cluster analysis
What quantitative researchers worry about
 Is my sample size big enough?
 Have I used the correct statistical test?
 have I reduced the likelihood of making Type I and/or Type II errors?
 Are my results generalisable?
 Are my results/methods/results reproducible?
 Am I measuring things the right way?
What’s wrong with quantitative research?
 Some things can’t be measured – or measured accurately
 Doesn’t tell you why
 Can be impersonal – no engagement with human behaviours or individuals
 Data can be static – snapshots of a point in time
 Can tell a version of the truth (or a lie?)
“Lies, damned lies and statistics” – persuasive power of numbers
Qualitative approaches
 Any research that doesn’t involve numerical data
 Instead uses words, pictures, photos, videos, audio recordings. Field notes,
generalities. Peoples’ own words.
 Tends to start with a broad question rather than a specific hypothesis
 Develop theory rather than start with one
 inductive rather than deductive
Gathering qualitative data
 Tends to yield rich data to explore how and why things happened
 Don’t need large sample sizes (in comparison to quantitative research)
 Some issues may arise, such as
 Respondents providing inaccurate or false information – or saying what they think
the researcher wants to hear
 Ethical issues may be more problematic as the researcher is usually closer to
participants
 Researcher objectivity may be more difficult to achieve
Sources of qualitative data
 Interviews (structured, semi-structured or unstructured)
 Focus groups
 Questionnaires or surveys
 Secondary data, including diaries, self-reporting, written accounts of past
events/archive data and company reports;
 Direct observations – may also be recorded (video/audio)
 Ethnography
What qualitative researchers worry about
 Have I coded my data correctly?
 Have I managed to capture the situation in a realistic manner?
 Have I described the context in sufficient detail?
 Have I managed to see the world through the eyes of my participants?
 Is my approach flexible and able to change?
What’s wrong with qualitative research?
 It can be very subjective
 It can’t always be repeated
 It can’t always be generalisable
 It can’t always give you definite answers in the way that quantitative research can
 It can be easier to carry out (or hide) ‘bad’ (poor quality) qual research than ‘bad’
quant research
Qualitative Quantitative
The aim of qualitative analysis is a complete
detailed description.
In quantitative research we classify features,
count them, and construct statistical models in
an attempt to explain what is observed.
The design emerges as the study unfolds All aspects of the study are carefully designed
before data is collected.
Researcher is the data gathering instrument. Researcher uses tools (questionnaires or
equipment) to collect data.
Data is in the form of words (interviews),
pictures (videos), or objects (artifacts).
Data is in the form of numbers and statistics.
Qualitative data is more rich, time consuming,
and less able to be generalized.
Quantitative data is more efficient, able to test
hypotheses, but may miss contextual data.

dependent and independent variable in research

  • 1.
    Variables  Research isall about variables! What is a variable?  A variable is a quantity or quality that can be different at different times or indifferent places.  In psychology we are mainly interested in properties that vary from person to person or within the same person at different times. These could include: age; race; gender; number of hours slept each night; size of cerebral hemispheres; level of awareness; type of brain damage; capacity of short-term memory; learning ability; type of psychological illness – the list is really endless.
  • 2.
     Every experimenthas at least one independent and one dependent variable.  An independent variable (IV) is deliberately manipulated or varied in some way by the experimenter. This is planned before the experiment begins. Simple experiments use one independent variable with two values (male/female; yes/no) – in the research by Kearins it was Aboriginal Australians/non-Aboriginal Australians. In a more complex experiment the IV could be continuous – that is, it could have a range of values on a scale; for example, age, body mass, IQ, blood alcohol content (BAC), optimism.
  • 3.
     The dependentvariable (DV) is the property that is measured in the research. Its value depends on the IV and that is why it is called ‘dependent’. The DV is therefore the property that the researcher believes will change as a result of changes in the value of the IV. The DV is usually continuous (that is, has any value within a certain range) and should be stated as an operational definition.
  • 4.
    Examples of independentand dependent variables Research Question Independent variable(s) Dependent variable(s) Do tomatoes grow fastest under fluorescent, incandescent, or natural light? The type of light the tomato plant is grown under The rate of growth of the tomato plant What is the effect of diet and regular soda on blood sugar levels? The type of soda you drink (diet or regular) Your blood sugar levels How does phone use before bedtime affect sleep? The amount of phone use before bed Number of hours of sleep Quality of sleep How well do different plant species tolerate salt water? The amount of salt added to the plants’ water Plant growth Plant wilting Plant survival rate
  • 5.
     The independentvariable is the variable the experimenter manipulates or changes, and is assumed to have a direct effect on the dependent variable. For example, allocating participants to either drug or placebo conditions (independent variable) in order to measure any changes in the intensity of their anxiety (dependent variable).  In an experiment, the researcher is looking for the possible effect on the dependent variable that might be caused by changing the independent variable.
  • 7.
    OPERATIONAL DEFINITIONS  Operationalisationof a variable means that it is stated in terms that show how it is measured. For example: - age: operationalised as age in total months - IQ: operationalised as the score on a 40- item multiple choice test - agression operationalised as the number of agressive responses in an observed 30- minute period.
  • 8.
    Measurement  Scientists usetwo type of measurements to record the careful and controlled observations that characterize the scientific method: Physical measurement – involves dimensions for which there is an agreed-upon standard and an instrument for doing the measuring. E.g. length. Psychological measurement – for measuring constructs that can’t be measured physically, e.g. aggression, intelligence. In a sense, the human observer is the instrument for psychological measurement. E.g. if several independent observers agree that a certain action warrants a rating of 3 on a 7-point rating scale, that is a psychological measurement of the action
  • 9.
     Measurements mustbe valid and reliable: Validity = refers to the “truthfulness of a measure. Does the measure of a construct measure what it claims to measure? Reliability = the consistency of the measurement. - Instrument reliability = whether an instrument works consistency.
  • 10.
    Hypotheses  A hypothesisis a tentative explanation for a phenomenon. They frequently try to answer the questions “How?” and “Why?” At one level, a hypothesis may simply suggest how particular variables are related. At a theoretical level, a hypothesis may offer a reason (why) for the way particular variables are related.  One characteristic that distinguishes casual, everyday hypotheses from scientific hypotheses is testability. If a hypothesis cannot be tested it is not useful to science. Three types of hypotheses fail to pass the “testability test”. A hypothesis is not testable when: Its constructs are not adequately defined or measured. The hypothesis is circular – when an event itself is used as an explanation of the event. The hypothesis appeals to ideas not recognized by science – science deals with the observable, the demonstrable, the empirical.
  • 11.
    GOALS OF THESCIENTIFIC METHOD The scientifc method is intended to meet four goals: description, prediction, explanation, and application.
  • 12.
    Description Psychologists seek todescribe events and relationships between variables.  Researchers can use nomothetic or ideographic approaches. Nomothetic is most common. -The nomothetic approach = psychologists try to establish broad generalizations and general laws that apply to a diverse population. Researchers seek to describe the “average,” or typical, performance of a group. - Ideographic approach = researchers study the individual rather than groups.
  • 13.
     Researchers canuse quantitative or qualitative analysis. Quantitative is most common. - Quantitative research = refers to studies in which the findings are mainly the product of statistical summary and analysis. - Qualitative research = produces verbal summaries of research findings with few statistical summaries or analysis.  The data of qualitative research are most commonly obtained from interviews and observations and can be used to describe individuals, groups, and social movements.  Central to qualitative research is that investigators ask participants to describe their experiences in ways that are meaningful to them, rather than to use categories established by theorists and previous research.
  • 14.
    Quantitative approaches  Attemptsto explain phenomena by collecting and analysing numerical data  Tells you if there is a “difference” but not necessarily why  Data collected are always numerical and analysed using statistical methods  Variables are controlled as much as possible (RCD as the gold standard) so we can eliminate interference and measure the effect of any change  Randomisation to reduce subjective bias  If there are no numbers involved, its not quantitative  Some types of research lend themselves better to quant approaches than others
  • 15.
    Quantitative data  Datasources include  Surveys where there are a large number of respondents (esp where you have used a Likert scale)  Observations (counts of numbers and/or coding data into numbers)  Secondary data (government data; SATs scores etc)  Analysis techniques include hypothesis testing, correlations and cluster analysis
  • 16.
    What quantitative researchersworry about  Is my sample size big enough?  Have I used the correct statistical test?  have I reduced the likelihood of making Type I and/or Type II errors?  Are my results generalisable?  Are my results/methods/results reproducible?  Am I measuring things the right way?
  • 17.
    What’s wrong withquantitative research?  Some things can’t be measured – or measured accurately  Doesn’t tell you why  Can be impersonal – no engagement with human behaviours or individuals  Data can be static – snapshots of a point in time  Can tell a version of the truth (or a lie?) “Lies, damned lies and statistics” – persuasive power of numbers
  • 18.
    Qualitative approaches  Anyresearch that doesn’t involve numerical data  Instead uses words, pictures, photos, videos, audio recordings. Field notes, generalities. Peoples’ own words.  Tends to start with a broad question rather than a specific hypothesis  Develop theory rather than start with one  inductive rather than deductive
  • 19.
    Gathering qualitative data Tends to yield rich data to explore how and why things happened  Don’t need large sample sizes (in comparison to quantitative research)  Some issues may arise, such as  Respondents providing inaccurate or false information – or saying what they think the researcher wants to hear  Ethical issues may be more problematic as the researcher is usually closer to participants  Researcher objectivity may be more difficult to achieve
  • 20.
    Sources of qualitativedata  Interviews (structured, semi-structured or unstructured)  Focus groups  Questionnaires or surveys  Secondary data, including diaries, self-reporting, written accounts of past events/archive data and company reports;  Direct observations – may also be recorded (video/audio)  Ethnography
  • 21.
    What qualitative researchersworry about  Have I coded my data correctly?  Have I managed to capture the situation in a realistic manner?  Have I described the context in sufficient detail?  Have I managed to see the world through the eyes of my participants?  Is my approach flexible and able to change?
  • 22.
    What’s wrong withqualitative research?  It can be very subjective  It can’t always be repeated  It can’t always be generalisable  It can’t always give you definite answers in the way that quantitative research can  It can be easier to carry out (or hide) ‘bad’ (poor quality) qual research than ‘bad’ quant research
  • 23.
    Qualitative Quantitative The aimof qualitative analysis is a complete detailed description. In quantitative research we classify features, count them, and construct statistical models in an attempt to explain what is observed. The design emerges as the study unfolds All aspects of the study are carefully designed before data is collected. Researcher is the data gathering instrument. Researcher uses tools (questionnaires or equipment) to collect data. Data is in the form of words (interviews), pictures (videos), or objects (artifacts). Data is in the form of numbers and statistics. Qualitative data is more rich, time consuming, and less able to be generalized. Quantitative data is more efficient, able to test hypotheses, but may miss contextual data.

Editor's Notes

  • #19 owever, there are some pitfalls to qualitative research, such as: If respondents do not see a value for them in the research, they may provide inaccurate or false information. They may also say what they think the researcher wishes to hear. Qualitative researchers therefore need to take the time to build relationships with their research subjects and always be aware of this potential. Although ethics are an issue for any type of research, there may be particular difficulties with qualitative research because the researcher may be party to confidential information. It is important always to bear in mind that you must do no harm to your research subjects. It is generally harder for qualitative researchers to remain apart from their work. By the nature of their study, they are involved with people. It is therefore helpful to develop habits of reflecting on your part in the work and how this may affect the research. See our page on Reflective Practice for more. Find more at: http://www.skillsyouneed.com/learn/quantitative-and-qualitative.html#ixzz40SxYY76I