Download to read offline


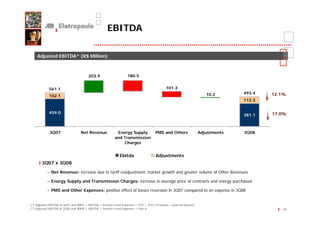


Eletropaulo reported financial results for 3Q08. Total consumption increased 4.9% compared to 3Q07. Adjusted EBITDA decreased 12.1% to R$493.4 million. Net income decreased 24.9% to R$148.3 million. Gross revenue increased 11.3% due to an 8.01% tariff increase and market growth. Costs increased due to higher energy prices and provisions. The company maintained a strong financial position with net debt decreasing 14.8% and cash availability of R$1.373 billion.


![Eletropaulo 1 q10_eng_final [modo de compatibilidade]](https://cdn.slidesharecdn.com/ss_thumbnails/eletropaulo1q10engfinalmododecompatibilidade-100517082821-phpapp01-thumbnail.jpg?width=640&height=640&fit=bounds)


