Download to read offline


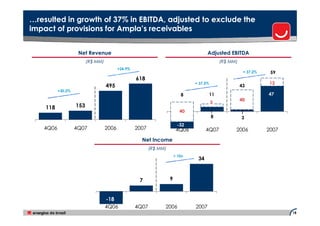


This presentation includes forward-looking statements about the company's future performance that are subject to risks and uncertainties. It summarizes the company's financial and operational highlights for 2007. Net income increased 11.6% over 2006. Consolidated EBITDA reached R$1,123 million, growing 4.6% over 2006. Generation segment EBITDA grew significantly due to increased capacity from new plants coming online. Distributed energy volumes grew 4.5% while manageable costs grew less than inflation.


