Download to read offline

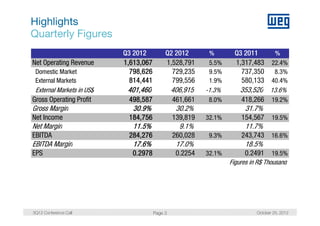
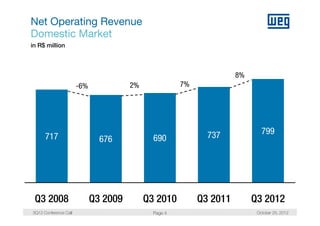
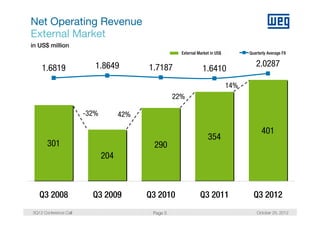
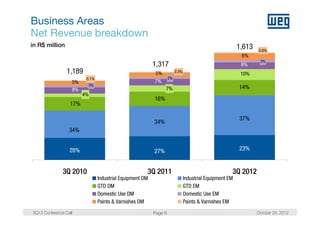
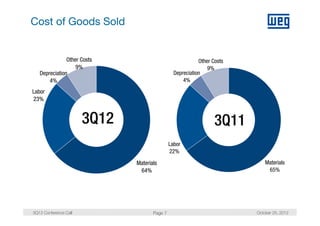
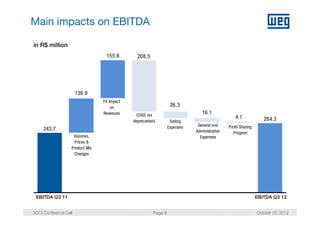
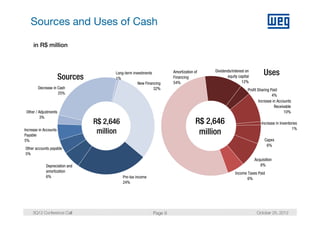
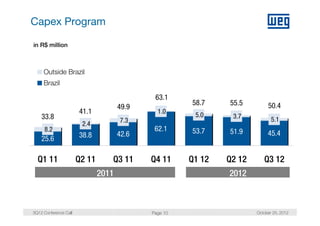

WEG reported financial results for the third quarter of 2012 with increases in key metrics compared to the same period in 2011. Net operating revenue grew 22.4% to R$1.61 billion with domestic market revenue up 8.3% and external markets revenue increasing 40.4%. Gross operating profit rose 19.2% to R$498.6 million and net income increased 19.5% to R$184.8 million. EBITDA grew 16.6% to R$284.3 million. The results demonstrated continued strong growth in both domestic and external markets. Management also provided details on capital expenditures and cash flow.


