Download to read offline


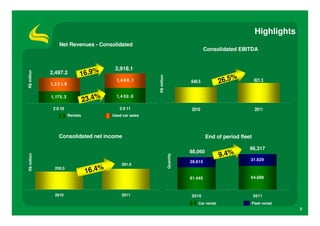


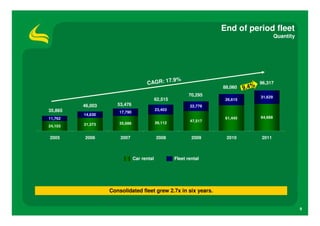


Localiza Rent a Car S.A. reported strong financial results for 4Q11 and full year 2011. Net revenues grew 16.9% in 2011 to R$2.9 billion, while consolidated EBITDA increased 26.5% to R$821 million. The company's car and fleet rental divisions both experienced significant growth in daily rentals and revenues over the past six years. Localiza also increased its fleet size by over 18,000 vehicles in 2011 through continued investment in its business.


